Full access
Influential Publications
Published Online: 10 January 2019

Shared Molecular Neuropathology Across Major Psychiatric Disorders Parallels Polygenic Overlap

Publication: FOCUS, A Journal of the American Psychiatric Association

Abstract

The predisposition to neuropsychiatric disease involves a complex, polygenic, and pleiotropic genetic architecture. However, little is known about how genetic variants impart brain dysfunction or pathology. We used transcriptomic profiling as a quantitative readout of molecular brain-based phenotypes across five major psychiatric disorders—autism, schizophrenia, bipolar disorder, depression, and alcoholism—compared with matched controls. We identified patterns of shared and distinct gene-expression perturbations across these conditions. The degree of sharing of transcriptional dysregulation is related to polygenic (single-nucleotide polymorphism–based) overlap across disorders, suggesting a substantial causal genetic component. This comprehensive systems-level view of the neurobiological architecture of major neuropsychiatric illness demonstrates pathways of molecular convergence and specificity.
(Gandal et al., “Shared molecular neuropathology across major psychiatric disorders parallels polygenic overlap” Science 09 Feb 2018:Vol. 359, Issue 6376, pp. 693-697 (DOI: 10.1126/science.aad6469). Reprinted with permission from AAAS)
Despite remarkable success identifying genetic risk factors for major psychiatric disorders, it remains unknown how genetic variants interact with environmental and epigenetic risk factors in the brain to impart risk for clinically distinct disorders (1, 2). We reasoned that brain transcriptomes—a quantitative, genome-wide molecular phenotype (3)—would allow us to determine whether disease-related signatures are shared across major neuropsychiatric disorders with distinct symptoms and whether these patterns reflect genetic risk.
We first analyzed published gene-expression microarray studies of the cerebral cortex across five major neuropsychiatric disorders (311) using 700 cerebral cortical samples from subjects with autism (ASD) (n = 50 samples), schizophrenia (SCZ) (n = 159), bipolar disorder (BD) (n = 94), depression (MDD) (n = 87), alcoholism (AAD) (n = 17), and matched controls (n = 293) (12). These disorders are prevalent and disabling, contributing substantially to global disease burden. Inflammatory bowel disease (IBD) (n = 197) was included as a non-neural comparison.
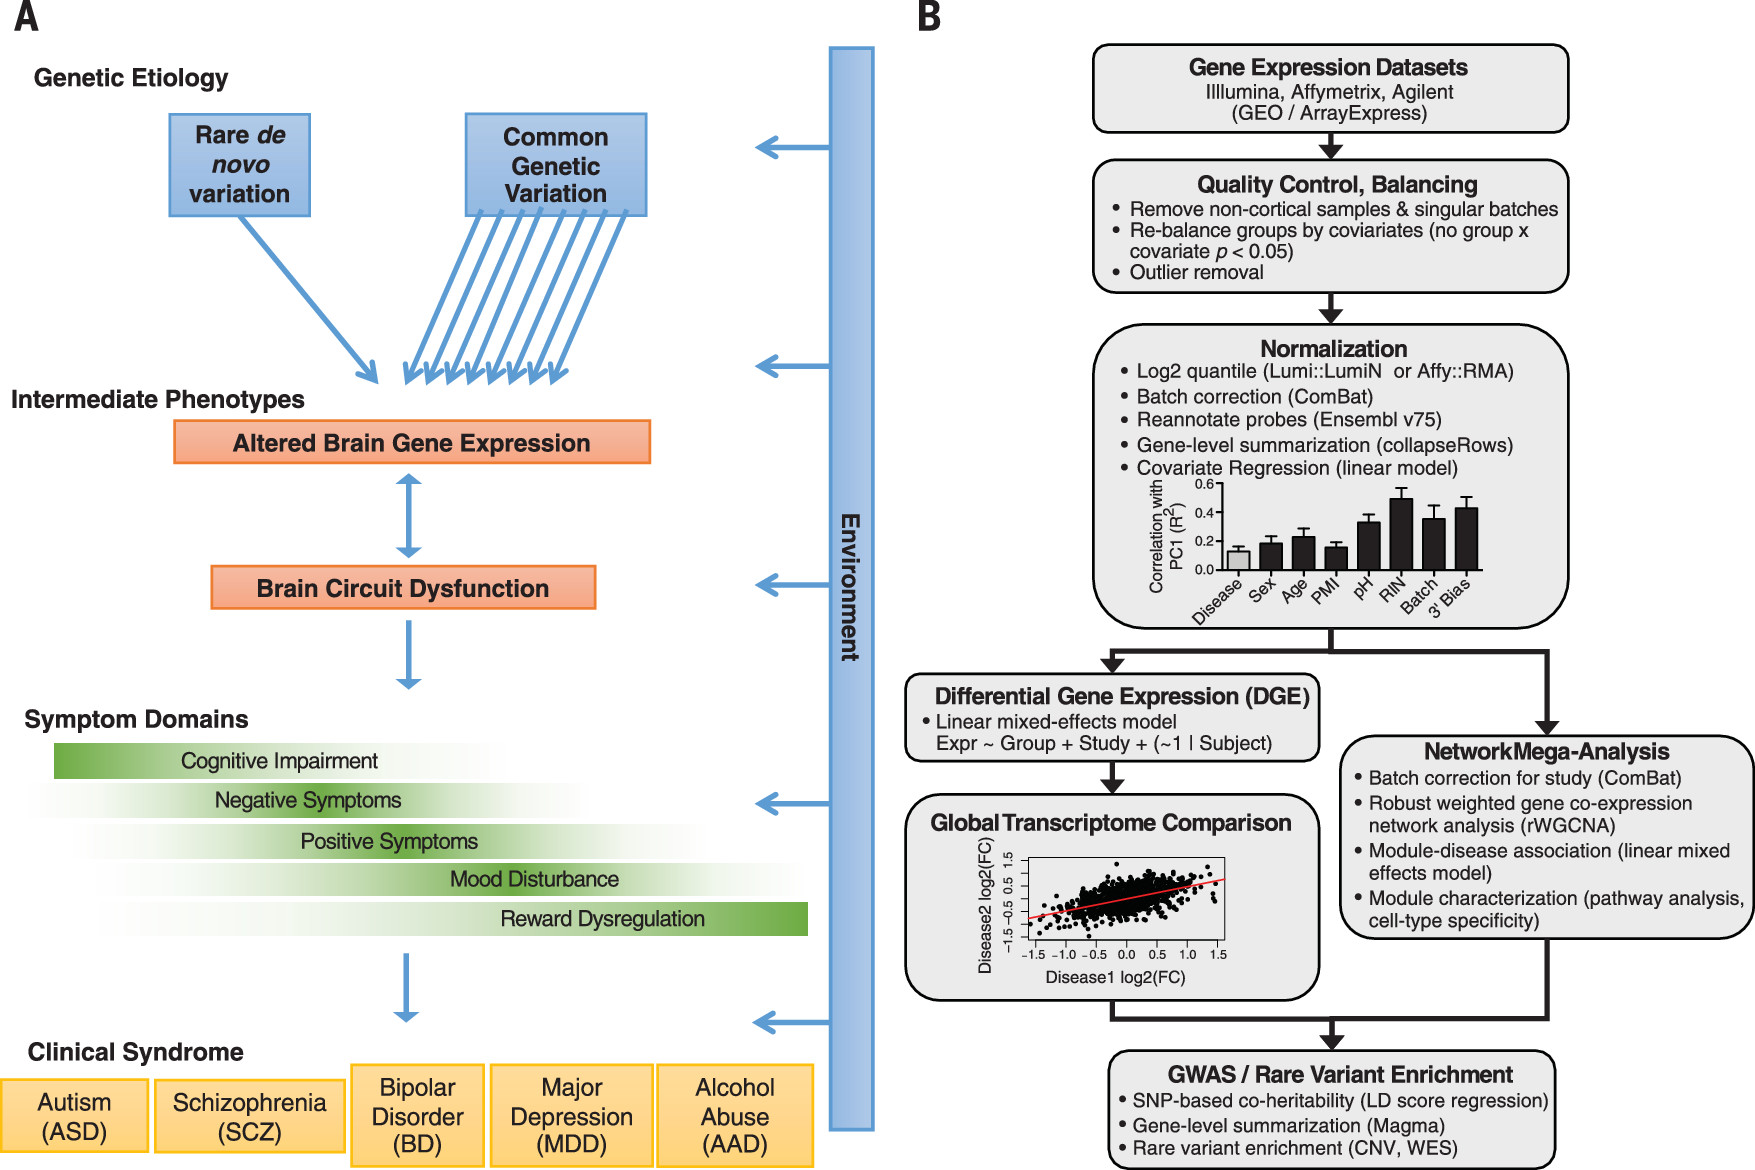
Individual data sets underwent stringent quality control and normalization (Fig. 1) (12), including rebalancing so as to alleviate confounding between diagnosis and biological (such as age and sex) or technical (such as post mortem interval, pH, RNA integrity number, batch, and 3’ bias) covariates (figs. S1 and S2). Transcriptome summary statistics for each disorder were computed with a linear mixed-effects model so as to account for any sample overlap across studies (12). Comparison of differential gene expression (DGE) log2 fold change (log
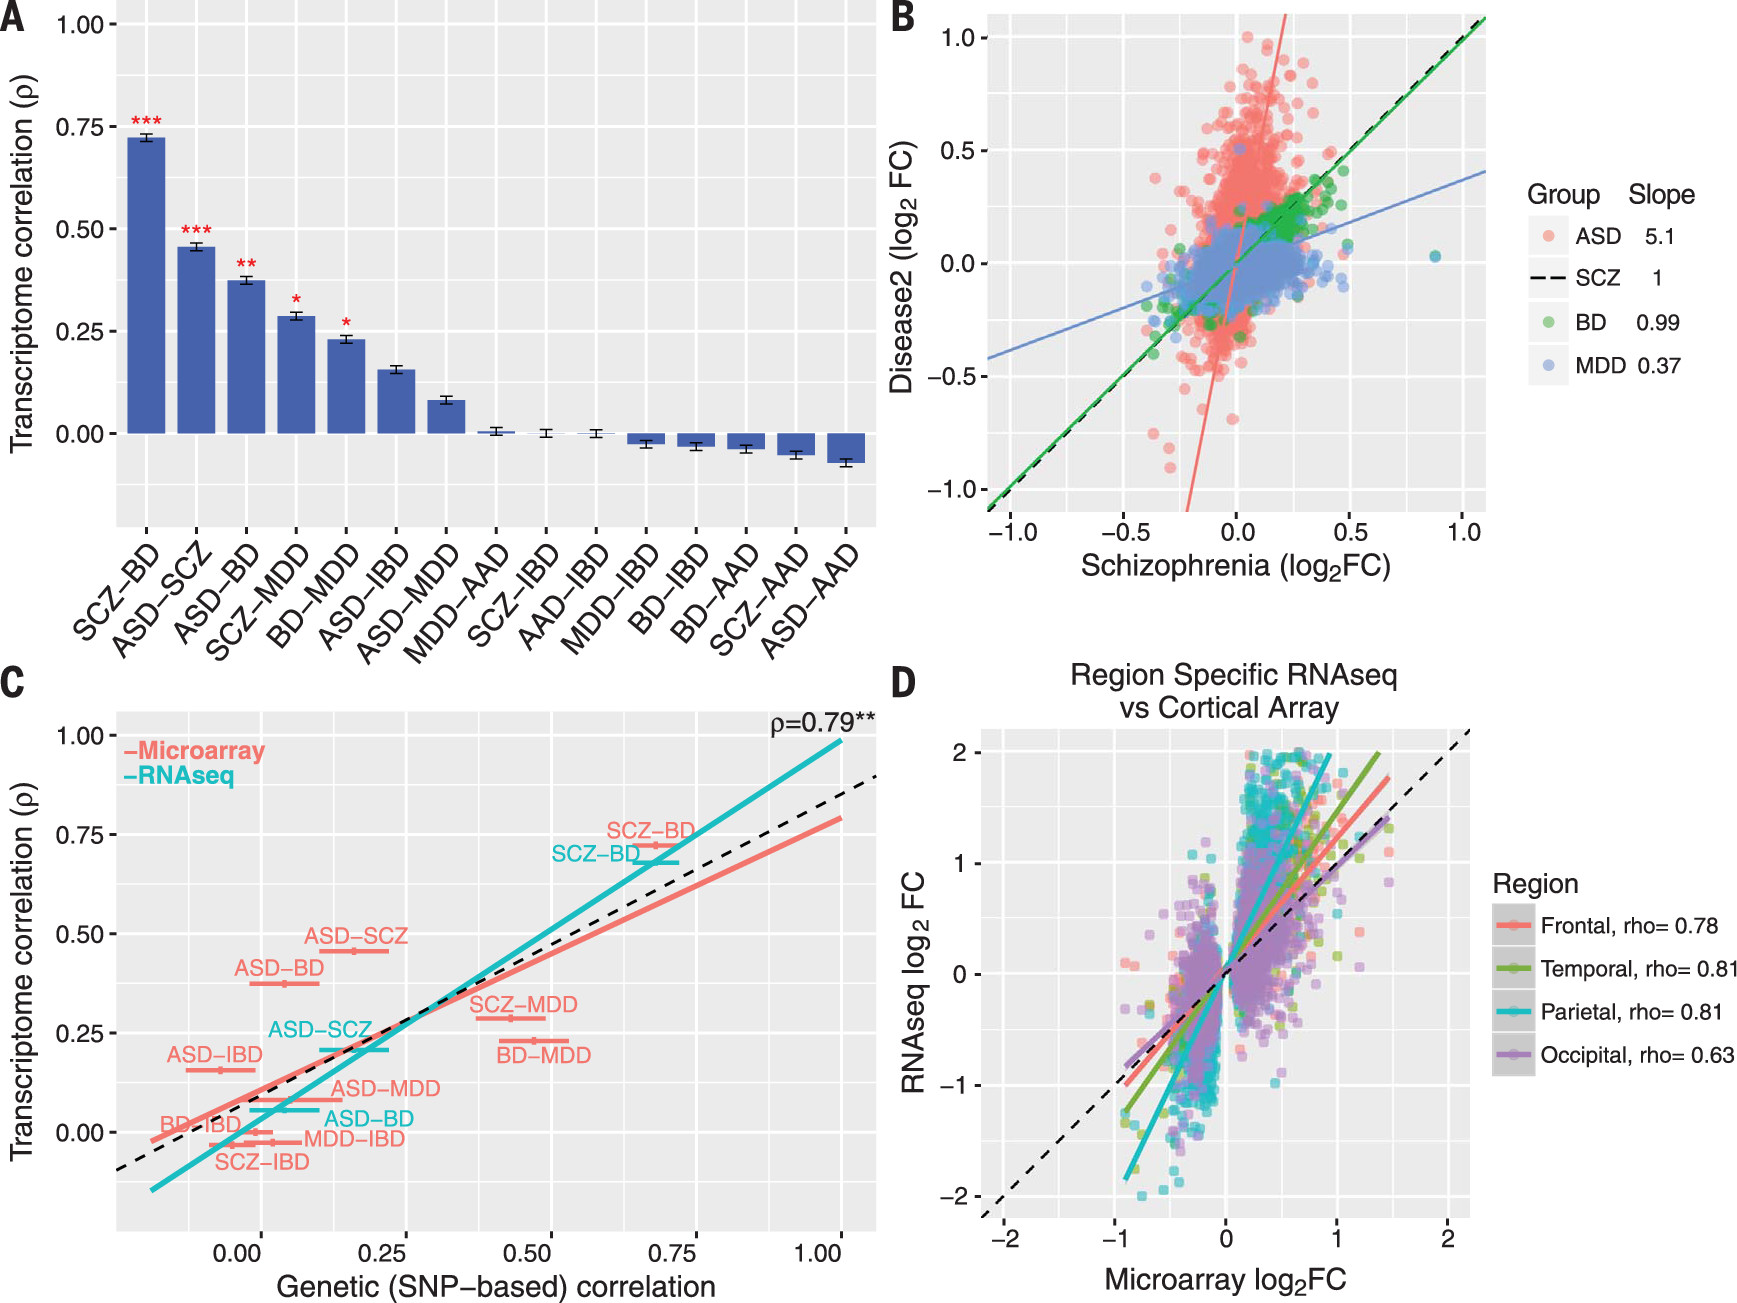
2FC) signatures revealed a significant overlap among ASD, SCZ, and BD and SCZ, BD, and MDD (all Spearman’s ρ ≥ 0.23, P < 0.05, 40,000 permutations) (Fig. 2A). The regression slopes between ASD, BD, andMDD log2-FC effect sizes compared with SCZ (5.08, 0.99, and 0.37, respectively) indicate a gradient of transcriptomic severity with ASD > SCZ ≈ BD > MDD (Fig. 2B). To ensure robustness, we compared multiple methods for batch correction, probe summarization, and feature selection, including use of integrative correlations, none of which changed the qualitative observations (fig. S3) (12). Results were also unaltered after first regressing gene-level RNA degradation metrics, suggesting that systematic sample quality issues were unlikely to drive these correlations (fig. S3). Further, the lack of (or negative) overlap between AAD and other disorders suggests that similarities are less likely due to comorbid substance abuse, poor overall general health, or general brain-related post-mortem artefacts.
Figure 1. Experimental Rationale and Designa
a A color version of the figure, as originally published, appears in the online version of this article (focus.psychiatryonline.org).
A Model of psychiatric disease pathogenesis.
B Flowchart of the cross-disorder transcriptome analysis pipeline (12). Cortical gene expression data sets were compiled from cases of ASD (n = 50 samples), SCZ (n = 159), BD (n = 94), MDD (n = 87), AAD (n = 17), and matched non-psychiatric controls (n = 293) (table S1) (12).
Figure 2. Cortical Gene Expression Patterns Overlapa
a A color version of the figure, as originally published, appears in the online version of this article (focus.psychiatryonline.org).
A Rank order of microarray transcriptome similarity for all disease pairs, as measured with Spearman’s correlation of differential expression log2FC values.
B Comparison of the slopes among significantly associated disease pairs indicates a gradient of transcriptomic severity, with ASD > SCZ ∼ BD > MDD.
C Overlapping gene expression patterns across diseases are correlated with shared common genetic variation, as measured with SNP coheritability (22). The y axis shows transcriptome correlations using microarray-based (discovery, red) and RNA-seq (replication, blue) data sets.
D RNA-seq across all cortical lobes in ASD replicates microarray results and demonstrates a consistent transcriptomic pattern. Spearman’s ρ is shown for comparison between microarray and region-specific RNA-seq replication data sets (all P < 10−14). Plots show mean ± SEM. *P < 0.05, **P < 0.01, ***P < 0.001.
Disease-specific DGE summary statistics (data table S1) provide human in vivo benchmarks for determining the relevance of model organisms, in vitro systems, or drug effects (13, 14). We identified a set of concordantly down-and up-regulated genes across disorders (fig. S4) as well as those with more specific effects. Complement component 4A (C4A), the top genome-wide association study (GWAS)–implicated SCZ disease gene (15), was significantly up-regulated in SCZ (log2FC = 0.23, P = 6.9 × 10⁶) and in ASD [RNA sequencing (RNA-seq); log2FC = 0.91, P = 0.014] (data table S1) but not in BD, MDD, or AAD. To investigate potential confounding by psychiatric medications, we compared disease signatures with those from nonhuman primates treated with acute or chronic dosing of antipsychotic medications. Significant negative overlap (fig. S5) (12) was observed, indicating that antipsychotics are unlikely to drive, but rather may partially normalize, these transcriptomic alterations, whereas the psychotomimetic phencyclidine partially recapitulates disease signatures.
To validate that these transcriptomic relationships are generalizable, we generated independent RNA-seq data sets for replication for three out of the five disorders (fig. S6) (12). We identified 1099 genes whose DGE is replicated in ASD [odds ratio (OR) 6.4, P = 3.3 × 10−236, Fisher’ sexact test] (table S2), 890 genes for SCZ (BrainGVEX; OR 4.5, P = 7.6 × 10−155), and 112 genes for BD (BrainGVEX; OR 3.9, P = 4.6 × 10⁻²⁶), which is likely due to the relatively smaller RNA-seq sample size for BD (12). We observed similarly high levels of transcriptomic overlap among ASD, SCZ, and BD and a similar gradient of transcriptomic severity (Fig. 2C and fig. S7). The SCZ and BD patterns were further replicated in the CommonMind data set, although gene-level overlap was lower (fig. S7) (12, 16). The ASD signature was qualitatively consistent across the four major cortical lobules, indicating that this pattern is not caused by regional differences (Fig. 2D).
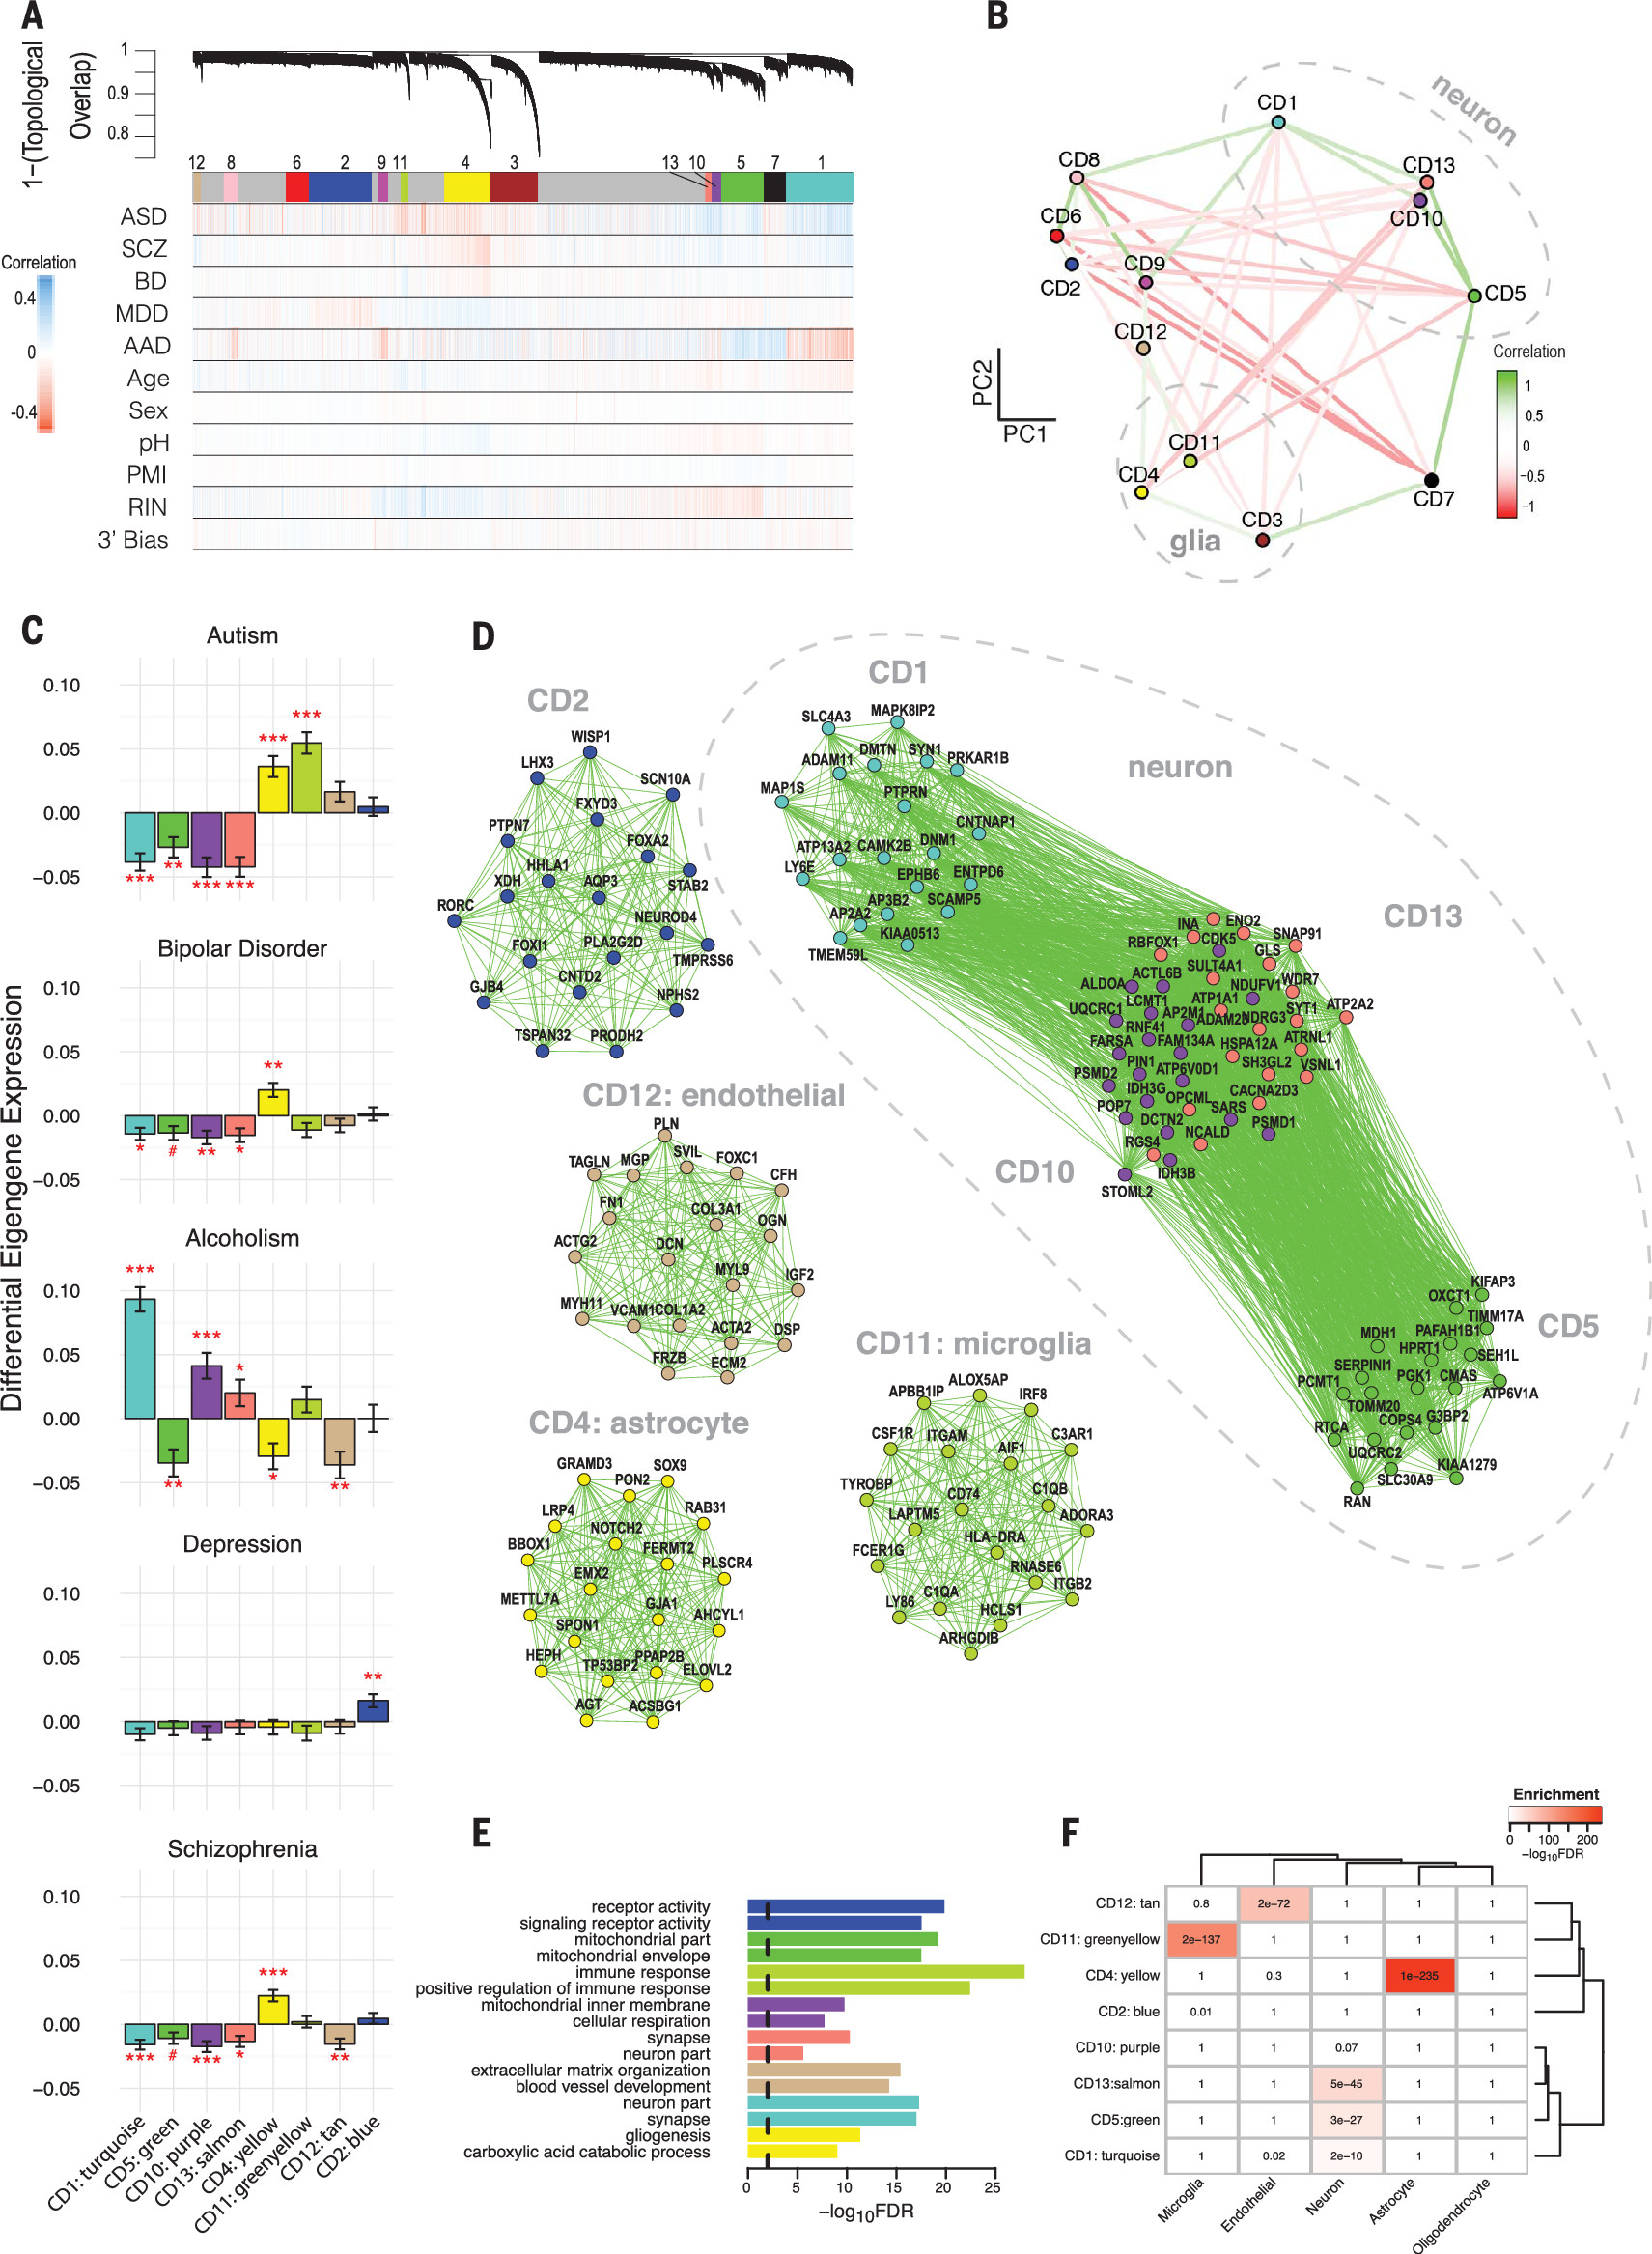
To more specifically characterize the biological pathways involved, we performed robust weighted gene coexpression network analysis (rWGCNA) (12, 17), identifying several shared and disorder specific coexpression modules (Fig. 3). Modules were stable (fig. S8), showed greater association with disease than other biological or technical covariates (fig. S9), and were not dependent on corrections for covariates or batch effects (fig. S10). Moreover, each module was enriched for protein-protein interactions (fig. S8) and brain enhancer-RNA co-regulation (fig. S11) derived from independent data, which provides anchors for dissecting protein complexes and regulatory relationships.
Figure 3. Network Analysis Identifies Modules of Coexpressed Genes Across Disease
A Network dendrogram from coexpression topological overlap of genes across disorders. Color bars show correlation of gene expression with disease status, biological, and technical covariates.
B Multidimensional scaling plot demonstrates relationship between modules and clustering by cell-type relationship.
C Module-level differential expression is perturbed across disease states. Plots show β values from linear mixed-effect model of module eigengene association with disease status (FDR-corrected #P < 0.1, *P < 0.05, **P < 0.01, ***P < 0.001).
D The top 20 hub genes are plotted for modules most disrupted in disease. A complete list of genes’ module membership (kME) is provided in data table S2. Edges are weighted by the strength of correlation between genes.
E and F Modules are characterized by E Gene Ontology enrichment (top two pathways shown for each module) and F cell-type specificity, on the basis of RNA-seq of purified cell populations from healthy human brain samples (25).
An astrocyte-related module (CD4 and hubs GJA1 and SOX9) was broadly up-regulated in ASD, BD, and SCZ [false discovery rate (FDR)–corrected P < 0.05] (Fig. 3C and data table S2) (12) and enriched for glial cell differentiation and fatty-acid metabolism pathways. By contrast, a module strongly enriched for microglial markers (CD11) was up-regulated specifically in ASD (twosided t test, FDR-corrected P = 4 × 10⁻⁹). Hubs include canonical microglial markers (HLA-DRA and AIF1), major components of the complement. system (C1QA and C1QB), and TYROBP, a microglial signaling adapter protein (18). Results fit with convergent evidence for microglial up-regulation in ASD and an emerging understanding that microglia play a critical role regulating synaptic function during neurodevelopment (19).
One module, CD2, was up-regulated specifically in MDD (FDR-corrected P = 0.009) (data table S2) and was enriched for G protein–coupled receptors, cytokine-cytokine interactions, and hormone activity pathways, suggesting a link between inflammation and dysregulation of the hypothalamic-pituitary (HPA) axis, which is consistent with current models of MDD pathophysiology (20). Several modules annotated as neuronal/mitochondrial were down-regulated across ASD, SCZ, and BD (CD1, CD10, and CD13) (Fig. 3C and data table S2) (12). The overlap of CD10 with a mitochondrial gene-enriched module previously associated with neuronal firing rate (21) links energetic balance, synaptic transmission, and psychiatric disease (data table S2).
The transcriptome may reflect the cause or the consequence of a disorder. To refine potential causal links, we compared single-nucleotide polymorphism (SNP)–based genetic correlations between disease pairs (22) with their corresponding transcriptome overlap. SNP coheritability was significantly correlated with transcriptome overlap across the same disease pairs (Spearman’s ρ = 0.79, 95% confidence interval 0.43 to 0.93, P = 0.0013) (Fig. 2C), suggesting that a major component of these gene-expression patterns reflects biological processes coupled to underlying genetic variation.
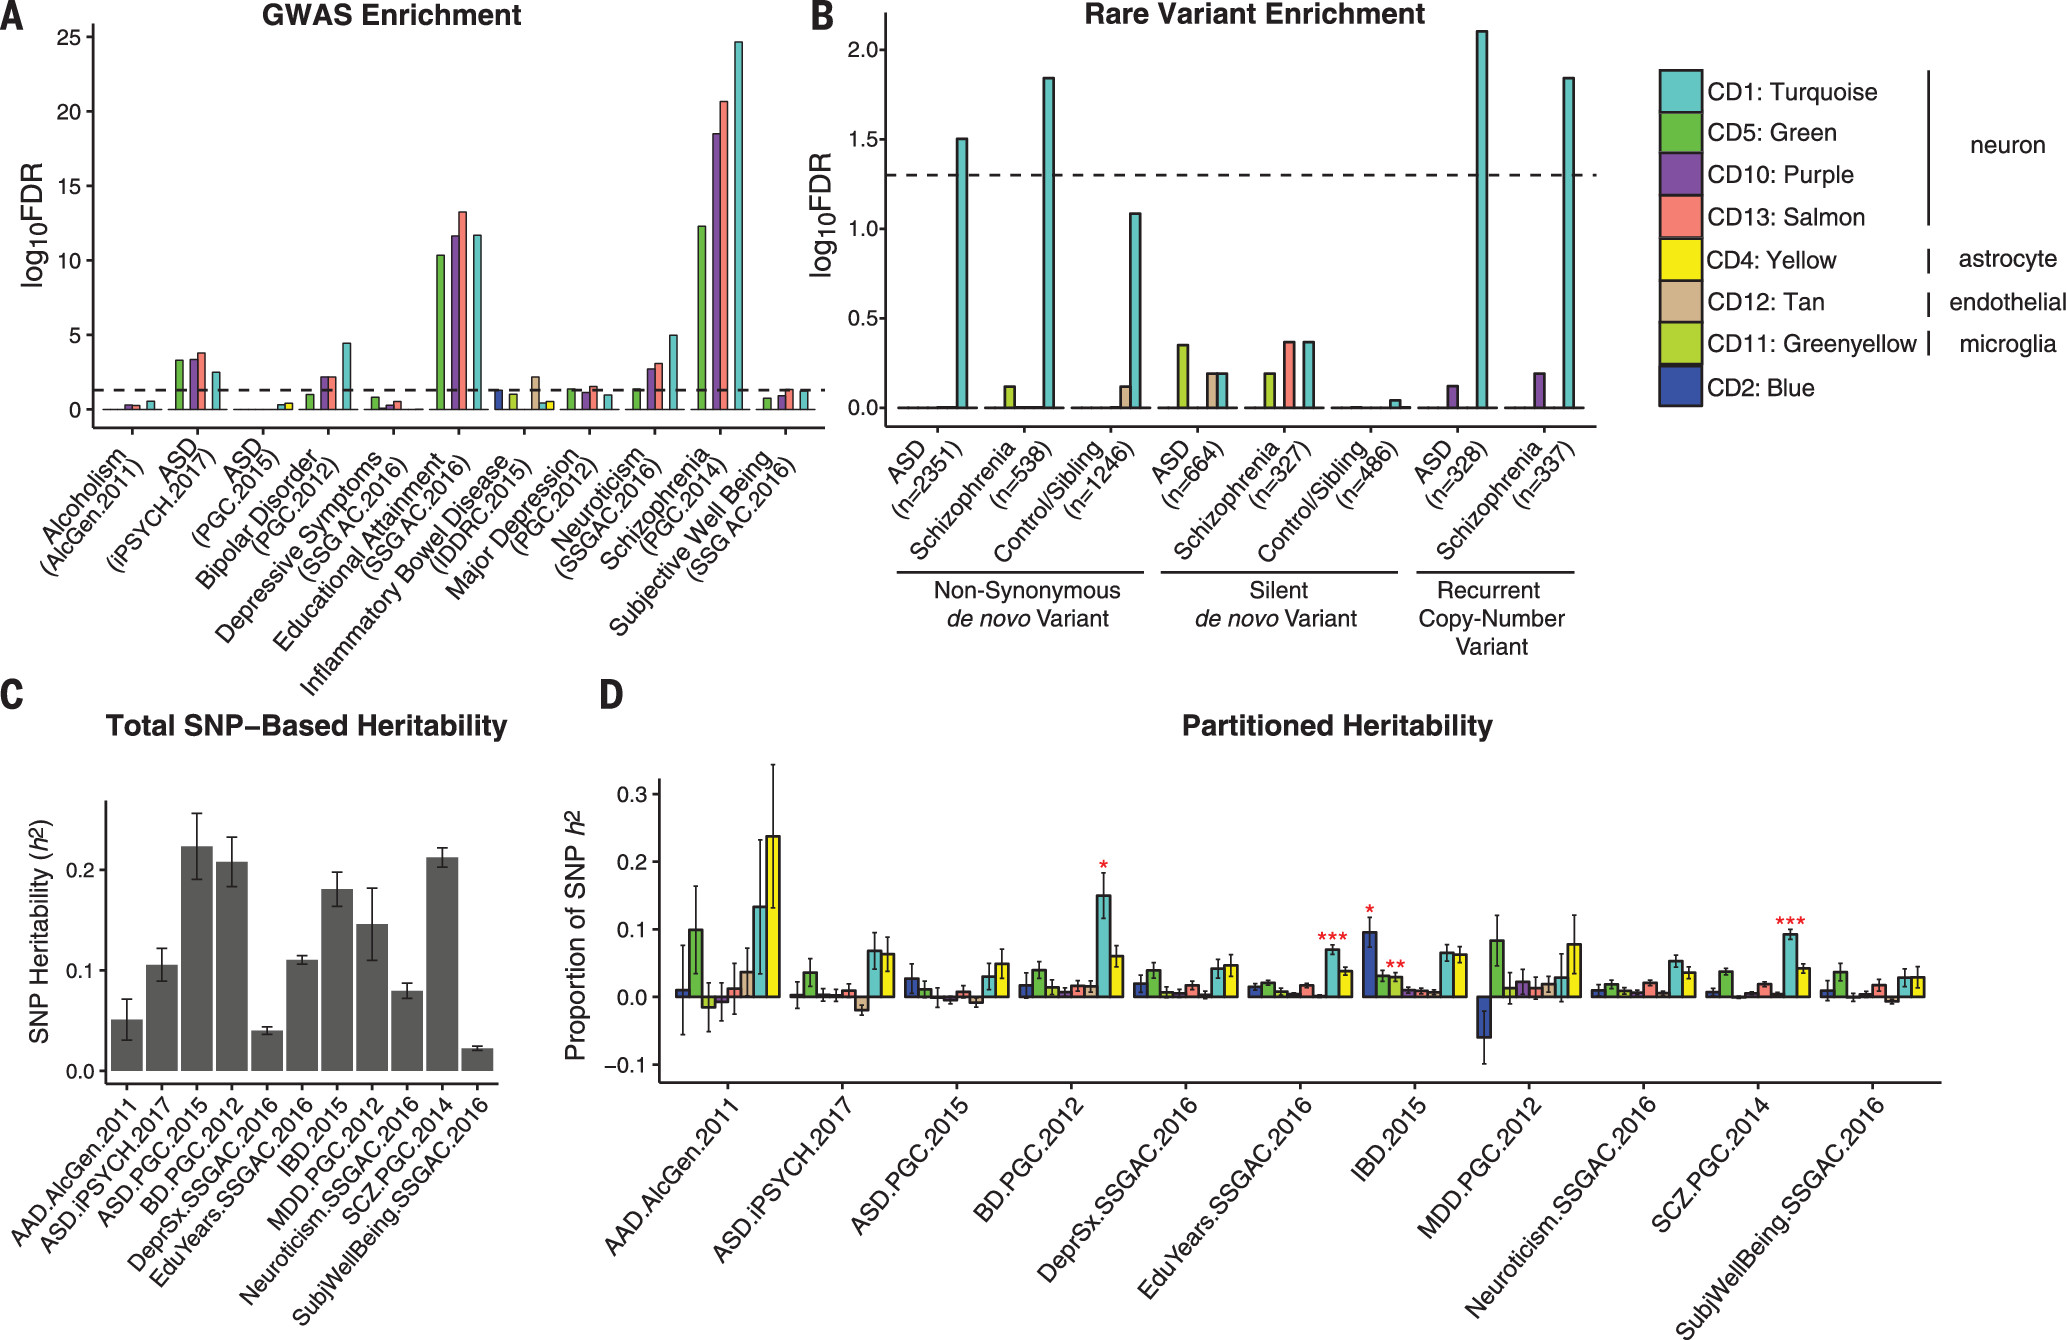
To determine how disease-associated variants may influence specific biological processes, we investigated whether any modules harbor genetic susceptibility for specific disorders or for relevant cognitive or behavioral traits (12). We identified significant enrichment among several of the down-regulated, neuronal coexpression modules (CD1, CD10, and CD13) for GWAS signal from SCZ and BD, as well as for educational attainment and neuroticism (FDR-corrected P < 0.05, Spearman) (Fig. 4A) (12). We also observed enrichment for the three down-regulated neuronal coexpression modules in the iPSYCH Consortium (23) ASD GWAS cohort (Fig. 4A and table S3) (12). By contrast, these modules showed no enrichment for MDD, AAD, or IBD. Further, none of the microglial- or astrocyte-specific modules showed psychiatric GWAS enrichment. Extending this analysis to disease-associated rare variants (data table S3) (2, 12), we found that the CD1 neuronal module was enriched for genes harbouring rare, nonsynonymous de novo mutations identified in ASD (OR 1.36, FDR-corrected P = 0.03, logistic regression) and SCZ cases (OR 1.82, FDR-corrected P = 0.014) but not unaffected controls (Fig. 4B). A similar CD1-enrichment was observed for genes affected by rare, recurrent copy-number variation (CNV) in ASD (OR 2.52, FDR-corrected P = 0.008) and SCZ (OR 2.46, FDR-corrected P = 0.014). These results suggest convergence of common and rare genetic variation acting to down-regulate synaptic function in ASD and SCZ.
Figure 4. Down-regulated Neuronal Modules are Enriched for Common and Rare Genetic risk factorsa
a A color version of the figure, as originally published, appears in the online version of this article (focus.psychiatryonline.org).
A Significant enrichment is observed for SCZ-, ASD-, and BD-associated common variants from GWAS among neuron/synapse and mitochondrial modules (12). GWAS data sets are listed in table S3.
B The CD1 neuronal module shows significant enrichment for ASD- and SCZ-associated nonsynonymous de novo variants from whole-exome sequencing. The number of genes affected by different classes of rare variants is shown in parentheses. Significance was calculated by using logistic regression, correcting for gene length. P values are FDR-corrected.
C Total SNP-based heritability (liability scale for psychiatric diagnoses) calculated from GWAS by using LD-score regression.
D Proportion of heritability for each disorder or trait that can be attributed to individual coexpression modules. Significance (FDR-corrected *P < 0.05, **P < 0.01, ***P < 0.001) is from enrichment statistics comparing the proportion of SNP heritability within the module divided by the proportion of total SNPs represented. The CD1 module shows significant enrichment in SCZ, BD, and educational attainment.
We next used LD score regression (24) to partition GWAS heritability (Fig. 4C and data table S4) into the contribution from SNPs located within genes from each module (Fig. 4D) (12). CD1 again showed significant enrichment for SCZ (2.5-fold, FDR-corrected P = 8.9 × 10⁻¹¹), BD (3.9 fold, FDR-corrected P < 0.014), and educational attainment (1.9-fold, FDR-corrected P < 0.0008; χ2 test) GWAS, accounting for ∼10% of SNP-based heritability within each data set, despite containing only 3% of the SNPs. This illustrates how gene network analysis can begin to parse complex patterns of common variants, each of small effect size, to implicate specific biological roles for common variant risk across neuropsychiatric disorders.
These data provide a quantitative, genome-wide characterization of the cortical pathology across five major neuropsychiatric disorders, providing a framework for identifying the responsible molecular signaling pathways and interpreting genetic variants implicated in neuropsychiatric disease risk. We observed a gradient of synaptic gene down-regulation, with ASD > SZ ≈ BD. BD and SCZ appear most similar in terms of synaptic dysfunction and astroglial gene up-regulation, which may represent as trocytosis, activation, or both. ASD, an early-onset disorder, shows a distinct up-regulated microglial signature, which may reflect the role for microglia in regulation of synaptic connectivity during neurodevelopment (19). MDD shows neither the synaptic nor astroglial pathology but does exhibit dysregulation of HPA-axis and hormonal signaling not observed in the other disorders.
Our data suggest that shared genetic factors underlie a substantial proportion of cross-disorder expression overlap. Given that a minority of these relationships represent expression quantitative trait loci (fig. S12), most of the genetic effects are likely acting indirectly, through a cascade of developmental and cell-cell signaling events rooted in genetic risk. Genetic variation is also not the only driver of expression variation; there is undoubtedly a contribution from environmental effects. Hidden confounders could introduce a correlation structure that matches SNP-level genetic correlations, but parsimony and hidden covariate correction suggests that this is unlikely. Diagnostic misclassification could artificially elevate shared signals, but the results are robust to disorder removal (fig. S13), and misclassification would not account for the substantial overlap we observed with ASD, which has a highly distinct phenotypic trajectory from later onset disorders. Last, we have replicated broad transcriptomic and cell type–specific patterns independently for ASD, SCZ, and BD, providing an organizing pathological framework for future investigation of the mechanisms underlying specific gene- and isoform-level transcriptomic alterations in psychiatric disease.

References

1.
D. H. Geschwind, J. Flint, Science 349, 1489–1494 (2015).
2.
M. J. Gandal, V. Leppä, H. Won, et al: Nat. Neurosci. 19, 1397–1407 (2016).
3.
I. Voineagu et al: Nature 474, 380–384 (2011).
4.
K. Garbett et al: Neurobiol. Dis. 30, 303–311 (2008).
5.
M. L. Chow et al: PLOS Genet. 8, e1002592 (2012).
6.
C. Chen et al: Mol. Psychiatry 18, 1308–1314 (2013).
7.
P. R. Maycox et al: Mol. Psychiatry 14, 1083–1094 (2009).
8.
K. Iwamoto, M. Bundo, T. Kato, Hum. Mol. Genet. 14, 241–253 (2005).
9.
S. Narayan et al: Brain Res. 1239, 235–248 (2008).
10.
L.-C. Chang et al: PLOS ONE 9, e90980 (2014).
11.
I. Ponomarev, S. Wang, L. Zhang, et al: Mayfield, J. Neurosci. 32, 1884–1897 (2012).
12.
Materials and methods are available as supplementary materials.
13.
D. Prilutsky et al: Trends Mol. Med. 20, 91–104 (2014).
14.
J. Lamb et al: Science 313, 1929–1935 (2006).
15.
A. Sekar et al: Nature 530, 177–183 (2016).
16.
M. Fromer et al: Nat. Neurosci. 19, 1442–1453 (2016).
17.
P. Langfelder, S. Horvath, BMC Bioinformatics 9, 559 (2008).
18.
B. Zhang et al: Cell 153, 707–720 (2013).
19.
M. W. Salter, B. Stevens, Nat. Med. 23, 1018–1027 (2017).
20.
P. W. Gold, Mol. Psychiatry 20, 32–47 (2015).
21.
K. D. Winden et al: Mol. Syst. Biol. 5, 291 (2009).
22.
S. H. Lee et al: Nat. Genet. 45, 984–994 (2013).
23.
C. B. Pedersen et al:. Mol. Psychiatry 23, 6–14 (2018).
24.
H. K. Finucane et al: Nat. Genet. 47, 1228–1235 (2015).
25.
Y. Zhang et al: Neuron 89, 37–53 (2016).
26.
P. Du, W. A. Kibbe, S. M. Lin, Bioinformatics 24, 1547–1548 (2008).
27.
L. Gautier, L. Cope, B. M. Bolstad, et al: Bioinformatics 20, 307–315 (2004).
28.
G. K. Smyth, Stat. Appl. Genet. Mol. Biol. 3, e3 (2004).
29.
M. C. Oldham, P. Langfelder, S. Horvath, BMC Syst. Biol. 6, 63 (2012).
30.
W. E. Johnson, C. Li, A. Rabinovic, Biostatistics 8, 118–127 (2007).
31.
S. Durinck, P. T. Spellman, E. Birney, et al: Nat. Protoc. 4, 1184–1191 (2009).
32.
J. A. Miller et al: BMC Bioinformatics 12, 322 (2011).
33.
P. Langfelder, B. Zhang, S. Horvath, Bioinformatics 24, 719–720 (2008).
34.
N. N. Parikshak et al: Cell 155, 1008–1021 (2013).
35.
M. J. Mason, G. Fan, K. Plath, et al: BMC Genomics 10, 327 (2009).
36.
A. C. Zambon et al: Bioinformatics 28, 2209–2210 (2012).
37.
J. Reimand, T. Arak, J. Vilo, Nucleic Acids Res. 39 (suppl. 2), W307–W315 (2011).
38.
J. D. Dougherty, E. F. Schmidt, M. Nakajima, et al: Nucleic Acids Res. 38, 4218–4230 (2010).
39.
X. Xu, A. B. Wells, D. R. O’Brien, et al., J. Neurosci. 34, 1420–1431 (2014).
40.
Schizophrenia Working Group of the Psychiatric Genomics Consortium, Nature 511, 421–427 (2014).
41.
Psychiatric GWAS Consortium Bipolar Disorder Working Group, Nat. Genet. 43, 977–983 (2011).
42.
S. Ripke et al: Mol. Psychiatry 18, 497–511 (2013).
43.
Autism Spectrum Disorders Working Group of The Psychiatric Genomics Consortium, Mol. Autism 8, 21 (2017).
44.
G. Schumann et al: Proc. Natl. Acad. Sci. U.S.A. 108, 7119–7124 (2011).
45.
J. Z. Liu et al: Nat. Genet. 47, 979–986 (2015).
46.
A. Okbay et al: Nat. Genet. 48, 624–633 (2016).
47.
A. Okbay et al: Nature 533, 539–542 (2016).
48.
C. A. de Leeuw, J. M. Mooij, T. Heskes, et al: PLOS Comput. Biol. 11, e1004219 (2015).
49.
P. Munk-Jørgensen, P. B. Mortensen, Dan. Med. Bull. 44, 82–84 (1997).
50.
C. B. Pedersen et al: JAMA Psychiatry 71, 573–581 (2014).
51.
B. N. Howie, P. Donnelly, J. Marchini, PLOS Genet. 5, e1000529 (2009).
52.
B. Howie, J. Marchini, M. Stephens, G3 (Bethesda) 1, 457–470 (2011).
53.
N. Patterson, A. L. Price, D. Reich, PLOS Genet. 2, e190 (2006).
54.
A. Manichaikul et al: Bioinformatics 26, 2867–2873 (2010).
55.
C. C. Chang et al: Gigascience 4, 7 (2015).
56.
J. de Ligt et al: N. Engl. J. Med. 367, 1921–1929 (2012).
57.
S. De Rubeis et al: Nature 515, 209–215 (2014).
58.
M. Fromer et al: Nature 506, 179–184 (2014).
59.
S. L. Girard et al: Nat. Genet. 43, 860–863 (2011).
60.
S. Gulsuner et al: Cell 154, 518–529 (2013).
61.
I. Iossifov et al: Nature 515, 216–221 (2014).
62.
I. Iossifov et al: Neuron 74, 285–299 (2012).
63.
B. M. Neale et al: Nature 485, 242–245 (2012).
64.
B. J. O’Roak et al: Nature 485, 246–250 (2012).
65.
A. Rauch et al: Lancet 380, 1674–1682 (2012).
66.
S. J. Sanders et al: Nature 485, 237–241 (2012).
67.
B. Xu et al: Nat. Genet. 44, 1365–1369 (2012).
68.
G. Mi, Y. Di, S. Emerson, et al: PLOS ONE 7, e46128 (2012).
69.
D. Moreno-De-Luca et al: Mol. Psychiatry 18, 1090–1095 (2013).
70.
S. J. Sanders et al: Neuron 87, 1215–1233 (2015).
71.
B. K. Bulik-Sullivan et al: Nat. Genet. 47, 291–295 (2015).
72.
S. Akbarian et al: Nat. Neurosci. 18, 1707–1712 (2015).
73.
K. D. Hansen, R. A. Irizarry, Z. Wu, Biostatistics 13, 204–216 (2012).
74.
A. E. Jaffe et al: Proc. Natl. Acad. Sci. U.S.A. 114, 7130–7135 (2017).
75.
V. Reinhart et al: Neurobiol. Dis. 77, 220–227 (2015).
76.
L. Cope, X. Zhong, E. Garrett, et al: Stat. Appl. Genet. Mol. Biol. 3, e29 (2004).
77.
G. Parmigiani, E. S. Garrett-Mayer, R. Anbazhagan, et al: Clin. Cancer Res. 10, 2922–2927 (2004).
78.
M. V. Martin, K. Mirnics, L. K. Nisenbaum, et al: Mol. Neuropsychiatry 1, 82–93 (2015).
79.
P. Yao et al: Nat. Neurosci. 18, 1168–1174 (2015).
80.
K. G. Ardlie et al: Science 348, 648–660 (2015).
81.
A. van B. Granlund et al: PLOS ONE 8, e56818 (2013).
82.
C. L. Noble et al: Gut 57, 1398–1405 (2008).
83.
S. Girirajan et al: Am. J. Hum. Genet. 92, 221–237 (2013).
84.
D. Malhotra, J. Sebat, Cell 148, 1223–1241 (2012).
85.
S. J. Sanders et al: Neuron 70, 863–885 (2011).
86.
L. A. Weiss et al: N. Engl. J. Med. 358, 667–675 (2008).
87.
C. R. Marshall et al: Am. J. Hum. Genet. 82, 477–488 (2008).
88.
D. Moreno-De-Luca et al: Am. J. Hum. Genet. 87, 618–630 (2010).
89.
J. T. Glessner et al: Nature 459, 569–573 (2009).
90.
E. K. Green et al: Mol. Psychiatry 21, 89–93 (2016).
91.
J. T. Glessner et al: PLOS ONE 5, e15463 (2010).
92.
H. Stefansson et al: Nature 455, 232–236 (2008).
93.
J. L. Stone et al: Nature 455, 237–241 (2008).
94.
D. F. Levinson et al: Am. J. Psychiatry 168, 302–316 (2011).
95.
V. Vacic et al: Nature 471, 499–503 (2011).
96.
D. Rujescu et al: Hum. Mol. Genet. 18, 988–996 (2009).
97.
S. E. McCarthy et al: Nat. Genet. 41, 1223–1227 (2009).
98.
J. G. Mulle et al: Am. J. Hum. Genet. 87, 229–236 (2010).

Information & Authors

Information

Published In

Go to Focus
Go to Focus
FOCUS, A Journal of the American Psychiatric Association
Pages: 66 - 72

History

Published in print: Winter 2019
Published online: 10 January 2019

Authors

Details

CommonMind Consortium, PsychENCODE Consortium, iPSYCH-BROAD Working Group, Steve Horvath

Metrics & Citations

Metrics

Citations

Export Citations

If you have the appropriate software installed, you can download article citation data to the citation manager of your choice. Simply select your manager software from the list below and click Download.

For more information or tips please see 'Downloading to a citation manager' in the Help menu.

Format
Citation style
Style
Copy to clipboard

View Options

View options

PDF/ePub

View PDF/ePub

Get Access

Login options

Already a subscriber? Access your subscription through your login credentials or your institution for full access to this article.

Personal login Institutional Login Open Athens login
Purchase Options

Purchase this article to access the full text.

PPV Articles - Focus

PPV Articles - Focus

Not a subscriber?

Subscribe Now / Learn More

PsychiatryOnline subscription options offer access to the DSM-5-TR® library, books, journals, CME, and patient resources. This all-in-one virtual library provides psychiatrists and mental health professionals with key resources for diagnosis, treatment, research, and professional development.

Need more help? PsychiatryOnline Customer Service may be reached by emailing [email protected] or by calling 800-368-5777 (in the U.S.) or 703-907-7322 (outside the U.S.).

Media

Figures

Other

Tables

Share

Share

Share article link

Share