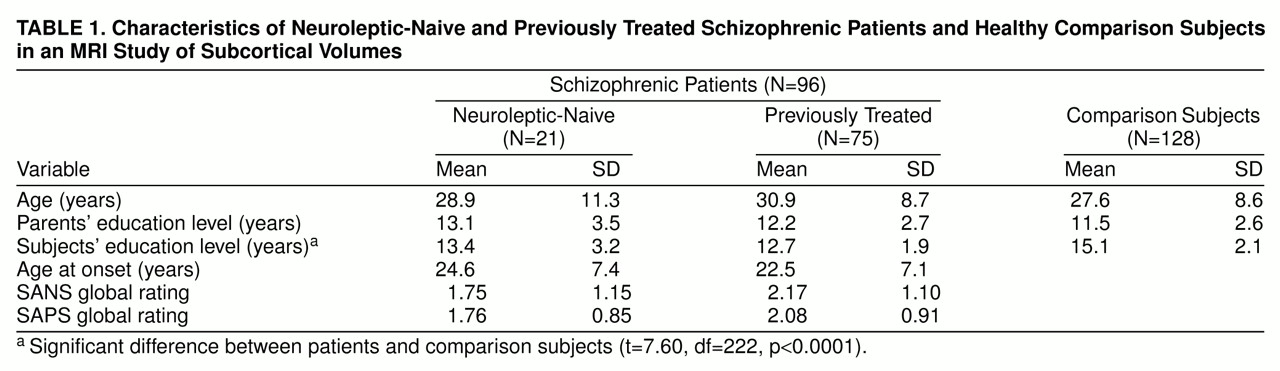
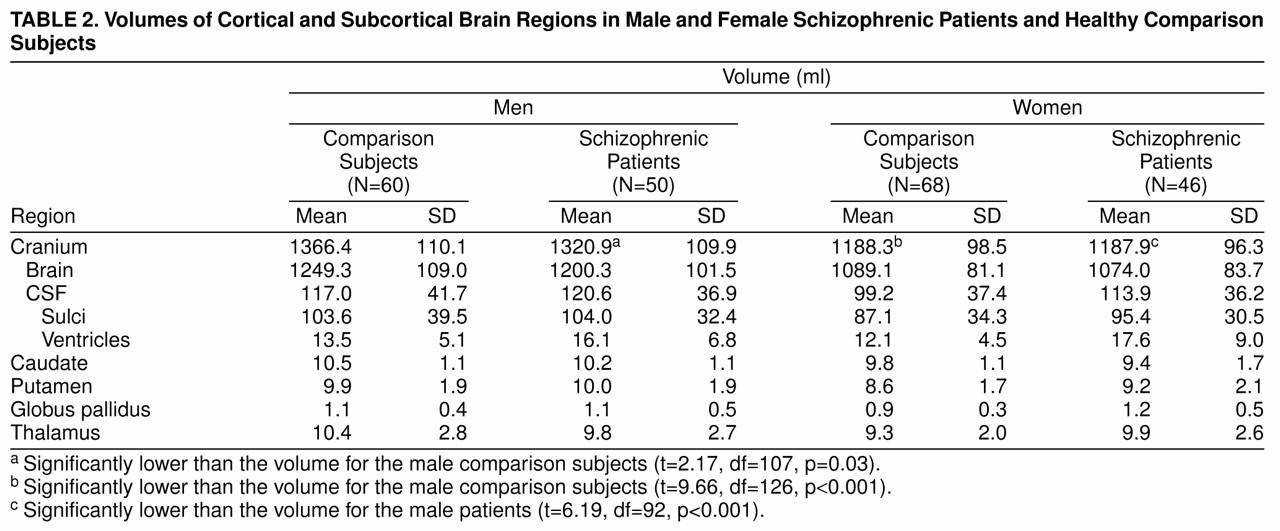
The volumes of brain compartments and subcortical regions are presented in
table 2. Cranial volume was lower in the male patients than in the healthy comparison men; among the women it was lower relative to the men in both the patients and the healthy comparison subjects.
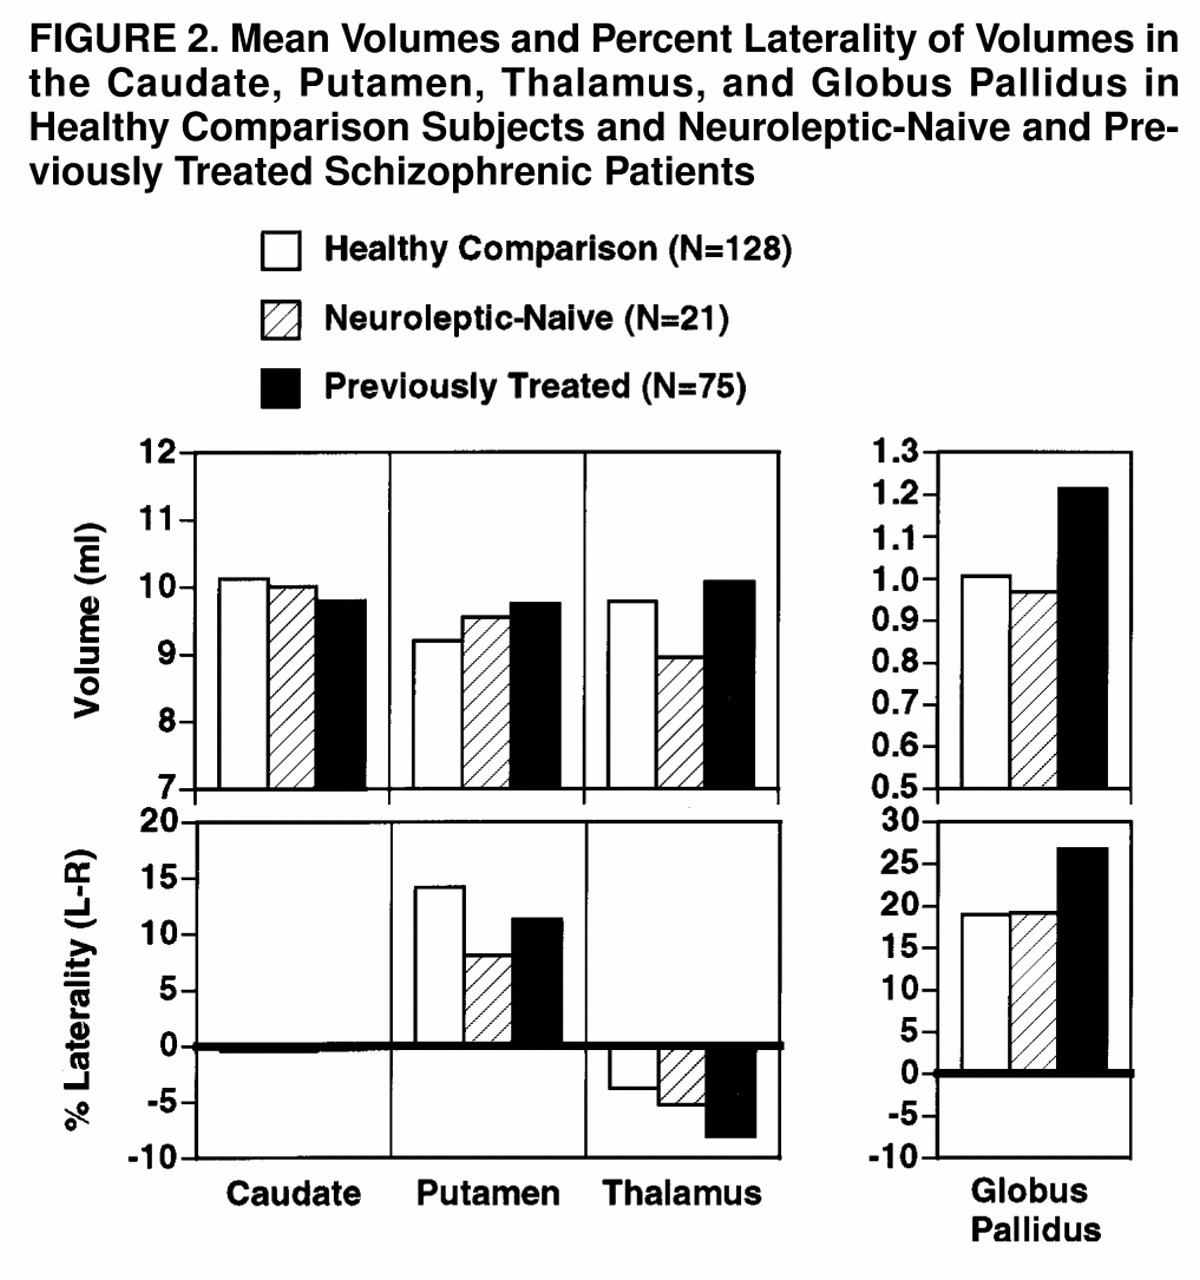
The MANCOVAs comparing patient subgroups (neuroleptic-naive and previously treated patients) with healthy comparison subjects on the four subcortical regions showed a main effect of group (Hotelling-Lawley trace T=0.17; F=2.26, df=16, 424, p=0.003), a main effect of region (T=0.17; F=12.15, df=3, 218, p<0.0001), and a group-by-region interaction (T=0.09; F=3.19, df=6, 434, p=0.004). There was a hemisphere-by-region interaction (T=0.04; F=2.83, df=3, 218, p=0.04) and a group-by-hemisphere-by-region interaction (T=0.06; F=2.11, df=6, 434, p=0.05). The follow-up MANCOVAs comparing the neuroleptic-naive patients with the healthy subjects on the significant interactions showed only a marginal group-by-region interaction (T=0.05; F=2.50, df=3, 144, p=0.06). The group-by-hemisphere-by-region interaction was not significant. On the other hand, the MANCOVA contrasting the previously treated patients with the healthy comparison subjects showed both a group-by-region interaction (T=0.07; F=4.52, df=3, 198, p=0.004) and a group-by-hemisphere-by-region interaction (T=0.06; F=4.00, df=3, 198, p=0.008). These effects are illustrated in
figure 2. As can be seen, the neuroleptic-naive group did not differ from the healthy comparison group except for a trend for lower thalamic volume (F=3.08, df=1, 148, p=0.08). On the other hand, the previously treated group showed higher volumes for the putamen (F=4.86, df=1, 202, p=0.03) and globus pallidus (F=12.58, df=1, 202, p=0.0005) (upper graphs of
figure 2). The interaction with hemisphere reflects the increased left hemispheric globus pallidus volume in treated patients (lower rightmost graph).
Correlations With Severity of Symptoms
The correlations of subcortical volumes with severity of global positive and negative symptoms were generally positive: higher volumes were associated with greater severity. For the neuroleptic-naive group, subcortical volumes were not correlated with severity of negative symptoms, but higher volumes of the thalamus and putamen were associated with more severe positive symptoms (r=0.50, df=19, p=0.02, and r=0.53, df=19, p=0.01, respectively). This association was evident for hallucinations (caudate r=0.44, df=19, p=0.04; putamen r=0.58, df=19, p<0.01; thalamus r=0.45, df=19, p=0.04) and bizarre behavior (putamen r=0.51, df=19, p=0.01). For previously treated patients, higher subcortical volumes were associated with greater severity of both negative and positive symptoms. These correlations were small but significant for negative symptoms with volumes of the caudate (r=0.29, df=73, p=0.01) and putamen (r=0.20, df=73, p=0.05) and for positive symptoms with the putamen (r=0.23, df=73, p=0.02) and globus pallidus (r=0.22, df=73, p=0.05). Examination of subcategories of symptoms did not point to more specific links. These correlations were not attenuated by removing medication dose, duration of treatment, current age, age at onset, or duration of illness in partial correlations.