Autism is a neurodevelopmental disorder that is characterized by social deficits, language difficulties, and repetitive, stereotyped behaviors. The phenotype is highly heterogeneous and exhibits a wide range of severity, and thus it may be best conceptualized as a spectrum condition rather than a discrete disorder. Classic autism, or narrowly defined autism, is part of a continuum of disorders collectively known as autism spectrum disorders or pervasive developmental disorders that include autism, Asperger’s syndrome, pervasive developmental disorder-not otherwise specified, Rett’s syndrome, and childhood degenerative disorder. Because of the phenotypic overlap with other disorders and high heterogeneity, diagnosis of autism spectrum disorders can vary greatly among clinicians.
A current estimate of autism prevalence in the general population is approximately 0.1%
(1,
2) . However, the prevalence in second-born siblings of affecteds is estimated to be approximately 5%, indicating that autism likely has significant genetic influences
(3 –
5) . More compelling evidence for a strong genetic component to autism comes from a number of twin studies
(6 –
8) . Considering that the prevalence of disease in second-born siblings of patients with Alzheimer’s disease and schizophrenia is about 0.45% and 0.8%, respectively
(9), autism spectrum disorders are likely among the most heritable of all medical conditions with complex genetic etiologies.
Despite the completion of eight genome-wide scans for autism
(5,
10 –16), most of the loci identified have not been replicated, with a few exceptions
(17) . These inconsistent linkage results are not surprising, considering the heterogeneous phenotype of autism and the notion that there are likely to be numerous genetic risk factors involved. We, as well as others, have been taking a multidisciplinary approach to understanding autism and other developmental disabilities by analyzing conditions based on their component endophenotypes
(18) . The utility of endophenotypes for identifying genetic loci is emphasized by recent work using language endophenotypes to locate a language-related quantitative trait locus on chromosome 7q35
(19,
20) .
The heritability of broad measures of intellectual function such as IQ, nonverbal communication, spoken language, as well as social adaptability is supported in the literature
(21,
22) . A recent study shows that of five autism traits analyzed, social motivation and range of interest/flexibility had the highest heritability, as well as the highest genetic correlation
(23) . However, several studies measuring social skills according to the social interaction domains of the Autism Diagnostic Interview-Revised indicate that these symptom domains show little if any familiality, thus indicating a need for a more reliable standard measure of heritable social interaction
(24,
25) . The Social Responsiveness Scale is a validated measure used to assess autism spectrum conditions that provides a comprehensive measure of a child’s social impairment, assessing social awareness, social information processing, capacity for reciprocal social communication, social anxiety/avoidance, and autistic preoccupations and traits
(26 –
28) . The Social Responsiveness Scale consists of a set of 65 questions that can be answered by either parents or teachers in approximately 20 minutes
(28) . As with autism, Social Responsiveness Scale scores are highly heritable
(26,
27) . The major advantage of the Social Responsiveness Scale is that it measures these highly heritable characteristics on a quantitative scale, rather than relying on the qualitative diagnosis of autism. To our knowledge, this is the first genome-wide linkage scan for social quantitative trait loci in families with autism, using Social Responsiveness Scale scores as the quantitative trait. In addition, this research represents the first genome scan of core social traits in any population.
Method
The present study involved a total of 121 families from the Autism Genetic Resource Exchange, which comprised a subset of the 345 families used in a previous whole genome scan based on the qualitative diagnosis of autism from the Autism Diagnostic Interview-Revised
(16) . We assessed 99 families with completed teacher-reported scores and 111 families with parent-reported Social Responsiveness Scale scores, from which 89 families overlapped with the teacher-reported cohort (see supplemental Figure 1 in the online version of the article). Written informed consent was obtained for all Autism Genetic Resource Exchange participants. Parents and all offspring (affected and “unaffected”) were genotyped for 408 multiallelic markers, most of which were selected from version 8.0 of the Marshfield genome screening set (Center for Medical Genetics website)
(29) . Markers had an average heterozygosity of 0.77 and an average density of 10 centimorgans (cM) with a few regions of denser coverage. Detailed genotyping procedures are described elsewhere
(16,
29) . We compiled genotype data for the 408 microsatellite markers used in the scans, as well as phenotype data from various sources publicly available at the Autism Genetic Resource Exchange website
(16,
17) . The PedCheck program was used to identify Mendelian errors, and family/marker combinations that were non-Mendelian were zeroed out
(30) . Family relationships were confirmed using the program RealCheck
(31) . Individuals with cases of nonidiopathic autism were omitted from the analysis, and one sibling from each monozygotic twin pair was randomly chosen for exclusion when a third sibling was available for analysis. Genehunter 2.1 was used to perform quantitative linkage analysis, using the nonparametric option for quantitative traits. Families were analyzed as nuclear sets, and final Z-scores were calculated at markers as well as at four points evenly spaced between markers using all pairs of siblings, unweighted
(32) . The unweighted option treats each sibling pair equally, and thus gives additional importance to sharing identified in the larger families with more than two sibling pairs (sibpairs included in the teacher-scored linkage scan can be viewed in the supplemental table in the online version of the article).
Results
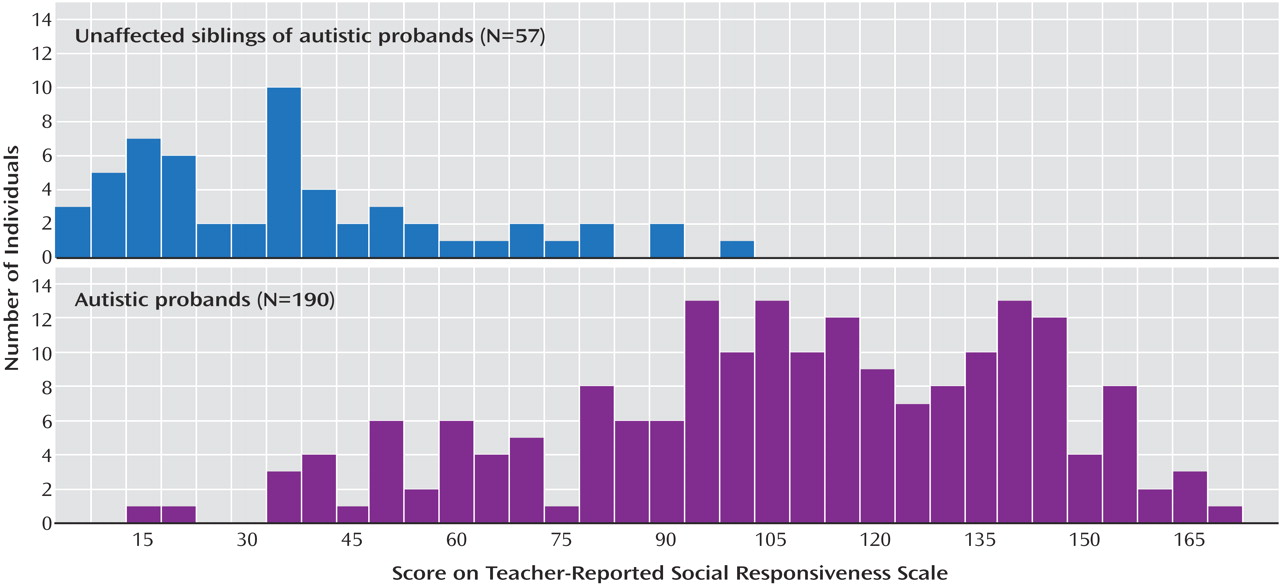
In this cohort, the distributions of Social Responsiveness Scale scores for autistic probands (N=190) and their unaffected siblings (N=57), as determined by the Autism Diagnostic Interview-Revised, were similar to those found previously
(26,
33) . The quantitative analysis used is not sensitive to non-normality. The autistic probands and unaffected siblings had slightly skewed distributions with means of 105 and 34, respectively (
Figure 1 )
(34) . Social Responsiveness Scale scores were significantly different between autistic individuals and unaffected siblings (Student’s t test, p<10
–30 ), which is consistent with the previous work showing that the Social Responsiveness Scale measures a core feature of autism. Nonetheless, the distributions of affected and unaffected sibs exhibit considerable overlap, which demonstrates the utility of the Social Responsiveness Scale as a quantitative endophenotype.
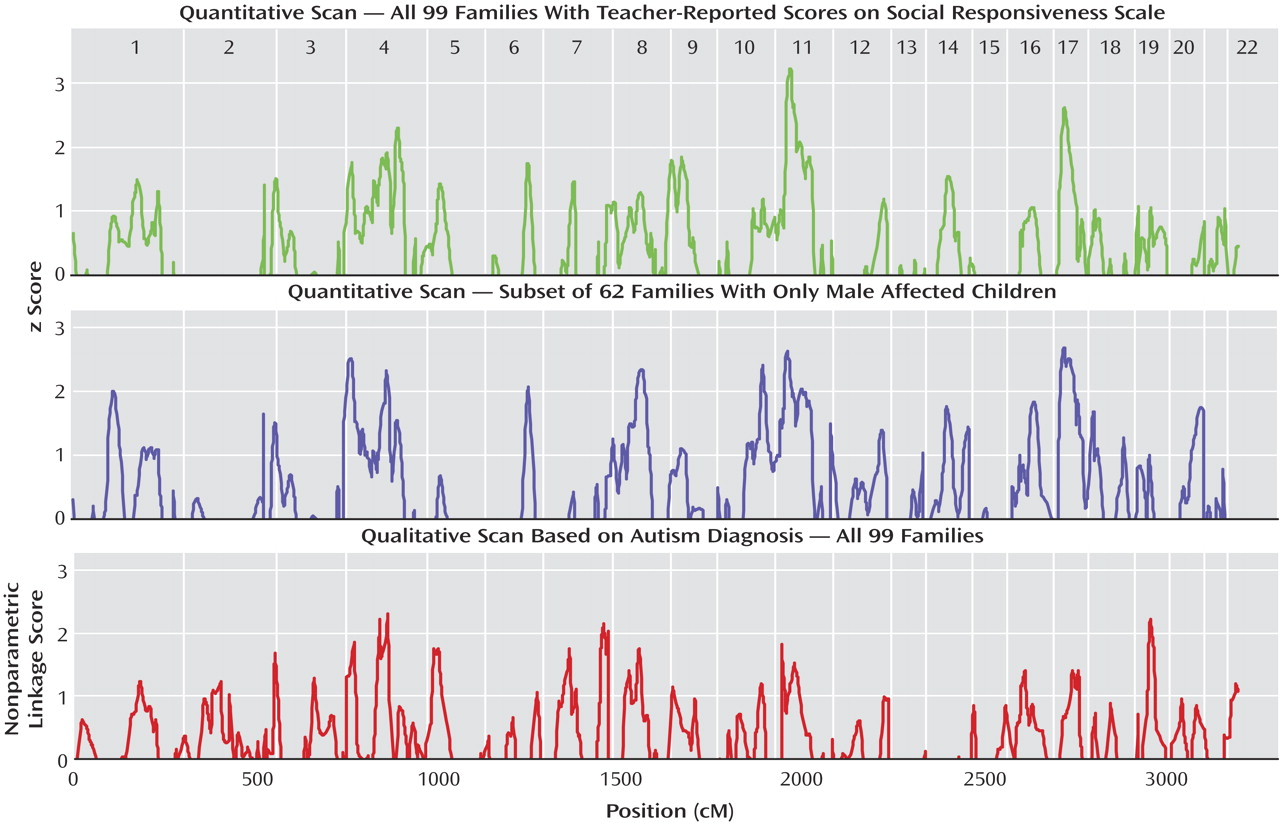
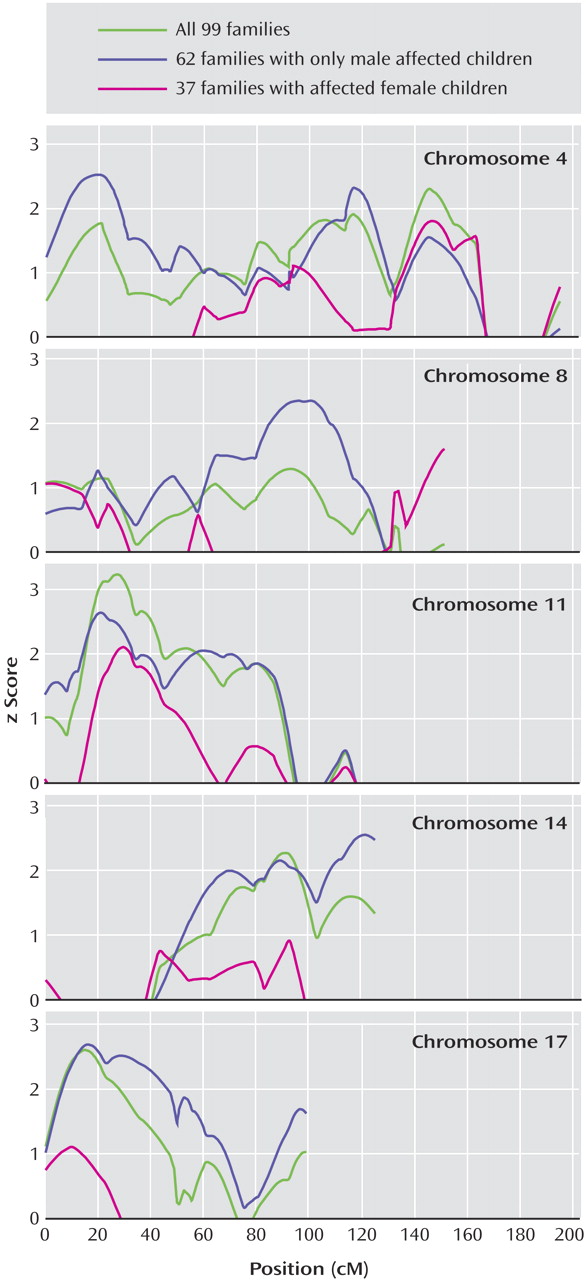
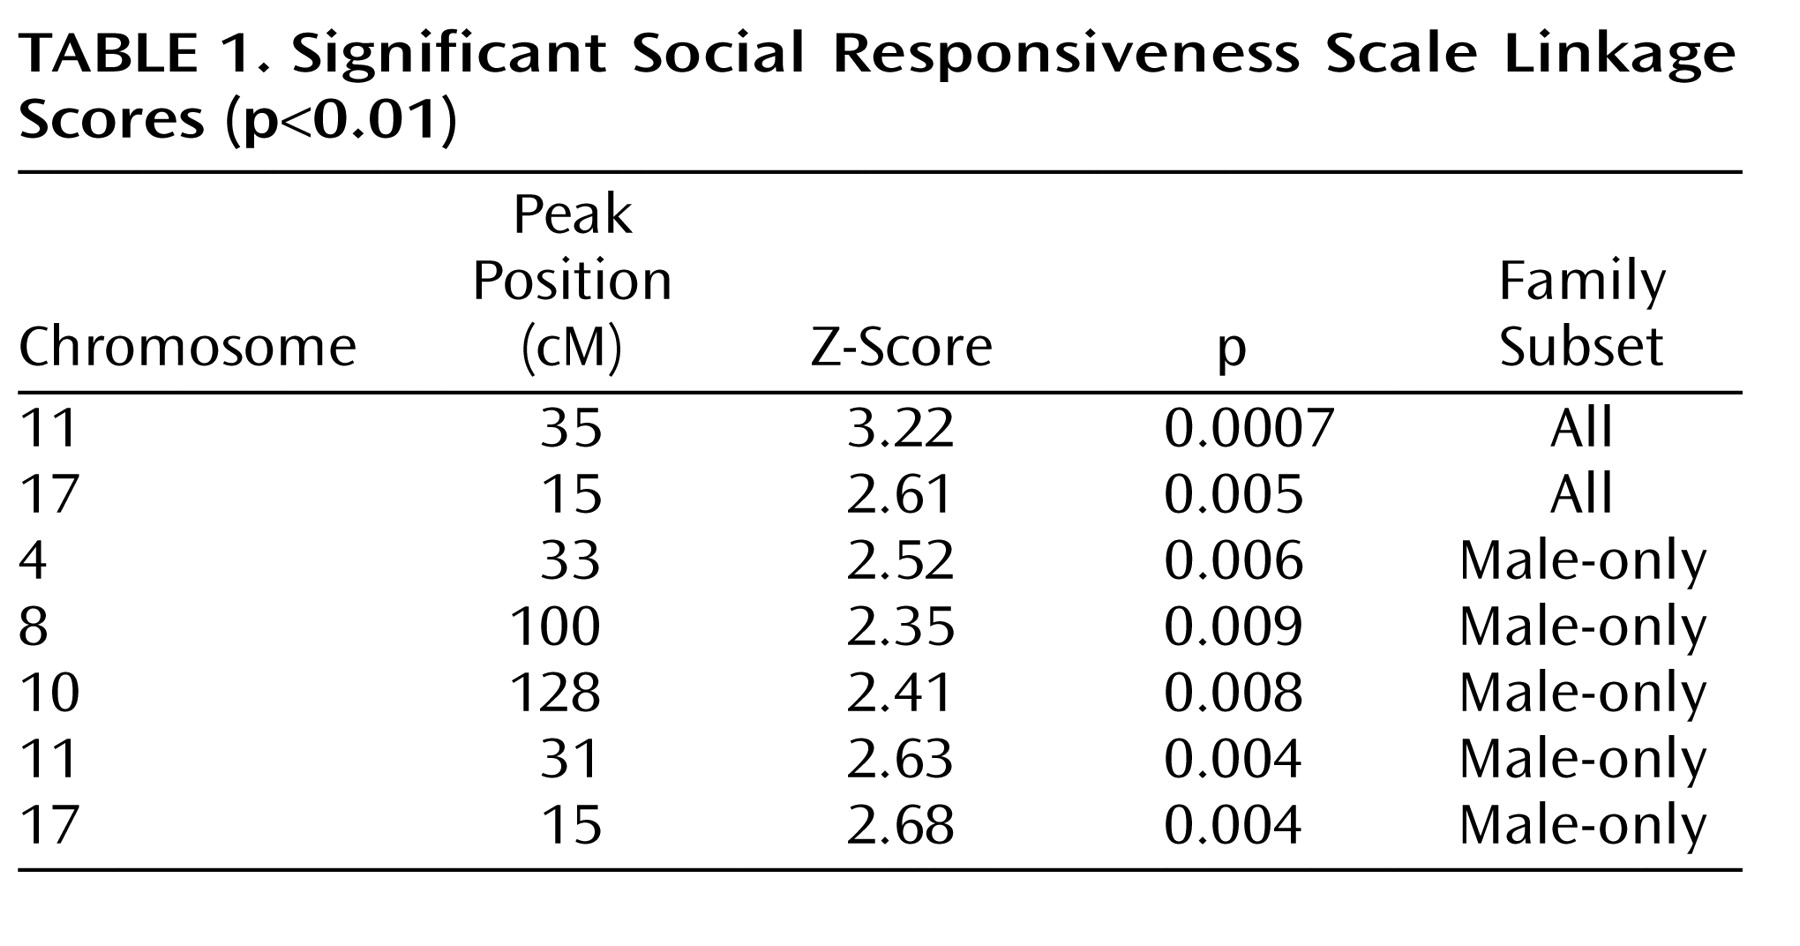
A total of 99 families, with 205 sibpair combinations involving 247 scored children, were included in the teacher-scored linkage scan (see supplemental table in the online version of the article). Two linkage signals reaching a nominal statistical threshold of p<0.01 were identified on chromosomes 11 and 17, using all teacher-scored families. The highest Z-score of 3.22 (p=0.0007) found on chromosome 11 reached a level of “suggestive linkage” as defined by Lander and Kruglyak
(35) (
Figure 2,
Figure 3,
Table 1 ). The chromosome 11 locus identified in this study overlaps with a similarly suggestive locus found in a previous genome scan based on categorical diagnoses of autism by the Autism Diagnostic Interview-Revised
(16) .
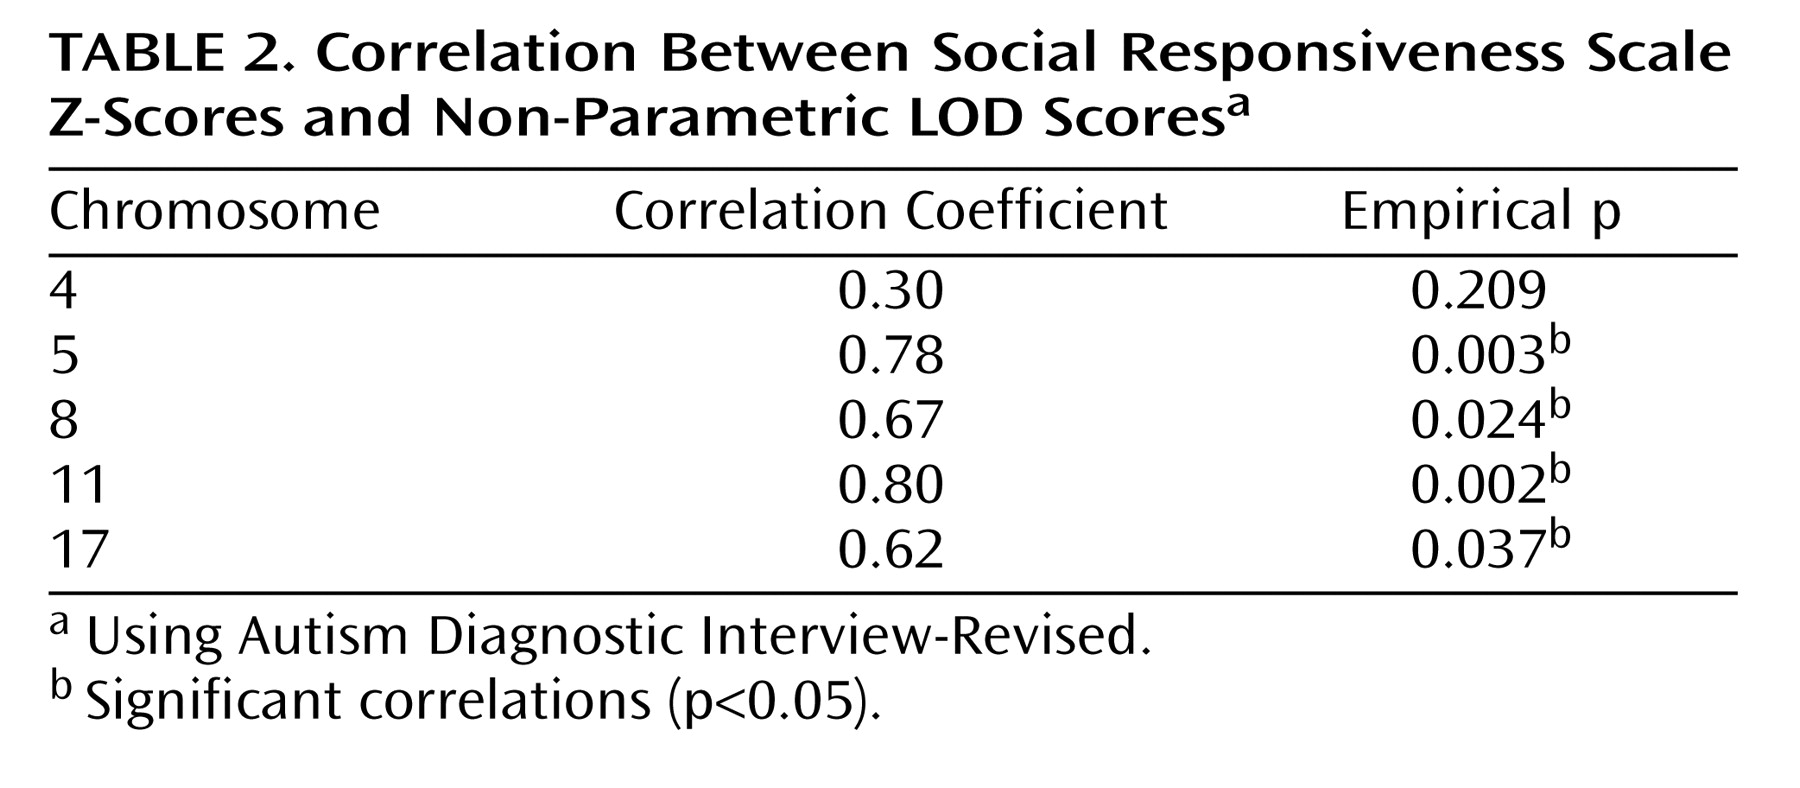
To more formally assess this overlap, we calculated the correlation between Autism Diagnostic Interview-Revised qualitative nonparametric logarithm of odds ratio (LOD) scores and the Social Responsiveness Scale quantitative trait locus Z-scores for five chromosomes with the most significant linkage signals (p<0.05) from the original qualitative scan and the current quantitative scan. We derived empirical p values of the Pearson correlation between nonparametric LOD scores and Z-scores along each chromosome by permuting the nonparametric LOD score, then randomly choosing 10,000 cohorts and computing the correlation with the Z-scores. Significant correlations between Social Responsiveness Scale and Autism Diagnostic Interview-Revised linkage signals (p<0.05) were identified for four of these five chromosomes (chromosomes 5, 8, 11, and 17) (
Table 2 ). These correlations indicate that the Social Responsiveness Scale is an effective surrogate for the diagnosis of autism in linkage analysis.
We also performed linkage analysis with the same 99 families included in the teacher-scored scan, using the qualitative diagnosis of autism to compare with the Social Responsiveness Scale results. Affection status was defined as in the study conducted by Yonan et al.
(16), based on standard diagnostic criteria and procedures
(16,
36) . Correlations between the Social Responsiveness Scale scores and the Autism Diagnostic Interview-Revised algorithm scores for each subdomain of autistic symptoms were ∼0.7
(28) . In contrast to the Social Responsiveness Scale quantitative trait locus analysis, in which two regions reached the p<0.01 threshold, no linkage signals reached a threshold of p<0.01 using the qualitative diagnosis of autism for the same cohort, supporting the notion that the Social Responsiveness Scale quantitative trait locus analysis may provide an opportunity to detect linkage signals from loci with a small effect as assessed by this scale.
Based on the assumption that genetic factors underlie the strong male bias in autism and other developmental disorders, we previously used a sex-splitting strategy that helped to remove heterogeneity and identify autism linkage on chromosome 17q
(17,
37) . We also reasoned that this strategy might be particularly relevant in the case of social behavior, given known sex differences in this behavioral dimension, with boys on average showing less social ability than girls. In order to enrich the Social Responsiveness Scale cohort for sex-related loci, we subdivided the cohort into groups of families with affected males only and groups of families containing affected females
(37) . There were 62 male-only families and 37 female-affected families from the total 99 teacher-scored families used (see supplemental
Figure 2 in the online version of the article). Two significant (p<0.01) male-only linkage signals, consistent with peaks identified in all cohorts, on chromosomes 11 and 17 were identified. Three new loci, on chromosomes 4, 8, and 10 were identified in the male-only subset (
Figure 2,
Figure 3,
Table 1 ). Since the cohort was small, these loci should be assessed in a large cohort. No linkage signals meeting a nominal threshold of p<0.01 were identified in the female-affected subset of families.
Since most families in this study had parent-reported Social Responsiveness Scale scores in addition to teacher-reported Social Responsiveness Scale scores, we analyzed both separately, rather than potentially losing any information by averaging or otherwise combining them. The correlation between parent- and teacher-produced Social Responsiveness Scale scores was 0.72 in this cohort, which supports previous studies
(28) . No significant loci at p<0.01 were detected in the analysis of the scores reported by the parents.
Discussion
In our analysis, we used a quantitative measure of autistic social impairment to identify chromosomal regions harboring potential genetic risk variants. A region on chromosome 11 was identified at the level of suggestive linkage, and another region on chromosome 17 reached a level of nominal significance
(35) . It is notable that our previous genome scan using the qualitative autism diagnosis involved more than three times the number of families, including the subset of 99 teacher-scored families used in the present study, yet the signal on chromosome 11 did not reach the same significance threshold as in the current study. Genome scans of quantitative traits similar to those described here are likely to provide greater power than scans of binary traits because the trait is measured over a continuum, which allows the assessment of more subtle phenotypic differences
(38) . Quantitative trait measures are especially useful for complex polygenic neuropsychiatric disorders, such as autism, that have a spectrum of endophenotypes
(18) . The clinical, qualitative phenotype of autism is determined by using an arbitrary cutoff for a collective range of scales to define affected versus unaffected individuals. Siblings that are just below this cutoff may, in fact, share several genetic risk factors but would be classified as unaffected, so some information is lost. For quantitative traits, all siblings provide useful information.
Because the Social Responsiveness Scale measures a dimension of autistic-like social impairment, which in itself is a core feature of autism spectrum disorders, it was also reassuring to observe overlap of linkage signals between the Social Responsiveness Scale results and loci identified in the original qualitative scan
(16) . Less significant Social Responsiveness Scale linkage peaks on chromosomes 5 and 8 also showed overlap with peaks identified using the qualitative diagnosis of autism
(16) .
More formal analysis of the Social Responsiveness Scale quantitative trait locus overlap with autism qualitative linkage peaks showed significant correlations of the point-wise test statistics in four of five regions. It is interesting to speculate that perhaps the lack of correlation between Social Responsiveness Scale and qualitative autism linkage on chromosome 4 suggests that this specific autism peak is not related strongly to phenotypic components of social behavior. The overlap between the Social Responsiveness Scale and Autism Diagnostic Interview-Revised linkage peaks is consistent with a body of published work showing that the Social Responsiveness Scale is a reliable quantitative measure of autistic-like social traits.
We previously identified multiple sex-specific loci for autism spectrum disorders and showed that stratification by sex increases homogeneity at some loci, and thus improves the power to detect related risk variants at those loci
(37,
17) . The male-only linkage signals on chromosomes 4, 8, 10, and 17 were larger than those observed with the entire cohort. This is encouraging, given the smaller cohort size, and replication in independent cohorts will allow us to interpret them as sex-specific loci. Autism linkage related to male sex has been previously identified on chromosome 17, although the Social Responsiveness Scale peak is at a distance of 35 cM to 50 cM
(17,
37) . No linkage signals meeting a nominal threshold of p<0.01 were identified with the female-affected subset of families, but one must consider that this is a very small cohort.
The difference in strength of the linkage signals between the teacher-reported and parent-reported scans also deserves comment. We suggest that this may be related to subtle systematic biases in parental reports of autistic symptoms among clinically affected families. Although rater bias and rater contrast effects on Social Responsiveness Scale scores were not detectable in a population-based twin cohort
(39), the possibility of modest rater contrast effects on the part of parents (but not teachers) was apparent in this clinical cohort: for boys presumed unaffected within their families, the mean parent-report Social Responsiveness Scale score was 62.7 (SD=41.9) by teacher-report compared with 37.2 (SD=33.2) by parent-report, despite the fact that the means for all boys in the Autism Genetic Resource Exchange cohort were nearly identical by parent- and teacher-report (97.6 [SD=41.9] and 97.8 [SD=39.0], respectively). Additionally, Constantino and Todd
(27) have shown that parents may share subsyndromal deficits in social cognition with their affected children, which could attenuate the accuracy of their report of social interactions. Linkage results from parent and teacher scans were highly correlated, but because teacher evaluations may generally (by no means always) be more accurate than that of a parent—especially with respect to subtly affected siblings in a clinical cohort—we chose to focus on the teacher-scored cohort. This allows us to highlight those analyses that incorporated the most precise information on the “unaffected” siblings, who are typically excluded from traditional affected sibpair linkage analyses, but whose inclusion represents the “value-added” of the quantitative approach to linkage that is the primary subject of this report.
Ultimately, the question of whether parent- or teacher-reported Social Responsiveness Scale scores more precisely capture heritable components of the autistic syndrome will be best answered when the genetic determinants of autism are identified. Since the heritability of measurements from “gold standard” autism diagnostic instruments (including the Autism Diagnostic Interview-Revised) has not yet been established, there is no available benchmark against which to compare quantitative Social Responsiveness Scale measurements (for which heritability has been established). Parent-reported Social Responsiveness Scale scores exhibit slightly higher correlations with Autism Diagnostic Interview-Revised scores than do teacher-reported Social Responsiveness Scale scores
(28), but this is predictable, since the informant for the Autism Diagnostic Interview-Revised is the parent and therefore does not necessarily imply a higher degree of precision for either parent- or teacher- Social Responsiveness Scale report, especially with respect to association with the underlying genetic structure of autism.
It is interesting to note that social responsiveness is highly heritable in the general population
(27,
39) . The Social Responsiveness Scale measures social behavior that is normally distributed in the general population and skewed in autism
(34) . This suggests that while the Social Responsiveness Scale is measuring a key component of autism, this component is also likely related to social relatedness in the general population, a notion supported by Social Responsiveness Scale scores in twins and their parents
(27) . Given that the Social Responsiveness Scale is continuously distributed in nonautistic populations and can be transformed to a normal distribution, it also will be interesting to use the Social Responsiveness Scale as a basis for quantitative trait locus scans in broader populations to test whether this core feature of autism is truly the end of a normal distribution
(39) or because of risk factors beyond those determining social behavior in nonautistic populations.
This is the first genome scan of any trait related to social behavior in autism. The failure to replicate linkage or to significantly increase signals to genome-wide significance, even in the largest autism spectrum disorders genome scans to date, is typical for a complex genetic trait
(16) . This is likely because of many factors, including genetic heterogeneity and phenotypic complexity. This suggests that, while highly heritable, the observed phenotype of autism may not be specific enough to the underlying genetic risk, which is multifactorial and heterogeneous. We, as well as others, have had preliminary success decreasing heterogeneity by utilizing endophenotypes related to autism
(15,
19,
20,
40), and the Social Responsiveness Scale shows promise for genetic studies as a useful social endophenotype. Our findings in the present study clearly warrant research for replication in other independent cohorts and fine mapping to further delineate the loci. Furthermore, it will be useful to apply this measure in larger multigenerational pedigrees to take advantage of the full power of this quantitative trait
(38) . The availability and ease of measurement using the Social Responsiveness Scale make replication feasible and efficient for other autism cohorts.
