DSM-IV Axis I Diagnosis on SCID Interview
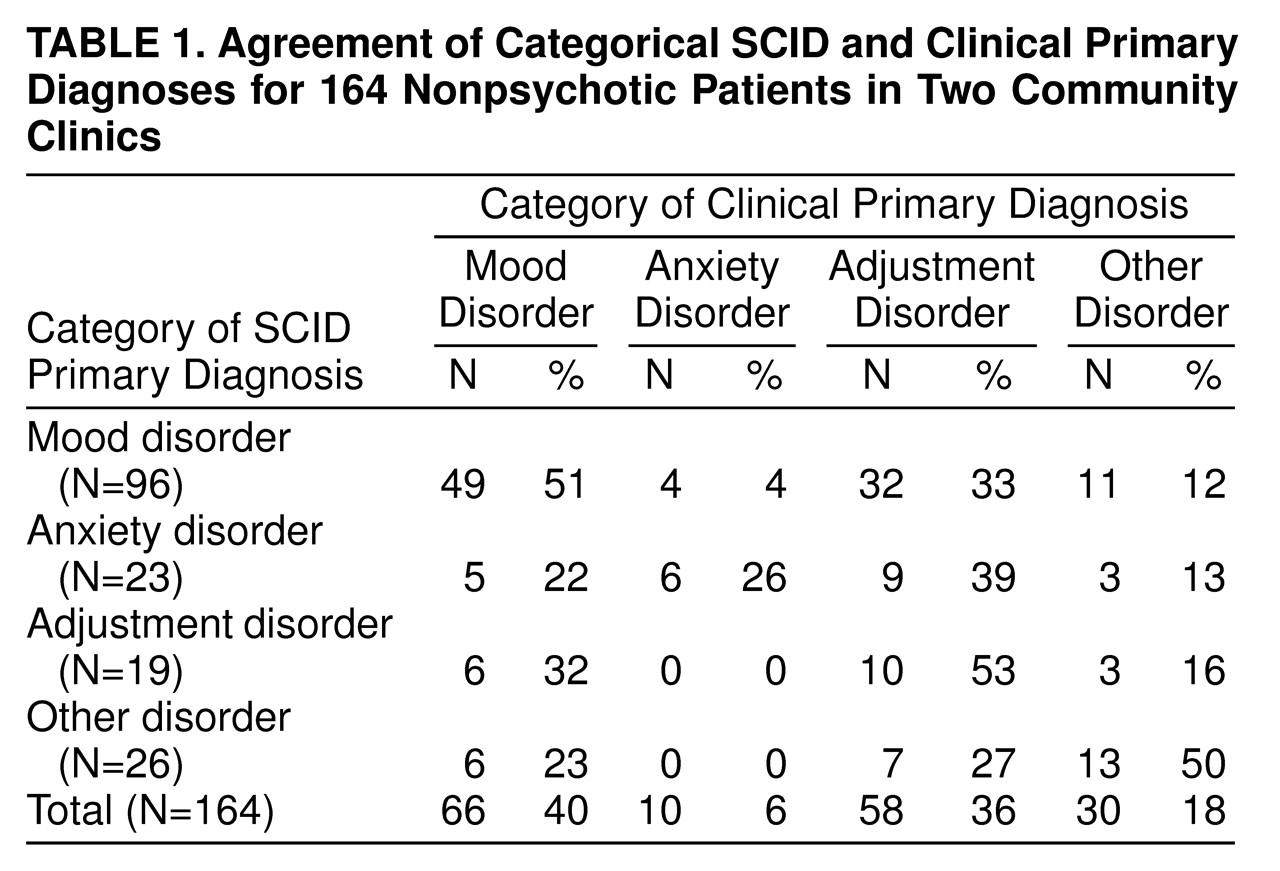
It is somewhat surprising that there was little difference in the diagnostic profiles of patients from the urban academic clinic and patients from the rural clinic; data from the two groups are combined for most analyses. For the structured interview, 145 of 164 (88%) of the patients met the full SCID criteria for at least one current axis I disorder. Among the 19 who did not, 12 had a past DSM-IV diagnosis that did not meet all of the criteria for a current diagnosis at the time of the interview, but they were considered by the interviewer to have symptoms sufficiently severe to warrant treatment. The frequencies of primary diagnoses—grouped by mood disorder, anxiety disorder, adjustment disorder, and all other disorders—are presented in
table 1.
The majority (N=96 of 164, 59%) of the patients met the SCID criteria for a primary depressive disorder. Depression was four times as common as any anxiety disorder (N=23 of 164, 14%) as a primary diagnosis; all other primary diagnoses were far less common. Somewhat more women than men (N=69 of 111, 62%; N=26 of 53, 49%, respectively) were diagnosed with a primary depressive disorder (χ2=2.90, df=1, p=0.09).
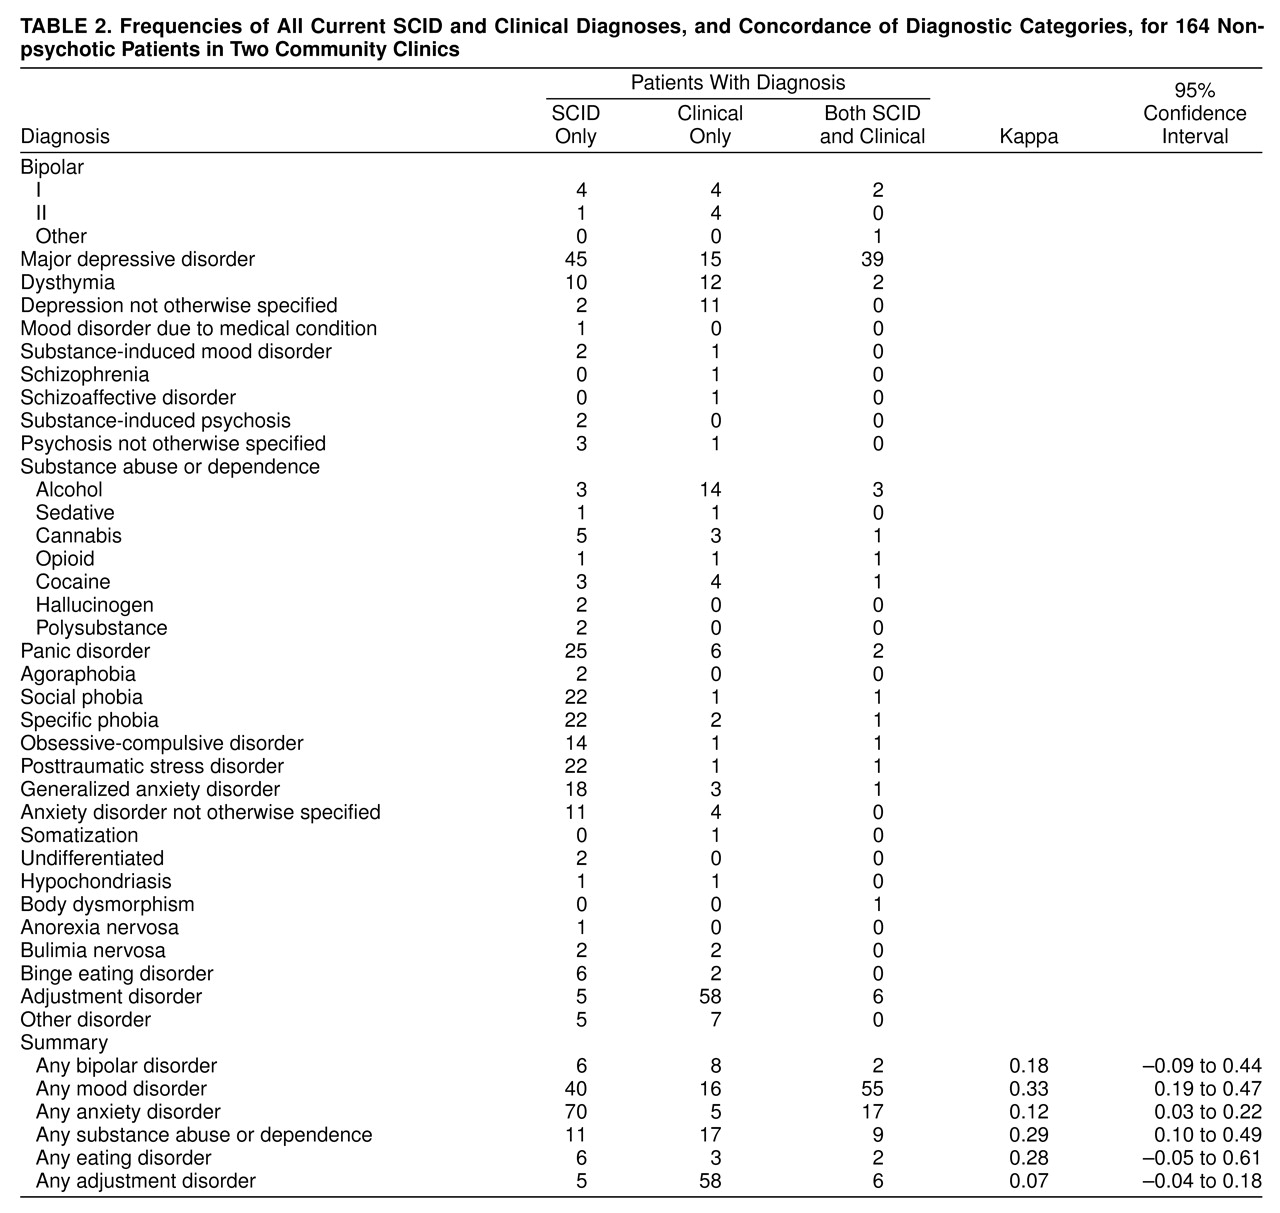
table 1 shows the frequency of all current axis I diagnoses. Examined in this way, depression is still the most common condition, but anxiety disorders are almost as frequent. Thus, comorbid anxiety is common. Considering all current diagnoses, 53% (N=87) of the patients met the criteria for two or more current axis I diagnoses, and 29% (N=48) met the criteria for three or more. One hundred twenty-eight (78%) of the patients were diagnosed with depression and/or anxiety, of whom 32% (N=41) met the SCID criteria for depression without anxiety, 25% (N=32) for anxiety without depression, and 43% (N=55) for both anxiety and depression. Women were almost twice as likely as men (N=82, 50%; N=44, 27%, respectively) to meet the criteria for comorbid anxiety and depression (χ
2=5.91, df=2, p=0.05).
Although we did not formally evaluate axis II disorders, patients completed an abbreviated form of the Inventory of Interpersonal Problems
(21). A mean score of 1.1 or higher on this instrument has been reported to indicate probable personality disorder
(22–
24). Seventy-seven percent (N=126) of all subjects and 91% (N=79 of 87) of those with two or more axis I disorders scored in this range. Subjects with scores on the Inventory of Interpersonal Problems of 1.1 or higher were more likely to have two or more concurrent axis I diagnoses than were those with lower scores (N=105, 64%; N=43, 26%, respectively) (χ
2=17.07, df=3, p=0.001).
Concordance Between Clinical and SCID Diagnoses
Chart diagnosis often did not concur with results on the SCID. The kappa was 0.24 for interrater reliability of primary diagnosis (categorized as depressive disorder, anxiety disorder, adjustment disorder, or other disorder).
Among those with a primary diagnosis of an anxiety disorder per the SCID, 26% (N=6 of 23) of chart diagnoses also identified an anxiety disorder. Concordance was better for a primary SCID diagnosis of depression, for which 51% (N=49 of 96) of the clinical records also identified depression; however, there were also more false positive diagnoses of depression. Among the 49% (N=47 of 96) of the patients for which depression was not recorded on the chart, 68% (N=32) were assigned “adjustment disorder,” “V code,” or “no clinical diagnosis.” The remainder received diagnoses of anxiety disorder, substance abuse, or bipolar disorder. The SCID diagnoses for the 16 cases of unconfirmed clinical depression included adjustment disorder (N=5), anxiety disorder (N=5), substance abuse (N=3), and other disorder (N=3).
table 2 also summarizes the similarities and differences between current diagnoses when made by means of the SCID rater or a clinical rater. The first column of
table 2 shows the 36 diagnoses given to any patient by the SCID rater or by clinical diagnosis. The second column shows the number of times each diagnosis was given by the SCID rater only, the third column shows the number of times each diagnosis was given by a clinical rater only, and the fourth column shows the number of times the raters agreed. Several features of
table 2 are of note. Raters agreed in a pronounced minority of cases. Overall, use of the SCID resulted in more diagnoses than did standard clinical procedures. Anxiety disorders, in particular, were much more likely to be diagnosed by the SCID rater than by a clinical rater. The one notable exception was “adjustment disorder,” which was diagnosed much more frequently by a clinical rater than by the SCID rater.
When the 36 diagnoses were considered separately, kappas could not be computed consistently because of the many empty cells. The diagnoses were collapsed into groups for the calculation of kappas. When the diagnoses were collapsed, the SCID rater and clinical raters were considered to agree if, for example, the clinical rater diagnosed major depression and the SCID rater diagnosed dysthymia. Correspondingly, the number of agreements is larger in the summary section of
table 2. Nonetheless, kappas are still very low, and in half of the cases, the confidence intervals for the kappas include zero.
Neither demographic variables (sex, age, race, marital status, income, and education) nor severity of illness were associated with diagnostic agreement. Indices of environmental stress (low social support, partner abuse, and exposure to violence) did not predict assignment to the adjustment disorder category. However, agreement on a primary diagnosis (mean axis I diagnoses for a match=1.6, SD=0.8; mean axis I diagnoses for no match=2.0, SD=1.5) was associated with significantly fewer axis I diagnoses (t=2.04, df=148.4, p=0.04), suggesting that a more complex pattern of symptoms was associated with more disagreement on a DSM diagnosis.
In the rural clinic, separate diagnoses were provided by physicians for a subset of the patients. The 61 patients who had a physician diagnosis recorded within the review period had significantly more treatment visits than did the 53 with no physician diagnosis (mean=4.0, SD=2.8; mean=2.4, SD=3.4, respectively) (t=–2.77, df=110.0, p=0.007). In addition, the patients who received physician assessments were more likely than those without physician assessments to meet the SCID criteria for depression (N=43 of 61 participants, 70%; N=23 of 53 nonparticipants, 43%) (χ2=9.14, df=2, p=0.01), to meet the criteria for more current SCID diagnoses (mean=2.1, SD=1.2; mean=1.6, SD=1.7) (t=–2.07, df=112, p=0.04), and to achieve higher scores on the SCID self-report measures of impairment. Agreement between the SCID and physician diagnoses was no better than that between the clinician and SCID diagnoses. The kappa for interrater reliability, calculated as agreement between the physician and SCID rater on the primary diagnosis, as previously, was 0.15. The kappa for agreement between physician and clinician diagnoses was similarly low.
Clinicians frequently used a designation of “rule out.” Specifically, 49% of the clinicians’ depression diagnoses from patient charts were designated “rule out,” as well as more than 50% of the recorded anxiety disorders diagnoses. The kappa was not improved by allowing for a match of any SCID diagnosis with any clinical diagnosis, including rule outs.
Interpersonal Functioning and Indices of Illness Severity and Impairment
Questionnaire results indicated that social support was low (all subscale means≤20, SDs≤7), and there was evidence of partner abuse in a significant subgroup (mean score on Partner Abuse Scale, verbal: mean=16.4, SD=22.5; physical: mean=3.4, SD=10.2).
Unprotected t tests were used to compare patients who met the SCID criteria for a primary diagnosis of a depressive disorder with those who did not. The alpha levels of the t tests were significant for scores on the Medical Outcomes Study Short-Form Health Survey (general health and mental health), the Inventory of Interpersonal Problems, the Sheehan Disability Scale, and the Interpersonal Support Evaluation List. Patients with depression reported more impairment (lower scores) than patients without depression on the general health (mean=54, SD=23; mean=65, SD=25, respectively) (t=2.86, df=159, p=0.009) and mental health (mean=31, SD=19; mean=54, SD=21) (t=8.81, df=159, p=0.001) summary scores of the Medical Outcomes Study health survey and more impairment (higher scores) on the Sheehan Disability Scale (mean=22.9, SD=8.9; mean=17.5, SD=11.3) (t=–2.85, df=115, p=0.006). Similarly, those with depressive disorders had lower social support than those without depressive disorders, as indexed by the Interpersonal Support Evaluation List (e.g., total mean=66.2, SD=23.3; total mean=81.0, SD=20.2, respectively) (t=3.96, df=121, p=0.001). Interpersonal problems did not differentiate depressed from nondepressed individuals.
In women (N=89), but not in men (N=47), scores for verbal and physical abuse were correlated with the ratings for illness burden and impairment. Physical abuse correlates included the number of current diagnoses (r=0.34, p<0.01; r=0.18, n.s., respectively), the Medical Outcomes Study Short-Form Health Survey’s pain index (r=–0.27, p<0.02; r=0.16, n.s.), and the Sheehan Disability Scale (r=0.30, p<0.01; r=0.06, n.s.); verbal abuse correlates included the Medical Outcomes Study health survey’s pain index (r=–0.30, p<0.01; r=0.22, n.s.), social functioning (Medical Outcomes Study’s Short-Form Health Survey) (r=–0.37, p<0.01; r=–0.17, n.s.), the Sheehan Disability Scale (r=0.42, p<0.01; r=0.08, n.s.), and social support (Interpersonal Support Evaluation List) (r=0.32, p<0.01; r=0.16, n.s.).