Full access
Article
Published Online: 1 February 2001

Sex Differences in the Effects of Alcohol on Brain Structure

Publication: American Journal of Psychiatry

Abstract

OBJECTIVE: This study investigated whether alcoholic women manifest deficits in cortical gray and white matter volumes and ventricular enlargement similar to those seen in alcoholic men. METHOD: Volumetric measures of intracranium, cortical gray matter, white matter and sulci, and lateral and third ventricles were obtained from magnetic resonance images of 42 women and 44 men with DSM-III-R alcoholism and age-matched healthy comparison groups (37 women and 48 men). Groups of alcoholic men and women were matched on age and length of sobriety, but men had a 2.5 times higher lifetime alcohol consumption than women. RESULTS: Women, regardless of diagnosis, had less cortical gray and white matter and smaller third ventricles than men, consistent with sex-related differences in intracranial volume. Alcoholics had larger volumes of cortical sulci and lateral and third ventricles than comparison subjects. Diagnosis-by-sex interactions for cortical white matter and sulcal volumes were due to abnormalities in alcoholic men but not alcoholic women, relative to same-sex comparison subjects. This interaction persisted for cortical sulci after covarying for lifetime alcohol consumption. Slopes relating cortical gray matter and sulcal volumes to age were steeper in alcoholic than in comparison men. Slopes relating lateral ventricle volume to age were steeper in alcoholic than in comparison women. In alcoholic women, longer sobriety was associated with larger white matter volumes. CONCLUSIONS: Alcoholic men and women show different brain morphological deficits, relative to same-sex comparison subjects. However, age and alcoholism interact in both sexes, which puts all older alcoholics at particular risk for the negative sequelae of alcoholism.
Epidemiological studies show that compared to men, women in general start to drink later in life, consume less per occasion, are more likely to be abstinent (1), and have lower rates of alcoholism (2). Although alcoholism may be less likely to affect women than men, some (3) but not all (4) studies suggest that women are more vulnerable than men to the adverse medical consequences of heavy alcohol consumption. Thus, although alcoholism may be less likely to affect women than men, for those afflicted, the consequences pose severe health problems.
Magnetic resonance imaging (MRI) studies of brain morphology in men with chronic alcoholism show that they have significant deficits in cortical gray and white matter volumes and sulcal and ventricular volume enlargement, relative to those of healthy comparison subjects (5, 6). These abnormalities are greater in older than younger alcoholic men, even after controlling for disease duration and amount consumed, and become prominent around the fourth decade of life (5, 7, 8). In addition, gray and white matter volumes of the frontal lobes are particularly vulnerable to the combined effects of age and alcoholism in men (8). Longitudinal studies provide some evidence for both short-term (9) and longer-term (10, 11) recovery with abstinence as well as further deterioration with continued drinking.
Relatively few in vivo neuroimaging studies have been conducted in alcoholic women, and none report specific changes in different tissue types in the cortical mantle. An early study using computerized tomography (CT) (12) compared men and women with alcoholism and healthy male and female comparison subjects and found effects of alcohol and sex on the ventricle/brain ratio (when age was covaried) but no alcohol-by-sex interaction. Because the alcoholic women had less severe drinking histories than the men, this finding was seen as evidence for greater vulnerability of women than men to the effects of alcohol. This finding was echoed in a subsequent CT report (13). In both studies, men with alcoholism were estimated to have consumed 2.5–3 times more alcohol over their lifetimes than women. An MRI report (14) found only one of 10 alcoholic women had abnormally enlarged ventricular volumes, and this subject had consumed 10 times as much as the next highest drinker.
Two more recent studies examined the corpus callosum (15) and the hippocampus (16). The samples of men and women with alcohol dependence in the study of the corpus callosum (15) did not differ significantly in estimated lifetime alcohol consumption, but women consumed about half as much as men in the hippocampal study (16). Alcoholic women had a smaller corpus callosal area, relative to healthy comparison women, whereas alcoholic men did not, relative to healthy comparison men—a finding that persisted with statistical adjustments for sex differences in head size. The lack of volume reduction in men differs from the results of a separate study of the corpus callosum (17), which reported callosal area deficits in alcoholic men. However, men in this study, on average, were older and consumed more than men in the sex comparison study (15). Both men and women with alcoholism had equivalently smaller right hippocampal volumes than healthy comparison subjects (16). The authors’ conclusion in both studies (15, 16) was that women are more vulnerable than men to the effects of alcohol.
Naturally occurring sex differences in levels of alcohol consumption, along with sex differences in body morphology and alcohol metabolism, pose significant challenges to the investigation of sex differences in the chronic effects of alcohol on regional brain volumes. In this study we compared MRI measures of brain morphology in a group of women who met DSM-III-R criteria for alcohol dependence, tested after 2–15 months of sobriety, with those from age-matched groups of low-alcohol consuming female comparison subjects, alcoholic men, and low-alcohol consuming male comparison subjects. The alcoholic men were selected to match the age and length of sobriety of the alcoholic women from a larger group of men recruited previously (5, 9) and were estimated to have consumed 2.5 times as much alcohol over their lifetimes as the women. To control for quantity of alcohol consumed, a supplementary analysis was performed on a subset of the alcoholic men and women with comparable lifetime levels of alcohol consumption.

Method

Study Participants

All subjects gave written informed consent after the nature of the study and procedures were fully explained to them. Women with alcoholism (N=42) were recruited from inpatient and outpatient programs at the VA Palo Alto Health Care System, outpatient programs at Stanford Medical Center, and a number of community treatment and self-help programs involving both residential and day care. Treatment staff at the various facilities were provided with a list of eligibility criteria and called at regular intervals to determine if any current patients met the study criteria. The study was also advertised through Alcoholics Anonymous. Potential subjects were initially screened by examination of treatment records, if available, followed by a phone interview of those without obvious disqualifications. Those who met the criteria came in for detailed clinical assessment that included a medical history, physical examination, ECG, clinical blood tests (CBC and SMA-20), a structured psychiatric interview (Structured Clinical Interview for DSM-III-R [SCID]), and a structured assessment of lifetime alcohol consumption (18) and recent drug use. Subjects were excluded if they had ever met DSM-III-R criteria for schizophrenia or bipolar disorder, had a history of medical or neurological illness or trauma, had suffered a head injury involving loss of consciousness for more than 30 minutes, or were currently taking medications that would affect the central nervous system (CNS). Subjects were tested on an outpatient basis after periods of sobriety ranging from 2 to 15 months. A menstrual history, available for 39 of the participants, showed that 30 of the women were premenopausal; six of those who were postmenopausal were taking hormonal supplements. A subset of this group (N=28) with the heaviest lifetime drinking histories was selected for a supplementary analysis in which alcoholic men and women were matched at a group level for lifetime consumption of alcohol.
A group of alcoholic men (N=44) was selected, without regard to brain imaging data, from a group of previously studied alcoholic men (5, 9) to match, as a group, the mean age and age range of the alcoholic women. These patients were initially recruited at admission to a 30-day inpatient substance abuse treatment program at the VA Palo Alto Health Care System and retested after discharge up to 1 year later. Study criteria and screening procedures at entry were similar to those employed with the women, with the exception of more stringent screening for psychiatric comorbidity (any diagnosis of schizophrenia, bipolar disorder, affective disorders, anxiety disorders, posttraumatic stress disorder, or substance dependence or recent abuse). The scan obtained after the longest period of sobriety was selected for each man in order to match the length of prior sobriety in the women. A subgroup of these men (N=23) with the lightest lifetime drinking histories was selected for supplementary analysis in which groups of alcoholic men and women were matched for lifetime alcohol consumption.
Healthy comparison women (N=37) and men (N=48) were selected, without regard to brain imaging data and on the basis of age, from larger groups of women, age 20–85 years, and men, age 21–70 years, who had been recruited from the community to participate in a study of normal aging (19), as well as to serve as a healthy comparison group for other patient populations studied (e.g., references 20, 21). Subjects were screened for entry into the healthy comparison groups by using the SCID, a medical history, a physical examination, blood tests (CBC and SMA-20), and a structured interview assessing lifetime alcohol consumption (18). Subjects were excluded if they had a history of medical or neurological illness or trauma that would affect the CNS, had ever met DSM-III-R criteria for a major psychiatric disorder including substance dependence, had substance abuse in the past year, or had reported a period exceeding 1 month during which they had consumed more than three (two for women) standard drinks per day.

Assessment of Lifetime Alcohol Consumption

Lifetime alcohol consumption was quantified in alcoholic patients and healthy comparison subjects by using a semistructured interview (18, 22). The interviewer started from the age at which the subject first consumed alcohol on a regular basis (at least one drink per month) and elicited the quantity (how many drinks per day) and frequency of drinking (how many drinks on average per month) over a series of drinking stages that differentiated between both normal and maximum quantities and their frequencies. Types of alcoholic beverage (wine, beer, or spirit) were converted into drink equivalents, and each was given a value of 13.6 g of absolute alcohol.

Image Acquisition

MRIs were acquired on a 1.5-T General Electric Signa scanner (Milwaukee) and analyzed as previously described for the men (5). Scanning parameters were as follows: axial spin echo; thickness=5 mm; skip=2.5 mm; field of view=24 cm; 256 × 256 matrix; TE=20, 80 msec; cardiac cycle gated effective TR >2400 msec; 256 phase encodes; and at the oblique plane perpendicular to the sagittal plane and crossing through the anterior and posterior commissures (anterior commissure-posterior commissure line). The subjects also underwent a coronal acquisition protocol. The slice passing through the temporal lobes at the anterior commissure in a plane oriented perpendicularly to the anterior commissure-posterior commissure line from this sequence was used for head height measurement, which was integral to the estimation of the intracranial volume and consists of brain tissue, CSF space, and blood-filled sinuses. Head size was estimated by modeling the intracranial volume as a sphere, using head height as the diameter of the sphere and the area of the index section (defined just ahead) from the axial sequence as the area of a plane passing through the center of the sphere (23).

Image Analysis

All images were stored on magnetic tape, transferred to optical disks for analysis, and coded to allow processing to be performed blind to subject identity, age, diagnosis, and neuroradiologist’s report. For each data set, the most inferior section above the level of the orbits, where the anterior horns of the lateral ventricles can be seen bilaterally, was identified as an index section. Seven consecutive sections, beginning at the index section and proceeding superiorly, were analyzed for each subject. The index section or the section below it was used for quantification of the third ventricle. Each slice was segmented into CSF, gray matter, and white matter compartments by using a semiautomated image analysis technique (24).
Two approaches to regional measurement were used. The first was based on a geometric separation between cortical (outer 45%) and subcortical (inner 55%) regions and between six cortical regions of interest (prefrontal, frontal, anterior superior temporal, posterior superior temporal, anterior parietal, and posterior parietal-occipital, each representing a rough approximation of the lobes for which they are named). These geometric measures have been used to describe the overall characteristics of the male alcoholics (5), investigate frontal lobe deficits (8), and compare the regional pattern of gray matter deficits between men with alcoholism and men with schizophrenia (25). The geometric approach is adequate for defining the cortical gray matter rim but does not fully characterize the cortical white matter volume, particularly the centrum semiovale, which extends medially beyond these geometric boundaries (outer 45%). Thus, for this report we used a manually delineated measure (9) of cortical white matter: the sum of all white matter pixels that fall outside the subcortical region defined by the borders of the lateral ventricles and subcortical gray matter structures (basal ganglia and related structures of the internal capsule). Pixel counts for gray matter, white matter, and CSF in the various regions of interest were transformed into cubic centimeters to provide estimates of their absolute volume.

Statistical Analysis

Separate two-factor (sex and diagnosis) analyses of variance (ANOVAs) were applied to each regional brain volume. We predicted main effects for sex (on the basis of established differences in head size between men and women) and diagnosis (on the basis of past observations of tissue loss and CSF space enlargement with chronic alcoholism). Where interactions were observed, we performed follow-up t tests to explore group differences between healthy comparison subjects and alcoholics of the same sex and between men and women of the same diagnostic group.
Given the higher alcohol consumption among men than women in these groups, a sex-by-diagnosis interaction in an ANOVA, indicating worse effects in men than women, could support a dose response but equivalent sex vulnerability to chronic alcohol use. Alternatively, diagnostic differences without a significant interaction would imply greater vulnerability in women than men, given the higher alcohol consumption in men. However, after accounting for higher rates of alcohol consumption in men than in women, an interaction would be expected if men show worse effects than women.
We used two approaches to account for the higher rates of alcohol consumption in men than women: 1) we considered lifetime alcohol consumption as a covariate (using analysis of covariance [ANCOVA]), and 2) we repeated the ANOVA in restricted groups in which men and women with alcoholism were matched on lifetime alcohol consumption. On the basis of earlier reports, we predicted a lack of interaction in the ANOVA and an interaction showing worse effects in women than men with alcoholism once the effects of different alcohol consumption had been controlled—either statistically, by ANCOVA, or by excluding high-alcohol consuming men and low-alcohol consuming women.
To determine whether women and men with alcoholism each show similar age effects on regional brain volumes, we compared linear regressions between regional brain volumes and age between alcoholic and healthy comparison men in one set of analyses and between alcoholic women and healthy comparison women in another set of analyses. In addition, for each alcoholic sex group, multiple regressions were performed with age and length of sobriety or age and lifetime alcohol consumption to determine the independent contributions of these alcohol variables after control for the contribution of age. To determine whether women showed a regional difference in brain volume deficits, repeated measures ANOVAs were performed across six regional gray matter volumes.

Results

Demographic and Clinical Characteristics

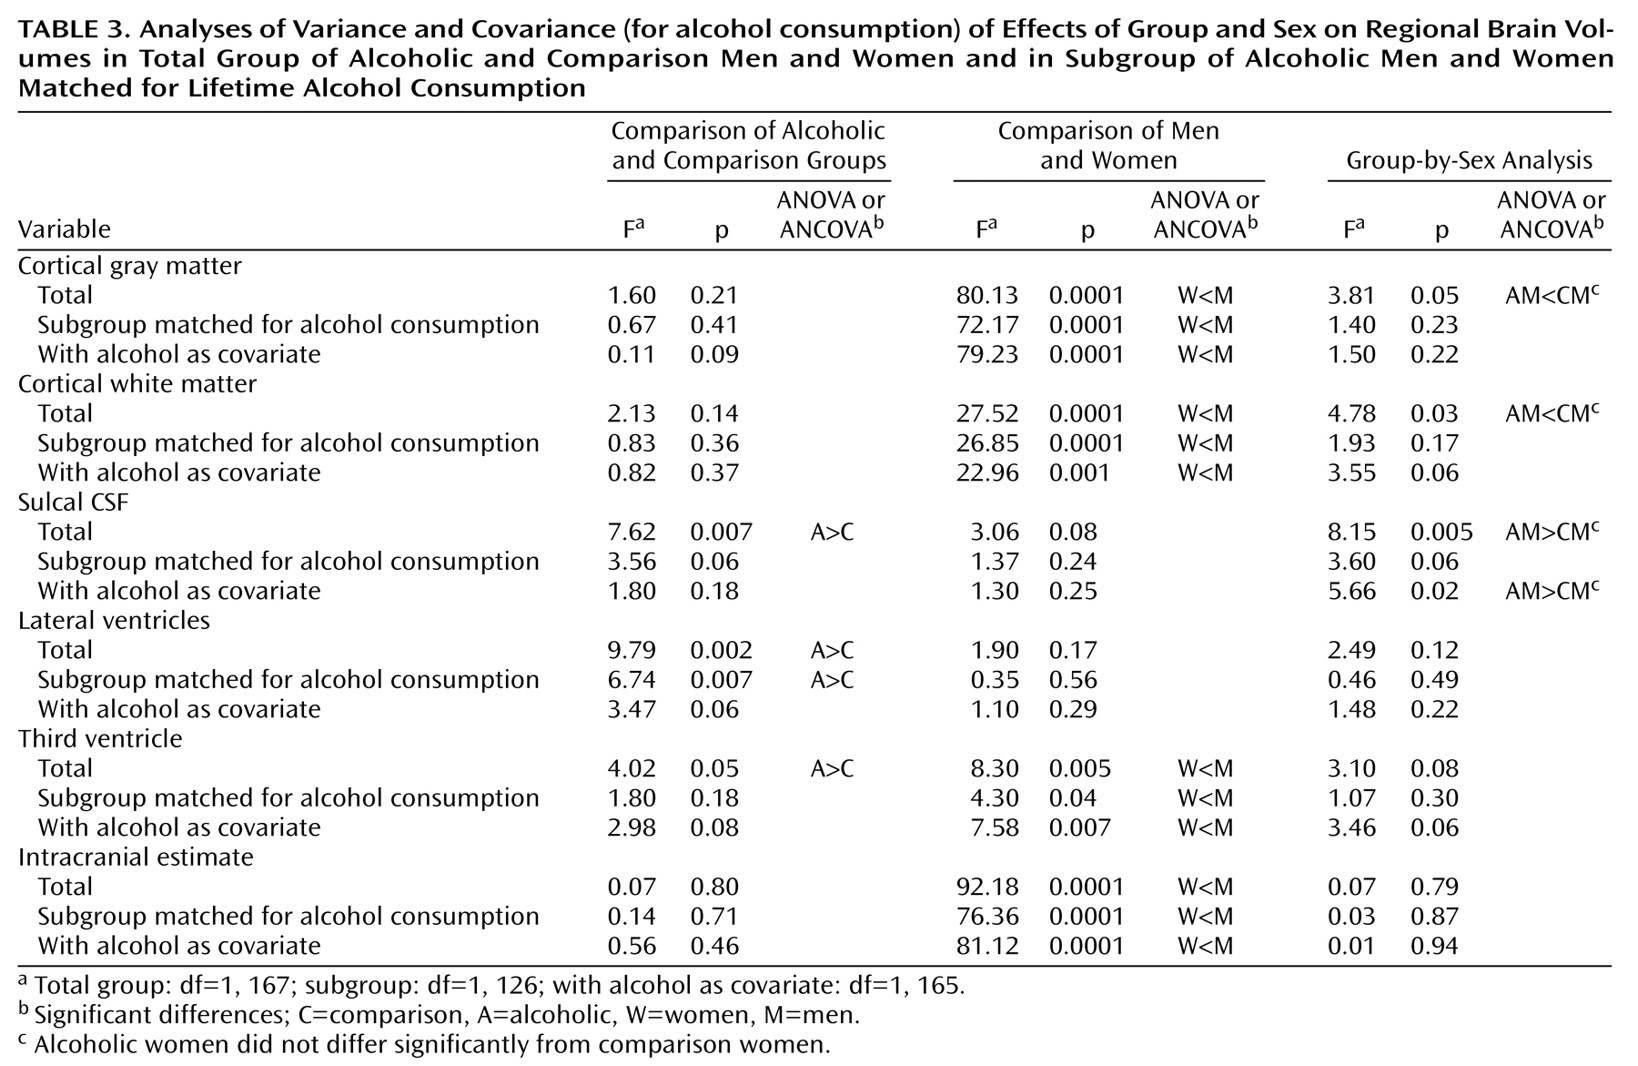
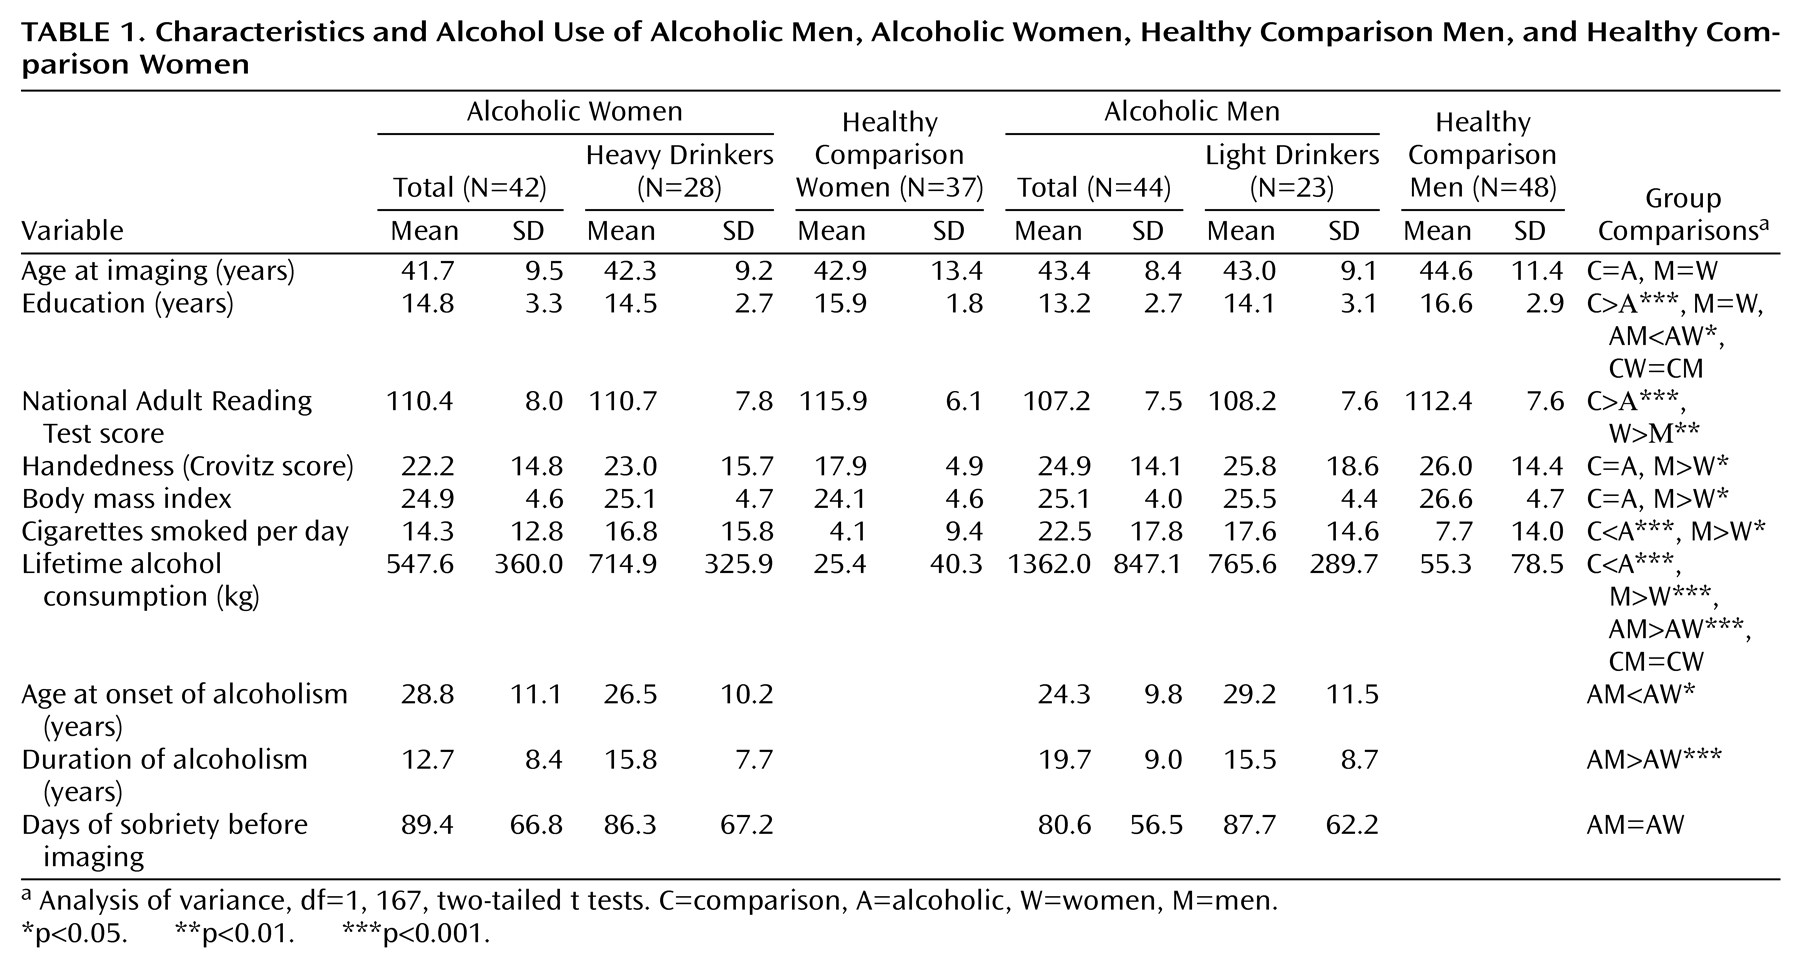
Table 1 lists the demographic and clinical characteristics of the subject groups and summarizes ANOVAs for the total groups. All groups were matched on age. Healthy comparison subjects were better educated than patients (F=28.13, df=1, 167, p<0.0001). Men and women as a whole had equivalent educations, but within the alcoholic groups, the women had more education than the men (t=2.56, df=84, p<0.05). The men had a higher body mass index than the women (F=4.17, df=1, 166, p<0.05), but there was no difference in body mass index between the alcoholics and the healthy comparison subjects, suggesting relatively normal nutritional status at the time of the MRI scan. The healthy comparison subjects smoked less than the alcoholics (F=27.19, df=1, 149, p<0.0001), and the women as a group smoked less than the men as a group (F=6.16, df=1, 149, p<0.05). The group-by-sex interaction was not significant. Within the total groups of alcoholic men and women, the women had consumed less alcohol than the men (t=5.75, df=84, p<0.0001), had started drinking at alcoholic levels (defined as 80 g/day for men and 60 g/day for women) at a later age (t=1.93, df=81, p=0.057), and had shorter histories of alcoholic drinking (t=3.67, df=81, p<0.001). They had also smoked less than the men (t=2.37, df=80, p<0.05). None of these differences was significant in the restricted groups matched for alcohol consumption.

Brain Volume Measures

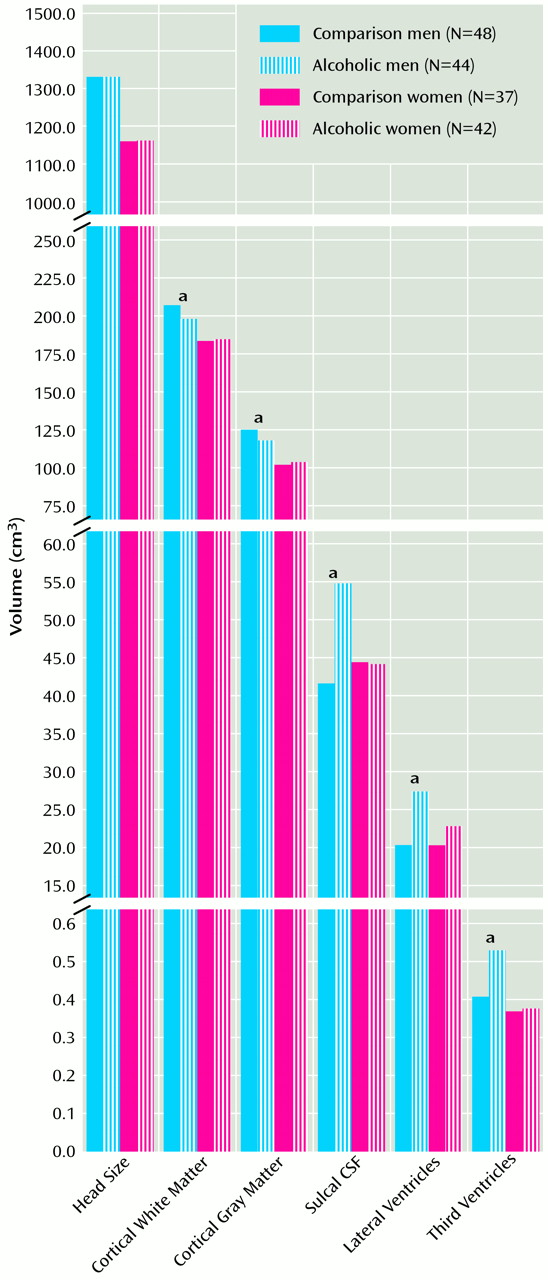
Mean regional brain volumes for each group, expressed in cubic centimeters, are presented in Table 2. ANOVAs for the total groups and subgroups and ANCOVAs, covarying for alcohol consumption, for the total groups are presented in Table 3. Figure 1 plots values for each group’s regional brain volume measures. As expected, intracranial volume was larger in men than in women. This sex effect was also seen in cortical gray and white matter and in third ventricular volume but did not reach significance for cortical sulcal and lateral ventricular volumes.
The alcoholics had larger volumes of cortical sulci and lateral and third ventricles than the healthy comparison subjects. These differences remained significant for the lateral ventricles, even after covarying for alcohol consumption or within the alcohol-matched restricted groups with lower mean alcohol consumption. The group effects at the cortical sulci and third ventricles were nonsignificant when we compared the smaller alcohol-matched groups or covaried for alcohol consumption.
ANOVA interactions were significant for cortical white matter, gray matter, and cortical sulci. Follow-up two-tailed t tests revealed that alcoholic men showed deficits relative to healthy comparison men, but alcoholic women were not significantly different from healthy comparison women. After statistically covarying for alcohol consumption, the interactions for the sulci remained significant, while those for white matter and the third ventricle volumes approached significance. In the alcohol-matched restricted groups, only the cortical sulci interactions approached significance.
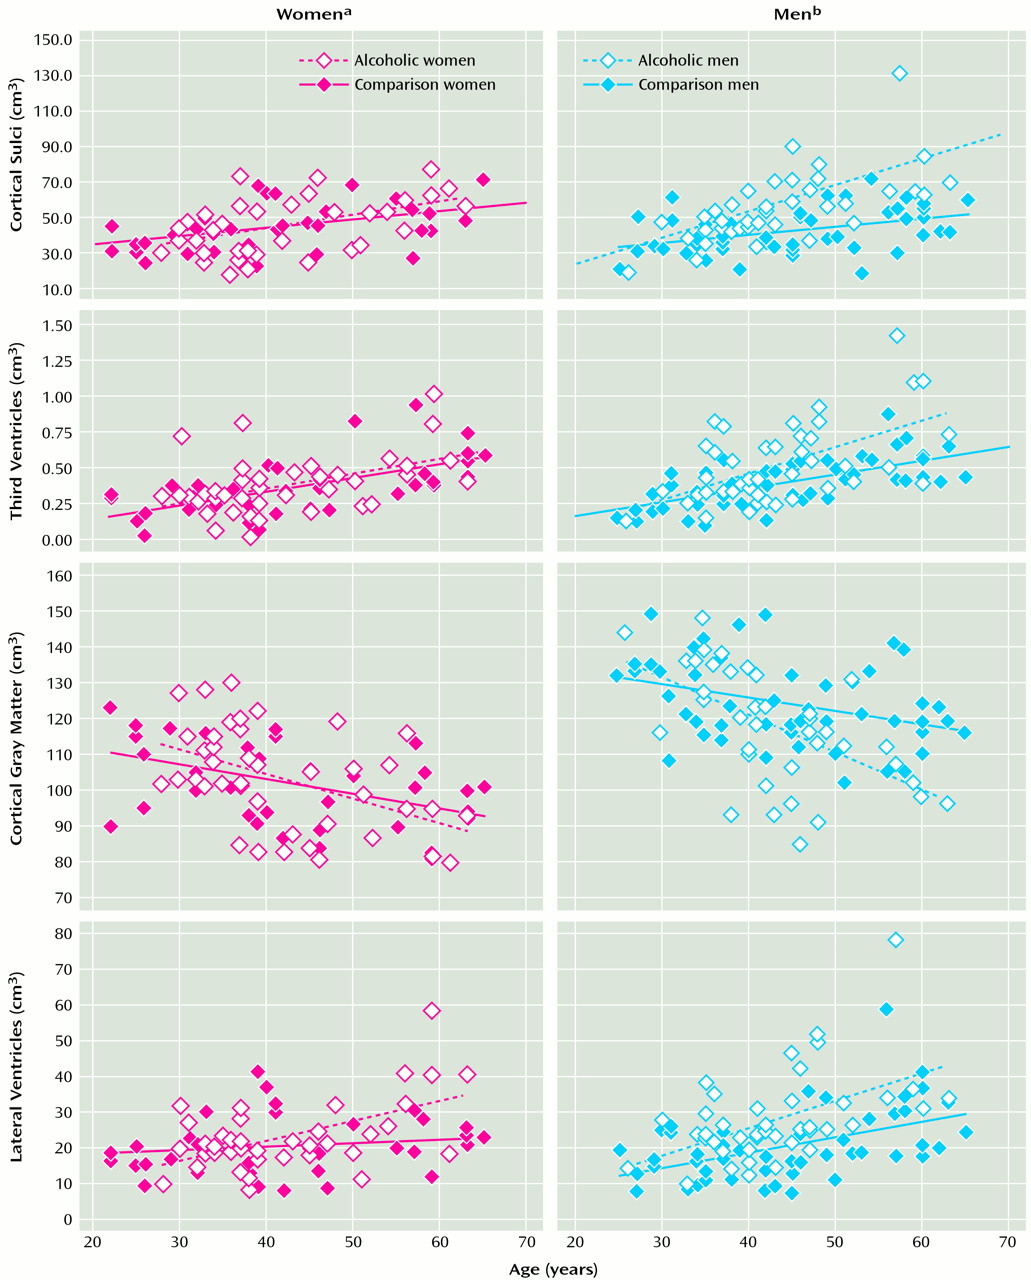
Regression analysis across data for all men, irrespective of diagnosis, found age to be a significant predictor of cortical gray matter (r=0.42, p<0.0001), cortical sulcal (r=0.45, p<0.0001), lateral ventricular (r=0.44, p<0.0001), and third ventricular (r=0.52, p<0.0001) volumes but not cortical white matter volumes (r=0.05, p=0.66). Age was also a significant predictor of cortical gray matter (r=0.46, p<0.0001), sulcal (r=0.47, p<0.0001), lateral ventricular (r=0.33, p<0.003), and third ventricular (r=0.55, p<0.0001) volumes but not cortical white matter volumes (r=0.07, p=0.53) across all women, irrespective of diagnosis.
Figure 2 plots values for regional brain volume measures against age, separately for men and women and within each sex group for alcoholic and healthy comparison subjects. The slopes relating regional brain volume measures to age were significantly steeper in alcoholic than healthy comparison men for cortical gray matter, sulcal, and third ventricular volumes but not lateral ventricular volumes. In women, the slopes relating regional brain measures to age were significantly steeper in alcoholic than healthy comparison women for lateral ventricular volumes.
For the alcoholic men, lifetime alcohol consumption added to age in a multiple regression provided no additional predictive value to any of the brain variables measured, nor did length of sobriety before the imaging. The same pattern of results was found for the alcoholic women, with one exception: longer recent sobriety predicted greater cortical white matter volumes (partial F=8.62, df=2, 39, p<0.006) after we controlled for age.
A prior analysis of cortical gray matter volumes in men with alcoholism (8) found that alcoholics age 45 and older have a selectively more severe deficit in prefrontal gray matter than younger alcoholics. Repeated measures ANOVAs for the six cortical gray matter regions of interest were performed separately for men and women. For men, diagnosis (F=5.87, df=1, 90, p=0.02) and the repeated measure for region of interest (F=1927.66, df=5, 450, p<0.0001) were both significant, as was the interaction of the two (F=4.25, df=5, 450, p<0.001). For women, the repeated measure for region of interest was significant (F=1284.82, df=5, 385, p<0.0001), but neither diagnosis (F=0.26, df=1, 77, p=0.61) nor the interaction of the two (F=0.41, df=5, 385, p<0.84) was significant. When this analysis was repeated only for women over the age of 45, the pattern of results was the same.
One limitation of this study was that the alcoholic and healthy comparison subjects were not well matched on education or tobacco use. Correction for educational differences is complex because, in addition to significant differences in levels of education between diagnostic groups, there was a diagnosis-by-sex interaction in which the alcoholic men had significantly less education than the healthy male comparison subjects (t=5.84, df=90, p<0.0001), whereas the alcoholic women were not significantly different from the healthy comparison women (t=1.75, df=77, p=0.09) regarding education. Furthermore, education-by-brain volume interaction slopes differed by diagnosis for cortical gray and white matter volumes, precluding valid ANCOVA correction over the total groups. Therefore, to determine if educational difference could account for the deficits, ANCOVAs were applied only to the men for whom brain volume deficits were found. This analysis showed that diagnosis remained a significant predictor of sulcal CSF (F=19.57, df=1, 89, p=0.0001), gray matter (F=3.56, df=1, 89, p=0.06), lateral ventricular (F=21.07, df=1, 89, p=0.0001), and third ventricular (F=12.37, df=1, 89, p=0.0007) volumes after control for educational differences. Cortical white matter volume was excluded from this ANCOVA, as it was related differently to education in alcoholic (r=0.18, df=1, 43, p=0.24) and healthy comparison (r=0.55, df=1, 47, p<0.001) men.
Discussion

Prior studies of women with alcoholism have reported sulcal and ventricular size (1214), overall brain volume (16), or specific subcortical structural (15, 16) abnormalities. To our knowledge, the present study is the first to have examined separate measures of gray and white matter volumes in a large sample of the cortex. Although alcoholic men, relative to their healthy male comparison counterparts, showed significant deficits in cortical gray and white matter volumes as well as enlargement of sulci and lateral and third ventricles, alcoholic women showed no detectable deficit in any of these cortical brain volume measures, relative to healthy comparison women. As in most earlier studies comparing men and women, this group of women consumed less alcohol than the men. Covarying for lifetime alcohol consumption or excluding subjects to yield groups of men and women alcoholics with equivalent lifetime alcohol consumption diminished but did not alter the basic finding. The low-alcohol-consuming subgroup of men showed larger sulci and lateral ventricles but not less cortical gray or white matter than the healthy male comparison subjects. However, the high-alcohol-consuming subgroup of women did not show significant deficits on any measure. This finding is at variance with those of earlier studies of alcoholic men and women, which have found comparable (or even greater) deficits in women compared with men, even though women consumed less alcohol (12, 13, 15, 16). However, our findings are consistent with those of a recent positron emission tomography [18F]fluorodeoxyglucose study (26) that reported deficits in metabolic energy utilization in alcoholic men relative to healthy comparison men but not in alcoholic women relative to healthy comparison women.
One of the difficulties of comparing brain volume measures between men and women is that, on average, healthy men have larger brains than healthy women (27). Although there is a general consensus that overall head size differs between the sexes, a consensus regarding normal sex differences in many specific brain structures and regions has not yet been reached (28). Systematic studies of the relationship of brain structures and regions to global measures of head size in men and women have shown that the relationship between specific brain structures and overall brain size may vary among healthy men and women, e.g., studies of the corpus callosum (29, 30). Furthermore, the “normal” relationships observed in community samples may be altered by the pathological process under investigation. Thus, there is considerable controversy about the most appropriate way to take normal sex differences in head size into account when studying sex differences in pathological groups. Some studies express regions of the brain as a proportion of overall head size, e.g., the ventricular brain ratio; some enter an estimate of intracranial volume as a covariate in the analysis. Recently, it has been proposed that individual structures, such as the hippocampus, should be analyzed as a proportion of total brain volume excluding that structure to avoid pitfalls associated with the analysis of compositional data (16). Potential sex differences in the effect of normal aging on brain morphology (e.g., references 3133) provide additional complexity. For this study we compared absolute volumes of different brain regions with the assumption that nonspecific differences related to sex differences in head size would be accounted for by including both male and female patient and healthy comparison groups in the ANOVA.
Predicted relationships between age and raw brain measures (19, 33), including a lack of change in cortical white matter volume over this age range, were found in the healthy comparison subjects in this study. In contrast to those found in normal aging, men with alcoholism had steeper slopes linking age and cortical gray matter, sulcal volume, and third ventricular volume than did healthy comparison men. Similarly, women with alcoholism showed an exaggerated aging effect relative to healthy comparison women in the lateral ventricles. Thus, women’s and men’s brains show a greater vulnerability to alcohol with greater age, but the brain regions affected may be different. In addition, women with alcoholism, even older women, did not show the greater vulnerability of prefrontal gray matter that we had found earlier in men with alcoholism.
After taking age into account, neither lifetime alcohol consumption nor days of sobriety added any additional predictive power for any measures in either sex, with one exception: length of sobriety predicted cortical white matter volumes in the women. This association was reduced, but not eliminated, when the contribution of intracranial volume was taken into account. This cross-sectional analysis cannot determine if longer periods of sobriety enable greater recovery of white matter volume, a possibility consistent with longitudinal observations that white matter volume in abstaining and relapsing patients with alcoholism is associated with length of sobriety (9, 34).
Although educational differences between diagnostic groups and men and women may have contributed to the observed diagnostic differences in cortical white matter volumes, education did not play a significant role in the main effects on other brain measures. It is beyond the scope of this article to speculate about why this may be so. Suffice it to say that the observed lesser amount of cortical white matter in alcoholic men may reflect variables other than diagnosis.
Differences in body morphology and composition (35) and alcohol metabolism (36) between men and women have been proposed as reasons women suffer more extreme effects of alcohol on other physiological systems than men. Although measures of body composition were not available for study, body mass index was measured and found to be comparable across diagnostic groups and the sexes (Table 1). Estrogen may also confer a protective influence on the brains of women (37, 38). We have no data specific to estrogen levels in these subjects, although most of the women were premenopausal; of those who were postmenopausal, the majority were taking hormonal supplements.
Another difference between groups in this study was in levels of smoking. Women as a group had smoked less than the men, and alcoholics, regardless of sex, had smoked more than the healthy comparison subjects. An exploratory analysis across the entire group of alcoholics plus the comparison subjects (153 for whom smoking histories were available) revealed that smoking history predicted cortical sulcal volume (Pearson’s correlation r=0.19, df=1, 152, p=0.02) but no other brain variable. ANCOVAs revealed that diagnosis remained a significant predictor of sulcal CSF (F=9.98, df=1, 87, p=0.002), gray matter (F=4.23, df=1, 87, p=0.04), lateral ventricular (F=21.07, df=1, 89, p=0.0001), and third ventricular (F=12.37, df=1, 89, p=0.0007) volumes in the men after accounting for smoking differences between the alcoholics and the healthy comparison subjects. Results for white matter volumes approached significance (F=2.86, df=1, 87, p=0.09).
The alcoholic patients recruited for this study were older than the patients included in some other reports (15, 16). Furthermore, they were tested after longer periods of sobriety, approximately 2–3 months, rather than after less than a month, as was typical of earlier studies. One possibility is that women show more rapid recovery of gross cortical brain volume than men during brief periods of sobriety. This possibility received modest support from the association between length of sobriety and volume of cortical white matter in the women. Prospective studies systematically monitoring patterns of early recovery in both women and men are needed to answer this question.
The MRI data in this report were derived from 5-mm-thick, axial dual spin-echo images, acquired with a 2.5-mm interslice gap to prevent crosstalk. Although thinner slice acquisition sequences are now commonly used, especially for T1-weighted images, dual spin-echo images continue to provide high signal-to-noise data that are readily amenable to segmentation. This acquisition sequence was deliberately retained over several years to enable comparisons between different clinical groups accumulated over time, as well as assessment of change in individual subjects. Although no longer considered by some as state-of-the-art, the sequence and analysis approach has been sufficiently sensitive to illuminate structural brain abnormalities and progression in a number of different psychiatric and neurologic disorders.
Another limitation of this study derives from the fact that recruitment for women with alcoholism started after the initial recruitment of men with alcoholism was completed. The men were all military veterans who had been admitted to an inpatient treatment facility within a year before the imaging used for this analysis was performed. Of the 42 women in this study, only nine were veterans recruited from this inpatient facility; an additional three veterans were recruited from outpatient programs. Women with alcoholism were recruited for this study primarily through outpatient treatment facilities. This difference may reflect the greater availability of inpatient treatment facilities for men than women and/or the different strategies required of men and women for obtaining treatment for alcoholism while maintaining family obligations. As recruitment proceeded, we found that the alcoholic women also had greater psychiatric comorbidity than the men, a result consistent with that found in other studies (39), which necessitated some relaxation of the comorbidity exclusion criteria. Curiously, despite showing greater psychiatric comorbidity than the men, the women showed less brain abnormality compared to same-sex comparison subjects. Future studies comparing the effects of chronic alcohol dependence in men and women will require greater control over these differences in subject characteristics.
TABLE 1
TABLE 2
TABLE 3
Figure 1. Estimated Regional Brain Volumes for Alcoholic Men, Alcoholic Women, Healthy Comparison Men, and Healthy Comparison Women
aSignificant difference within male group; two-tailed t test.
Figure 2. Regional Brain Volumes as a Function of Age for Alcoholic Men, Alcoholic Women, Healthy Comparison Men, and Healthy Comparison Women
aThe slope for lateral ventricles was significantly steeper for the alcoholic women than for the comparison women (slopes test, p=0.009).
bThe slopes were significantly steeper for the alcoholic men than for the comparison men for cortical gray matter (p=0.02), cortical sulci (p=0.0007), and third ventricles (p=0.05) (slopes test).

Footnote

Presented in part at an annual meeting of the Research Society for Alcoholism, Washington, D.C., June 22–27, 1996. Received April 20, 2000; revision received Aug. 8, 2000; accepted Oct. 23, 2000. From the Neuropsychiatry Program, SRI International; and the Department of Psychiatry and Behavioral Sciences, Stanford University School of Medicine, Stanford, Calif. Address reprint requests to Dr. Pfefferbaum, Neuropsychiatry Program, SRI International, 333 Ravenswood Ave., Menlo Park, CA 95025; [email protected] (e-mail). Supported by grants from the National Institute on Alcohol Abuse and Alcoholism (AA-05965 and AA-10723), NIMH (MH-30854 and MH-58007), and the U.S. Department of Veterans Affairs. The authors thank the staff of the Laboratory of Physiological and Structural Brain Imaging (particularly Mea Ha, Leslie O’Neill, Jennifer Jackson, and Catherine Ju) for their help with recruitment and evaluation, and Brian Matsumoto and Kenneth Chow for imaging and statistical analysis.

References

1.
York JL, Welte JW: Gender comparisons of alcohol consumption in alcoholic and nonalcoholic populations. J Stud Alcohol 1994; 55:743–750
2.
Kessler RC, McGonagle KA, Zhao S, Nelson CB, Hughes M, Eshleman S, Wittchen H-U, Kendler KS: Lifetime and 12-month prevalence of DSM-III-R psychiatric disorders in the United States: results from the National Comorbidity Survey. Arch Gen Psychiatry 1994; 51:8–19
3.
Ashley MJ, Olin JS, le Riche WH: Morbidity in alcoholics: evidence for accelerated development of physical disease in women. Arch Intern Med 1977; 137:883–887
4.
Fillmore KM, Golding JM, Kneip S, Leino EV, Shoemaker C, Ager CR, Ferrer HP: Gender differences for the risk of alcohol-related problems in multiple national contexts, in Recent Developments in Alcoholism, vol 12: Alcoholism and Women. Edited by Galanter M. New York, Plenum Press, 1995, pp 410–440
5.
Pfefferbaum A, Lim KO, Zipursky RB, Mathalon DH, Lane B, Ha CN, Rosenbloom MJ, Sullivan EV: Brain gray and white matter volume loss accelerates with aging in chronic alcoholics: a quantitative MRI study. Alcohol Clin Exp Res 1992; 16:1078–1089
6.
Jernigan TL, Butters N, DiTraglia G, Schafer K, Smith T, Irwin M, Grant I, Schuckit M, Cermak L: Reduced cerebral grey matter observed in alcoholics using magnetic resonance imaging. Alcohol Clin Exp Res 1991; 15:418–427
7.
Pfefferbaum A, Sullivan EV, Rosenbloom MJ, Shear PK, Mathalon DH, Lim KO: Increase in brain cerebrospinal fluid volume is greater in older than in younger alcoholic patients: a replication study and CT/MRI comparison. Psychiatry Res Neuroimaging 1993; 50:257–274
8.
Pfefferbaum A, Sullivan EV, Mathalon DH, Lim KO: Frontal lobe volume loss observed with magnetic resonance imaging in older chronic alcoholics. Alcohol Clin Exp Res 1997; 21:521–529
9.
Pfefferbaum A, Sullivan EV, Mathalon DH, Shear PK, Rosenbloom MJ, Lim KO: Longitudinal changes in magnetic resonance imaging brain volumes in abstinent and relapsed alcoholics. Alcohol Clin Exp Res 1995; 19:1177–1191
10.
Pfefferbaum A, Sullivan E, Rosenbloom MJ, Mathalon DH, Lim KO: A controlled study of cortical gray matter and ventricular changes in alcoholic men over a five year interval. Arch Gen Psychiatry 1998; 55:905–912
11.
Muuronen A, Bergman H, Hindmarsh T, Telakivi T: Influence of improved drinking habits on brain atrophy and cognitive performance in alcoholic patients: a 5-year follow-up study. Alcohol Clin Exp Res 1989; 13:137–141
12.
Jacobson R: The contributions of sex and drinking history to the CT brain scan changes in alcoholics. Psychol Med 1986; 16:547–549
13.
Mann K, Batra A, Gunthner A, Schroth G: Do women develop alcoholic brain damage more readily than men? Alcohol Clin Exp Res 1992; 16:1052–1056
14.
Kroft CL, Gescuk B, Woods BT, Mello NK, Weiss RD, Mendelson JH: Brain ventricular size in female alcoholics: an MRI study. Alcohol 1991; 8:31–34
15.
Hommer D, Momenan R, Rawlings R, Ragan P, Williams W, Rio D, Eckardt M: Decreased corpus callosum size among alcoholic women. Arch Neurol 1996; 53:359–363
16.
Agartz I, Momenan R, Rawlings RR, Kerich MJ, Hommer DW: Hippocampal volume in patients with alcohol dependence. Arch Gen Psychiatry 1999; 56:356–363
17.
Pfefferbaum A, Lim KO, Desmond J, Sullivan EV: Thinning of the corpus callosum in older alcoholic men: a magnetic resonance imaging study. Alcohol Clin Exp Res 1996; 20:752–757
18.
Skinner HA: Development and Validation of a Lifetime Alcohol Consumption Assessment Procedure. Toronto, Addiction Research Foundation, 1982
19.
Pfefferbaum A, Mathalon DH, Sullivan EV, Rawles JM, Zipursky RB, Lim KO: A quantitative magnetic resonance imaging study of changes in brain morphology from infancy to late adulthood. Arch Neurol 1994; 51:874–887
20.
Sullivan E, Lim K, Mathalon D, Marsh L, Beal D, Harris D, Hoff A, Faustman W, Pfefferbaum A: A profile of cortical gray matter volume deficits characteristic of schizophrenia. Cereb Cortex 1998; 8:117–124
21.
Fama R, Sullivan EV, Shear PK, Marsh L, Yesavage JA, Tinklenberg JR, Lim KO, Pfefferbaum A: Selective cortical and hippocampal volume correlates of Mattis Dementia Rating Scale in Alzheimer disease. Arch Neurol 1997; 54:719–728
22.
Skinner HA, Sheu WJ: Reliability of alcohol use indices: the lifetime drinking history and the MAST. J Stud Alcohol 1982; 43:1157–1170
23.
Mathalon DH, Sullivan EV, Rawles JM, Pfefferbaum A: Correction for head size in brain-imaging measurements. Psychiatry Res Neuroimaging 1993; 50:121–139
24.
Lim KO, Pfefferbaum A: Segmentation of MR brain images into cerebrospinal fluid spaces, white and gray matter. J Comput Assist Tomogr 1989; 13:588–593
25.
Sullivan E, Mathalon DH, Lim KO, Marsh L, Pfefferbaum A: Patterns of regional cortical dysmorphology distinguishing schizophrenia and chronic alcoholism. Biol Psychiatry 1998; 43:118–131
26.
Wang Y, Li S-J: Differentiation of metabolic concentrations between gray matter and white matter of human brain by in vivo 1H magnetic resonance spectroscopy. Magn Reson Med 1998; 39:28–33
27.
De Lacoste MC, Adesanya T, Woodward DJ: Measures of gender differences in the human brain and their relationship to brain weight. Biol Psychiatry 1990; 28:931–942
28.
Breedlove SM: Sexual dimorphism in the vertebrate nervous system. J Neurosci 1992; 12:4133–4142
29.
Clarke S, Kraftsik R, van der loos H, Innocenti GM: Forms and measures of adult and developing human corpus callosum: is there sexual dimorphism? J Comp Neurol 1989; 280:213–230
30.
Allen LS, Richey MF, Chai YM, Gorski RA: Sex differences in the corpus callosum of the living human being. J Neurosci 1991; 11:933–942
31.
Blatter DD, Bigler ED, Gale SD, Johnson SC, Anderson C, Burnett BM, Parker N, Kurth S, Horn S: Quantitative volumetric analysis of brain MRI: normative database spanning five decades of life. Am J Neuroradiol 1995; 16:241–245
32.
Gur RC, Mozley PD, Resnick SM, Gottlieb GL, Kohn M, Zimmerman R, Herman G, Atlas S, Grossman R, Berretta D, Erwin R, Gur RE: Gender differences in age effect on brain atrophy measured by magnetic resonance imaging. Proc Natl Acad Sci USA 1991; 88:2845–2849
33.
Raz N: Neuroanatomy of the aging brain observed in vivo: a review of structural MRI findings, in Handbook of Human Brain Functioning: Neuroimaging, vol 2. Edited by Bigler ED. New York, Plenum, 1996, pp 153–182
34.
Shear PK, Jernigan TL, Butters N: Volumetric magnetic resonance imaging quantification of longitudinal brain changes in abstinent alcoholics. Alcohol Clin Exp Res 1994; 18:172–176
35.
Ely M, Hardy R, Longford N, Wadsworth M: Gender differences in the relationship between alcohol consumption and drink problems are largely accounted for by body water. Alcohol Alcohol 1999; 34:894–902
36.
Frezza M, di Padova C, Pozzato G, Terpin M, Baraona E, Lieber CS: High blood alcohol levels in women. N Engl J Med 1990; 322:95–99
37.
Resnick SM, Maki PM, Golski S, Kraut MA, Zonderman AB: Effects of estrogen replacement therapy on PET cerebral blood flow and neuropsychological performance. Hormones and Behavior 1998; 34:171–182
38.
Woolley CS: Electrophysiological and cellular effects of estrogen on neuronal function. Crit Rev Neurobiol 1999; 13:1–20
39.
Brady KT, Randall CL: Gender differences in substance use disorders. Psychiatr Clin North Am 1999; 22:241–252

Information & Authors

Information

Published In

Go to American Journal of Psychiatry
American Journal of Psychiatry
Pages: 188 - 197
PubMed: 11156800

History

Published online: 1 February 2001
Published in print: February 2001

Authors

Details

Adolf Pfefferbaum, M.D.
Margaret Rosenbloom, M.A.
Edith V. Sullivan, Ph.D.

Metrics & Citations

Metrics

Citations

Export Citations

If you have the appropriate software installed, you can download article citation data to the citation manager of your choice. Simply select your manager software from the list below and click Download.

For more information or tips please see 'Downloading to a citation manager' in the Help menu.

Format
Citation style
Style
Copy to clipboard

View Options

View options

PDF/EPUB

View PDF/EPUB

Login options

Already a subscriber? Access your subscription through your login credentials or your institution for full access to this article.

Personal login Institutional Login Open Athens login
Purchase Options

Purchase this article to access the full text.

PPV Articles - American Journal of Psychiatry

PPV Articles - American Journal of Psychiatry

Not a subscriber?

Subscribe Now / Learn More

PsychiatryOnline subscription options offer access to the DSM-5-TR® library, books, journals, CME, and patient resources. This all-in-one virtual library provides psychiatrists and mental health professionals with key resources for diagnosis, treatment, research, and professional development.

Need more help? PsychiatryOnline Customer Service may be reached by emailing [email protected] or by calling 800-368-5777 (in the U.S.) or 703-907-7322 (outside the U.S.).

Media

Figures

Other

Tables

Share

Share

Share article link

Share