Subject Preparation
For subjects in the smoking group, all sessions took place in mid-morning, after approximately 10 hours of smoking deprivation. A BreathCO carbon monoxide monitor (Vitalograph Inc., Lenexa, Kan.) was used to measure carbon monoxide in the exhaled breath in order to verify smoking abstention. The mean carbon monoxide reading for the group was 13.2 ppm before scanning, a value similar to that reported in other studies requiring overnight smoking abstention
(19).
During the imaging session, each subject laid on the scanner gurney, with his or her head resting on a foam cushion inside the head coil. Head motion was restricted by a vacuum pack system around the sides of the head and tape stretched across the forehead. Only minimal head motion (2 mm or less in the x, y, or z direction) was measured in any run, and therefore motion correction of the data was not performed. However, the presence of significant motion-related variability cannot be ruled out as a source of noise in the functional imaging data. Experimental stimuli were projected behind the subject’s head onto a screen, which was viewed using goggles with attached mirrors.
Behavioral Task Procedures
Three stimulus types were employed: smoking-related images, neutral images, and target images
(20). All images were color photographs, subtending approximately 20° by 16° of visual angle. Smoking-related images included pictures of people smoking, hands holding cigarettes, and pictures of cigarettes alone. Neutral images were matched by the experimenters to approximate the general content (objects, hands, and faces), complexity, and affective content of the smoking images, but they did not contain any smoking cues. Pictures of animals were designated as target images, at which point subjects were required to press a button on a response box.
Sixty smoking-related images, 60 neutral images, and 15 target images were presented to each subject. Each image was presented for 4 seconds with a fixation cross appearing for 14 seconds between images. Fifteen trials were presented in each of nine runs. Each run contained six to seven neutral images, six to seven smoking-related images, and one to two target images. Stimuli were presented in a random order, with the constraint that no more than two stimuli of the same type appeared consecutively.
fMRI Data Analysis
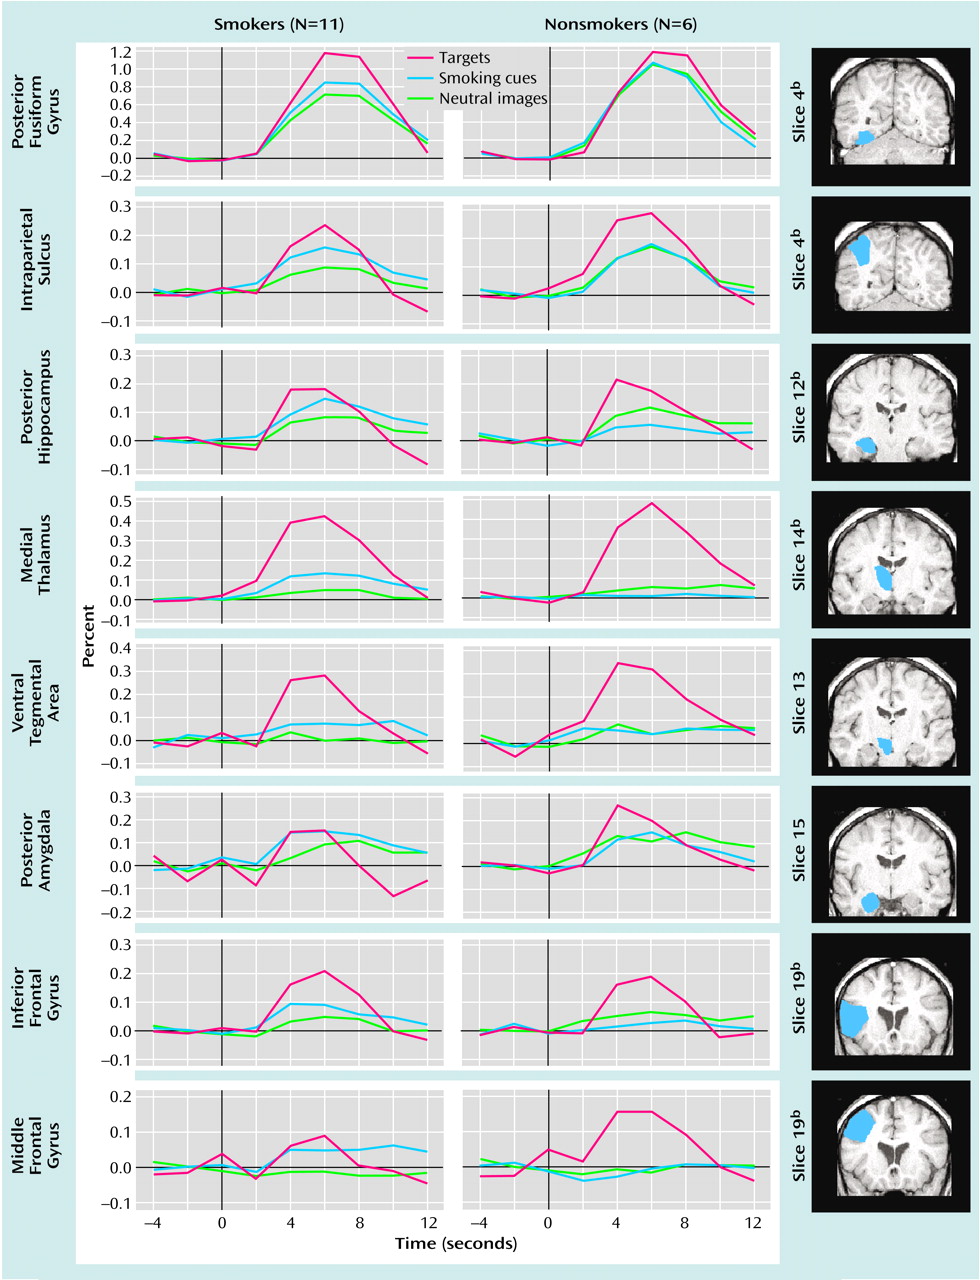
Peristimulus epochs (18 seconds total: 2 TRs before and 7 TRs after) were extracted from the raw MR time course to be averaged for each of the stimulus types. Therefore, for each voxel in each subject’s data, three epochs were identified: a smoking image epoch with nine time points (–4, –2, 0, 2, 4, 6, 8, 10, and 12), a neutral image epoch with nine time points, and a target epoch with nine time points. The smoking and neutral epochs contained the data from the average of 60 trials each, while the target epoch contained data from the average of 15 trials.
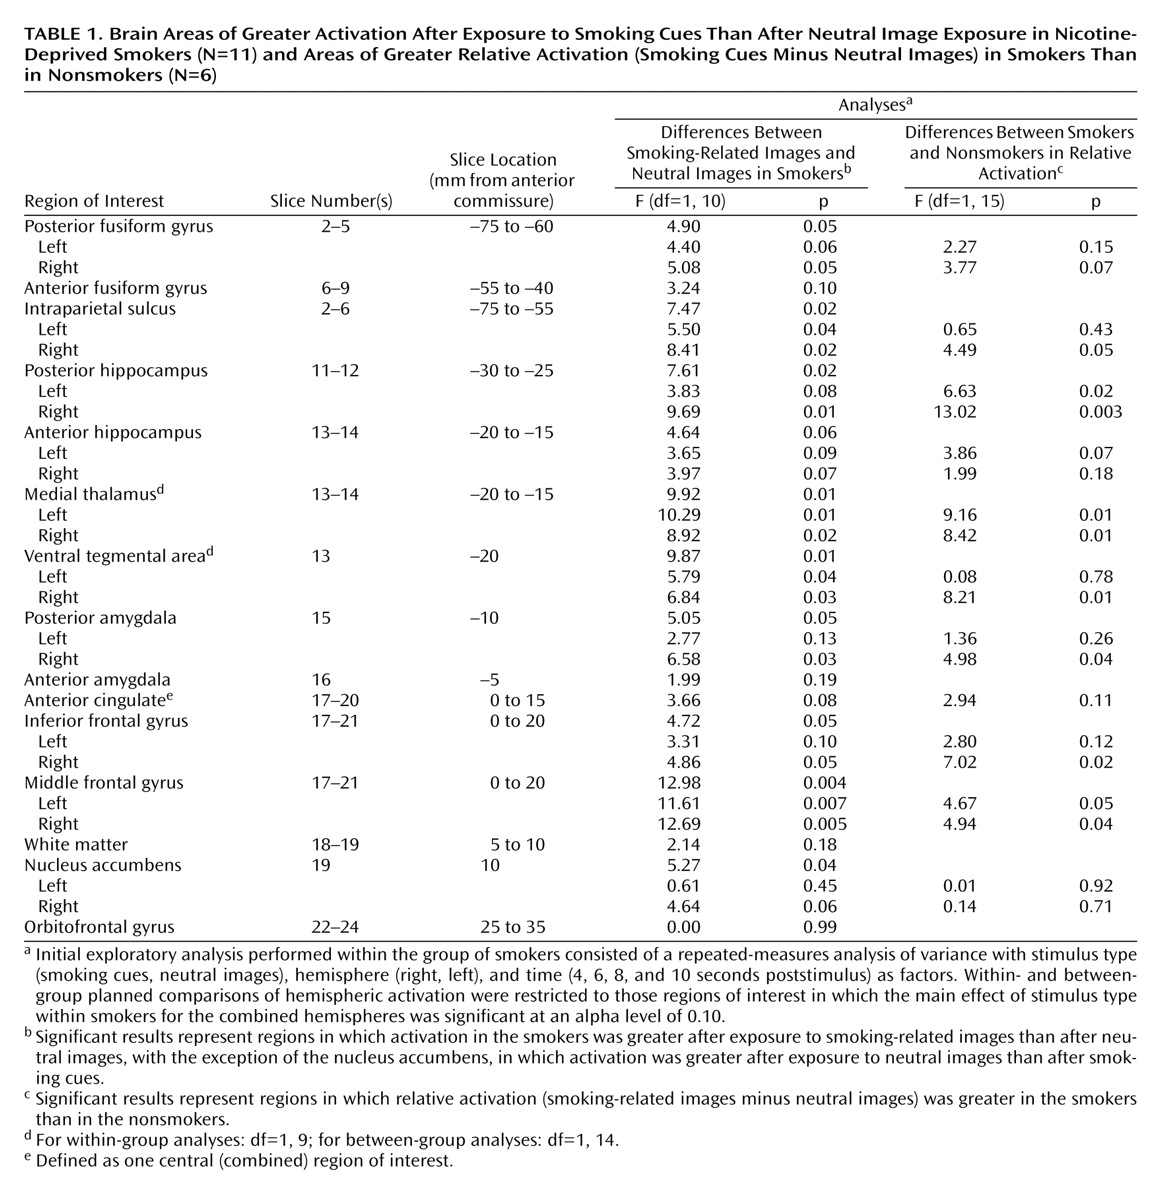
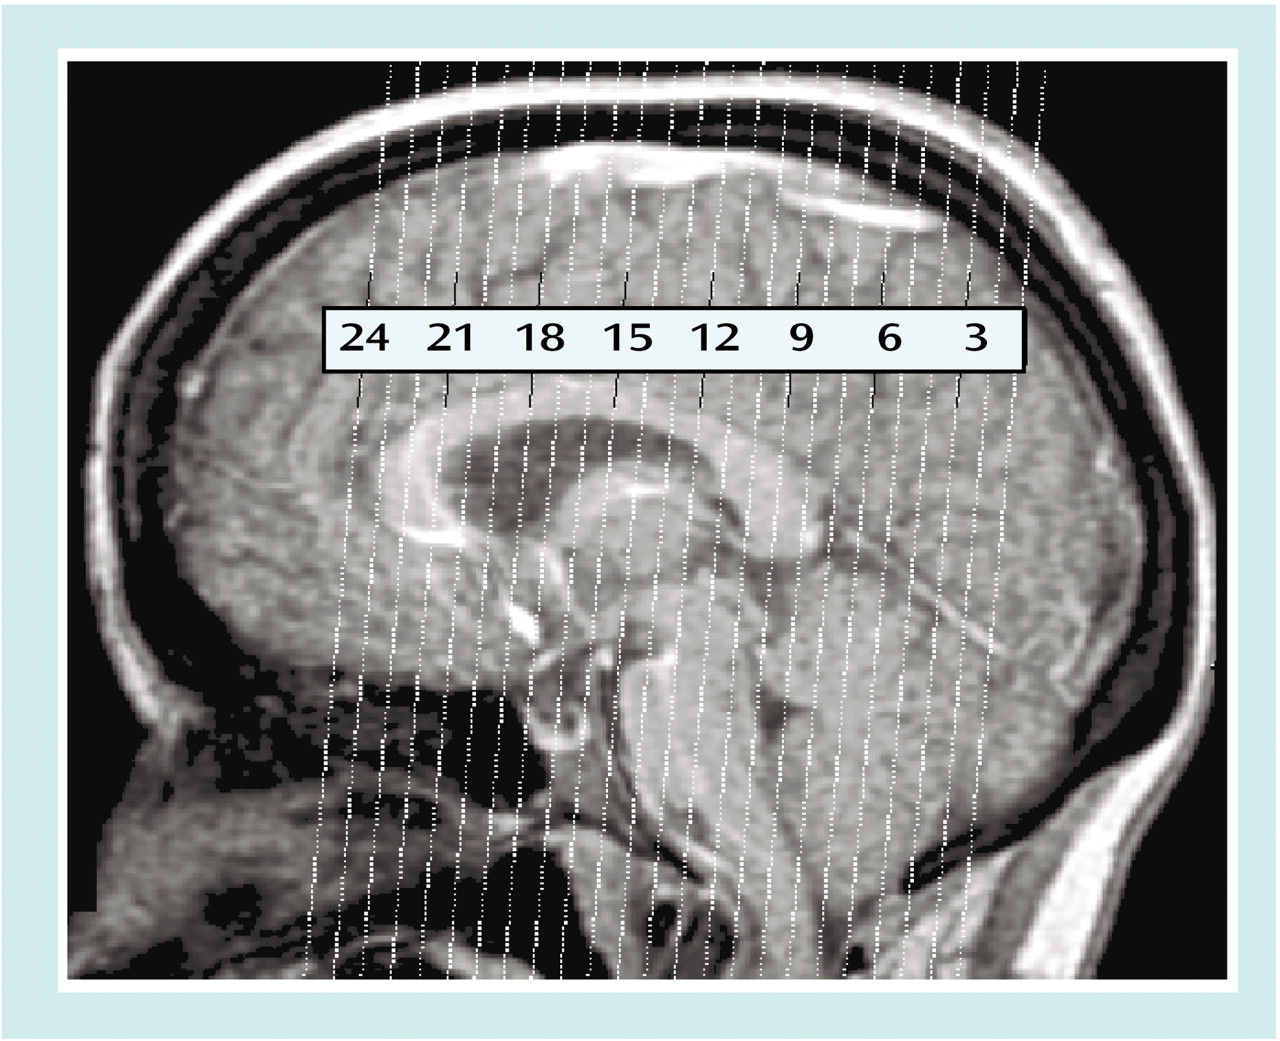
The fMRI signal change was examined in predefined regions of interest. The designated areas included those implicated in mesocorticolimbic reward circuits (ventral tegmental area, nucleus accumbens, amygdala, hippocampus, medial thalamus, and prefrontal cortex [defined as middle frontal gyrus, inferior frontal gyrus, and lateral orbitofrontal gyrus]) and in visuospatial-attention circuits (intraparietal sulcus, fusiform gyrus, anterior cingulate, inferior frontal gyrus, and middle frontal gyrus). From these hypotheses, 11 unique brain areas were predefined. After subdividing the amygdala, hippocampus, and fusiform gyrus into anterior and posterior sections and adding a white matter comparison region, a total of 14 regions of interest per subject were identified. Although the ventral pallidum was implicated as a key substrate in mesocorticolimbic circuits, it could not be included in the analysis because of susceptibility-associated fMRI signal loss. The orbitofrontal gyrus (lateral) and nucleus accumbens were included, but they border on areas prone to susceptibility artifact. Therefore, these regions of interest may have included some voxels that were subject to signal loss. The ventral tegmental area was not distinguishable from medial substantia nigra, and the region defined as the ventral tegmental area included the medial substantia nigra. Regions of interest were drawn by the authors on the high-resolution structural images of each subject and were identified by comparison to a MR-specific brain atlas
(21). Reliability of region-of-interest drawing was assessed by selecting a random sample of 50 regions of interest from the total set, which were drawn by two individuals. The agreement (voxel overlap percentage) between these regions of interest was greater than 85%.
For each subject, percent signal change from baseline in each epoch was calculated for each time bin and averaged according to stimulus type. The average signal from the time bins at –4, –2, and 0 seconds was considered to be the prestimulus baseline signal. Sobel edge-detection algorithms were used to identify boundaries in the functional images, which were then manually coregistered with the anatomical images by using custom scripts written in MATLAB (Mathworks, Natick, Mass.).
Our initial exploratory analysis consisted of a three-way repeated-measures analysis of variance (ANOVA) performed within the group of smokers with stimulus type (smoking cue, neutral image), hemisphere (right, left), and time (4, 6, 8, and 10 seconds poststimulus) as factors. We then restricted our within- and between-group planned comparisons to those regions of interest in which the main effect of stimulus type within smokers was significant at an alpha level of 0.10. To evaluate differences between groups, we first calculated the percent signal-change difference between smoking-related and neutral images for each group and used this relative difference as the basis for our statistical comparisons, which used an alpha level of 0.05.
To evaluate whether self-report measures were associated with fMRI activation, we performed a correlation analysis in which the mean craving, stress, and mood scores for each subject were correlated with the maximal difference in response between smoking-related and neutral images during the 4–10-second poststimulus period for each region of interest.


