Path Analysis
Maximum likelihood model fitting and estimation procedures were used for all of the analyses. The model that was fitted first focused on the relationship between change in cognition and change in functional status. An assumption of these analyses was the constraint of the time-invariant factor loadings of the cognitive functioning indicators (Boston test, praxic drawing, and word list learning test). That is, for each of these longitudinally administered measures, the same factor loading was postulated at all three measurement occasions (baseline, first follow-up, and second follow-up). As extensively discussed in the literature (see reference
37 for example), this factorial invariance restriction was a necessary condition for claiming that the same latent construct had been measured at the three assessments. When fitted to both the covariance matrix and the means of the observed variables, the basic model in
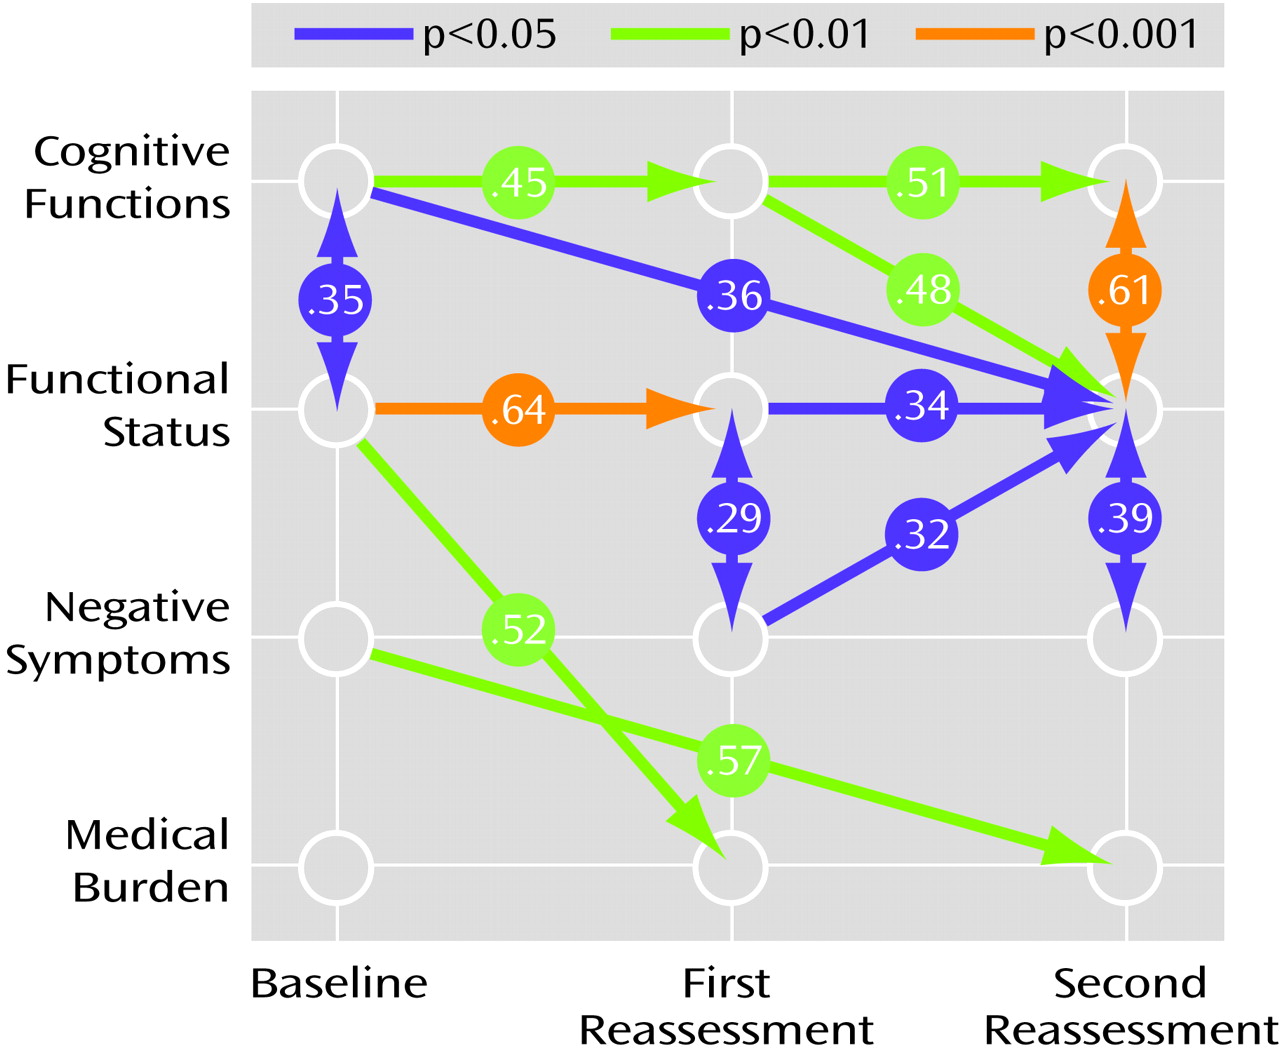
Figure 1 was found to be associated with χ
2=54.18 (df=42, p=0.19) and a root mean square error of approximation of 0.039 with a 90% confidence interval (CI=0–0.075). All of these goodness-of-fit measures indicated acceptable fit and indicated that this model explained a substantial proportion of the variance.
Evaluation of the predictive role of cognitive difficulties for functional status (
Figure 1) showed that initial cognitive ability was significantly related to initial functional status (maximum likelihood estimate [MLE]=–1.54, SE=0.71, t=–2.18, df=123, p<0.05) and that change in cognition from the second to the third assessment was also significant in its effect on change in functional status from the second to the third assessment (MLE=–0.54, SE=0.08, t=–6.98, df=123, <0.001). This result indicated that greater degrees of cognitive decline from the second to the third assessment were associated with concurrent greater loss in functional status from the second to the third assessment. Moreover, the influence of initial cognition (MLE=–0.19, SE=0.09, t=–2.08, df=123, p<0.05) and change in cognition from the first to the second assessment (MLE=–0.37, SE=0.13, t=–2.74, df=123, p<0.01) predicted change in functional status from the second to the third assessment. This result indicated that lower baseline cognitive performance and greater magnitude of cognitive decline from the first to the second assessment were associated with subsequent greater loss in functional status from the second to the third assessment. However, there was no significant relationship of baseline cognitive ability with change in functional status from the first to the second assessment (MLE=0.001, SE=0.06, t=–0.02, df=123, p=0.98). Change in functional status from first to second assessment was significantly related to change in functional status from the second to the third assessment (MLE=–0.28, SE=0.14, t=–2.04, df=123, p<0.05). Finally, initial functional status was significantly related to change in functional status from the first to the second assessment (MLE=–1.40, SE=0.37, t=–3.73, df=123, p<0.001) but not to subsequent change in functional status from the second to the third assessment points (MLE=–0.69, SE=0.49, t=–1.40, df=123, p=0.15).
Conversely, evaluation of the predictive role of functional status on cognitive performance (
Figure 1) showed that baseline functional status (MLE=0.37, SE=0.22, t=1.66, df=123, p<0.10) and change in functional status from the first to the second assessment point (MLE=0.35, SE=0.20, t=1.74, df=123, p<0.08) had nonsignificant relationships to change in cognition from the second to the third measurement. In addition, baseline functional status had no significant effect on change in cognitive functioning from the first to the second assessment (MLE=0.24, SE=0.18, t=1.33, df=123, p=0.19). However, initial cognition was significantly related to change in cognition from the first to the second assessment (MLE=–4.83, SE=1.60, t=–3.03, df=123, p<0.005) but not to change in cognition from the second to the third assessment (MLE=–1.54, SE=1.39, t=–1.11, df=123, p=0.24). The change in cognition from the first to the second assessment also had a significant effect on change in cognition from the second to the third measurement (MLE=–0.46, SE=0.17, t=–2.75, df=123, p<0.01).
To examine whether some of the above findings may be explained with relationships between negative or positive symptoms and increased medical problems of the patients, two saturated models were next fitted by including medical diagnoses and first negative symptoms and then positive symptoms in the model described earlier. The results from the first model indicated a significant effect of change in negative symptoms on increase in medical diagnoses (MLE=–0.05, SE=0.02, t=–2.51, df=123, p<0.05) over the entire period. The finding suggested that patients with high levels of negative symptoms had a more salient increase in the number of medical diagnoses across the study period. The effect of change in medical diagnoses on change in functional status over the entire follow-up period was nonsignificant (MLE=0.22, SE=0.23, t=0.93, df=123, p=0.35), and there were no associations between baseline medical problems or change in medical problems and change in functional status at the first reassessment. This finding indicated that, once negative symptoms and cognitive functions are accounted for, an increase in the number of medical diagnoses does not contribute to change in functional status across the study period.
In the otherwise identical model where positive symptoms were substituted for negative symptoms, none of the relationships were significant. That is, there was no significant impact of baseline or change scores for positive symptoms on increase in medical diagnoses or functional status. Similarly, the effect of increase in medical diagnoses on change in functional status was not significant after the analysis accounted for positive symptoms.


