The basal ganglia comprise a heterogeneous brain region, both anatomically and functionally, that includes the striatum, as well as the nucleus accumbens and globus pallidum. The principal anatomical component of the basal ganglia is the striatum, which is differentiated into the caudate nucleus and putamen regions. A number of authors have suggested a more detailed functional subdivision of the striatum
(12–
17). For example, Parent and Hazrati
(17) proposed a tripartite anatofunctional subdivision of the striatum (caudate and putamen) into motor, associative, and limbic regions. On the basis of a diffusion tensor imaging investigation of fiber tract projections, Lehericy et al.
(18) suggested a functional subdivision of the human striatum into anterior (associative), posterior (sensorimotor), and ventral (limbic) components.
Conventional volumetric measurement approaches are not sensitive enough to reliably detect subtle volume changes in functional subdivisions of the striatum that are hypothesized to be altered in bipolar disorder. In contrast, shape analysis techniques can potentially detect subtle group differences in shape where there are no volume differences
(19). Spherical harmonic (SPHARM) description is a relatively new shape analysis technique that can detect subtle structural alterations in small structures of the brain
(20). SPHARM description is an efficient parameterization method with transformation invariance, noise robustness, and uniqueness. Characterization, classification, recognition, and segmentation by means of SPHARM descriptors have been used to characterize subtle shape characteristics in magnetic resonance imaging (MRI) analyses of many subcortical brain regions
(21,
22).
In the current study, we hypothesized that drug-naive patients with bipolar disorder, relative to healthy comparison subjects, would exhibit characteristic shape differences in the associative and limbic regions of the striatum that are implicated in bipolar disorder. On the basis of earlier reports suggesting lateralized neuroanatomical abnormalities in bipolar disorder
(1,
2), we further hypothesized that these shape differences would be more prominent on the right side. We additionally hypothesized that the pattern of striatal shape differences in drug-naive bipolar disorder patients would be different from that observed in drug-treated bipolar disorder patients. This hypothesis was supported by earlier reports of anatomical, functional, and metabolic effects of psychotropic medications on the caudate nuclei
(23–
25). Using a large MRI data set acquired from symptomatic drug-naive bipolar disorder patients, drug-treated bipolar disorder patients, and healthy comparison subjects, we applied the SPHARM technique and conventional volumetric analysis to compare the shape and volume of caudate heads and putamen between groups.
Method
Subjects
Inclusion criteria for the bipolar disorder patients were 1) an age range of 18–55 years and 2) a DSM-IV diagnosis of bipolar I disorder or bipolar II disorder, as determined by a DSM-IV-based structured clinical interview administered by an experienced psychiatrist
(26). Exclusion criteria were 1) any other current or lifetime comorbid axis I disorder, substance abuse within the last 3 months, or axis II antisocial personality disorder; 2) current or past history of any significant medical or neurological illnesses; 3) history of head trauma, seizure, learning disorder, or attention deficit hyperactivity disorder; and 4) contraindications to MR scanning (metallic implants, pacemaker, pregnancy, or claustrophobia).
Forty-nine bipolar disorder patients were recruited through the Psychopharmacology Research Laboratory at McLean Hospital, the Bipolar Disorders Research Unit at Massachusetts General Hospital, and the Center for Anxiety and Depression at the University of Washington. Twenty-one of the 49 patients were drug naive, and 28 were taking medication and were stable (
Table 1). Thirty-seven healthy comparison subjects were similarly evaluated and found to be free of DSM-IV axis I diagnoses and a family history of major depression or bipolar disorder in first-degree relatives.
The consent form and the research protocol were approved by the respective university and/or hospital institutional review boards. All subjects reviewed the consent form and gave written informed consent in the presence of a study physician before participation in the study.
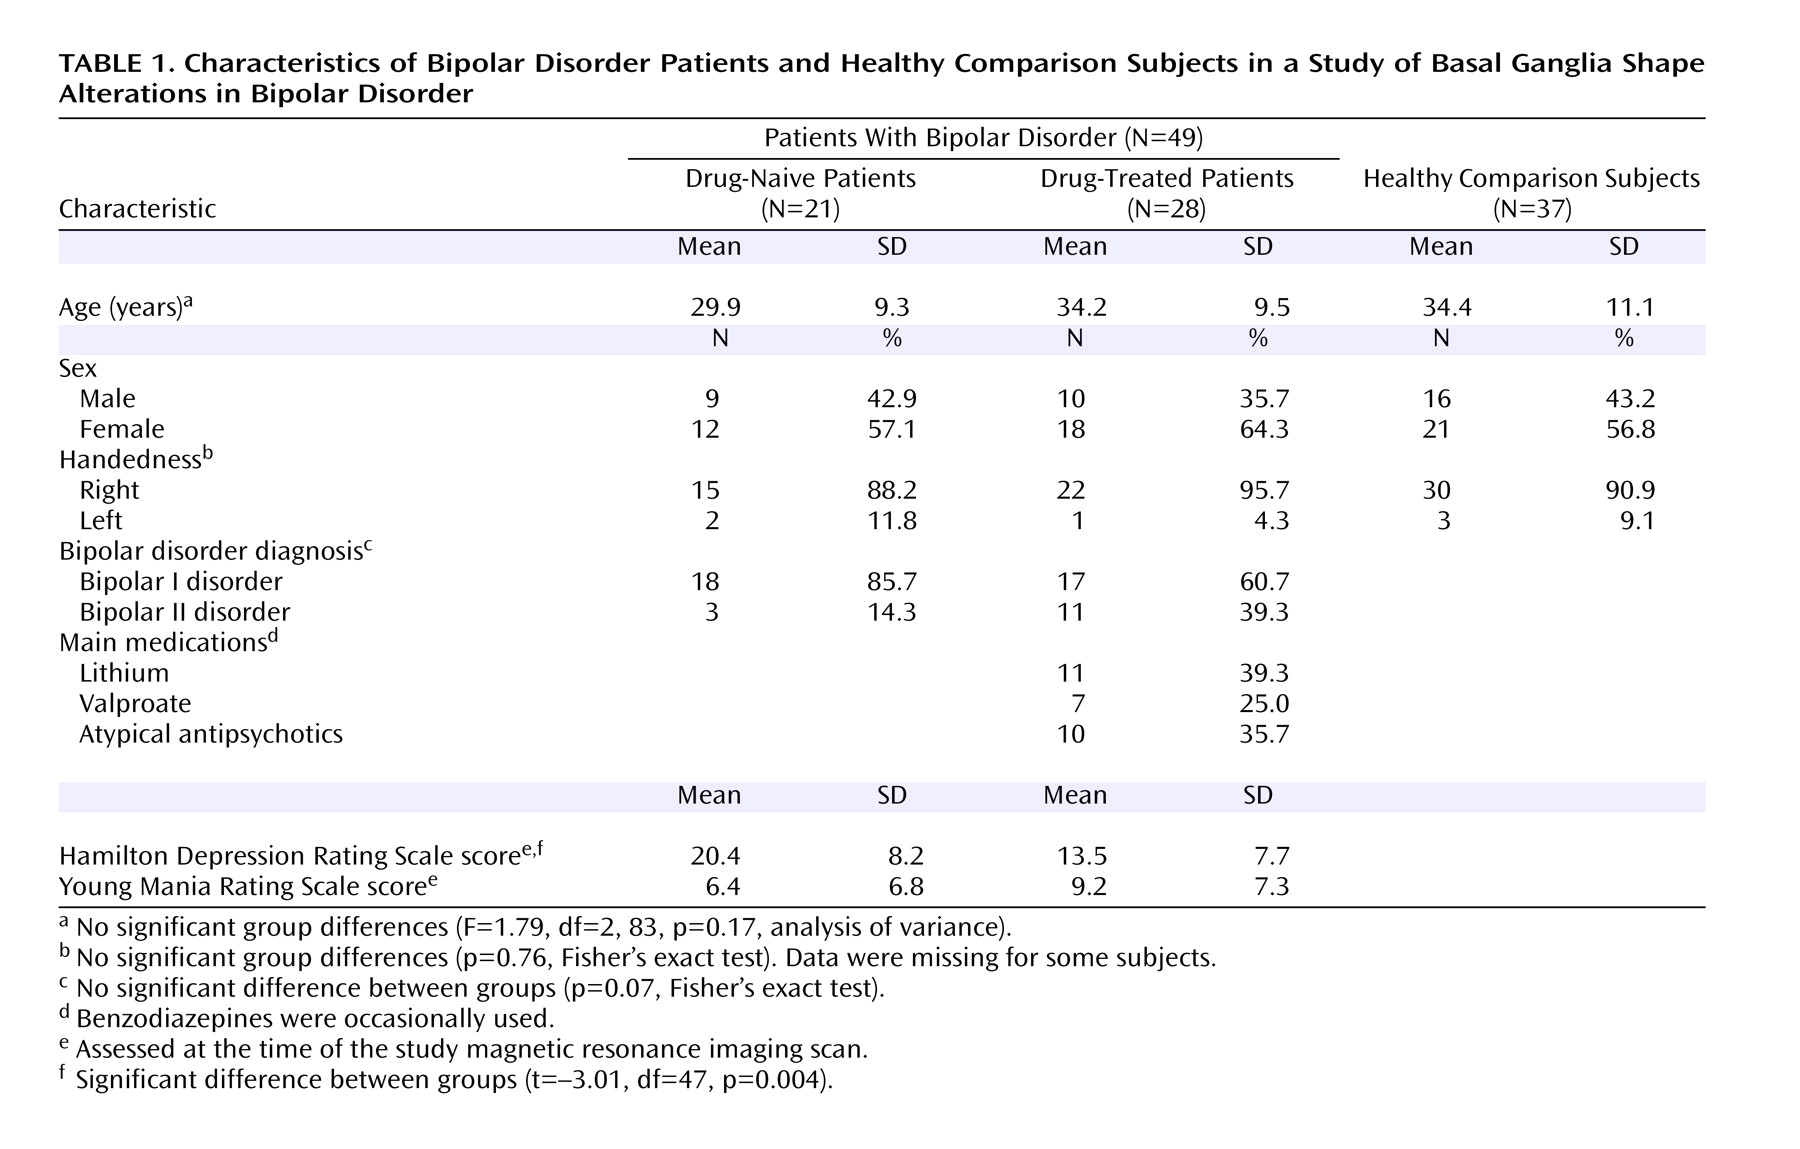
The demographic and clinical characteristics of the study subjects are presented in
Table 1. No significant differences in age, sex composition, and handedness were found between the study groups. The primary psychotropic medications taken by the drug-treated bipolar disorder patients were lithium (N=11, 39.3%), valproate (N=7, 25.0%), and atypical antipsychotics (N=10, 35.7%).
MR Image Acquisition
Brain MR images were acquired with a 1.5-T whole-body imaging system (Signa Horizon EchoSpeed, General Electric Medical Systems, Milwaukee) and a custom-made linear birdcage coil with approximately 40% improvement in signal-to-noise ratio and improved homogeneity over standard quadrature head coil (C. Hayes, personal communication, 1996). Identical scanners, custom-built linear head coils, and imaging acquisition parameters were used at both scanning sites
(26). To assess comparability across scanners, we scanned identical phantoms and the principal investigators on both scanners at regular intervals during the period of data acquisition (3 years). These data were stable and comparable over this time period.
A three-dimensional spoiled gradient echo pulse sequence was used to produce 124 1.5-mm-thick contiguous coronal images (TE=5 msec, TR=35 msec, 256×192 matrix, field of view=24 cm, flip angle=45°, number of excitations=1). Axial-proton-density-weighted and T2-weighted images (TE=30/80 msec, TR=3000 msec, 256×192 matrix, field of view=24 cm, flip angle=45°, number of excitations=0.5, 3-mm-thick slices, no skip) were obtained to screen for brain structural abnormalities.
Segmentation of Striatum
All acquired spoiled gradient-recall acquisition volumes were realigned so that the anterior-posterior axis of the brain was parallel to the intercommissural line and the other two axes were aligned along the interhemispheric fissure. T1 images of the caudate heads and putamen were segmented manually by using the guidelines of the Iowa Mental Health Clinical Research Center (http://iowa-mhcrc.psychiatry.uiowa.edu/mhcrc/IPLpages/altTracing.htm). These procedures were performed with Analyze 5.0 image visualization and processing software (Biomedical Imaging Resource, Mayo Clinic, Rochester, Minn. [(http://www.mayo.edu/bir]).
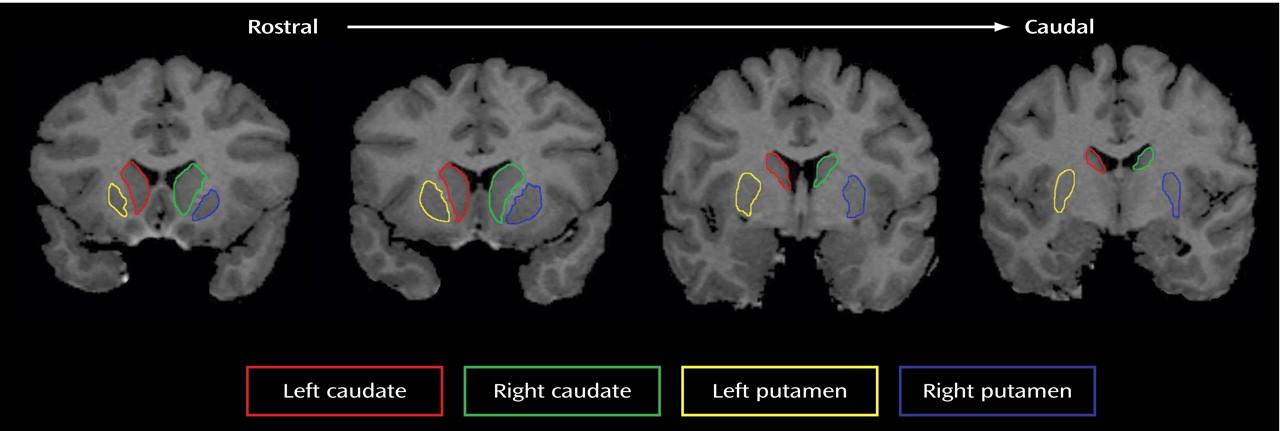
Figure 1 shows the demarcation of the striatal structures. Anatomical demarcation of the caudates was as follows: 1) Segmentation of the caudates started at a coronal plane where the anterior horns of the lateral ventricles are first visualized and ended at a plane where the colliculi disappear. If the terminus of the caudates could not be clearly visualized before the point where the colliculi disappeared, this point was defined as the posterior boundary. 2) The ventral boundary was the nucleus accumbens, which forms a bridge of tissue between the caudate and the lenticular nucleus, first visualized with the appearance of the putamen. 3) The internal capsule constituted the lateral boundary. 4) The medial boundary was formed by the lateral ventricle
(27–
30).
Anatomical demarcation of the putamen was as follows: 1) The rostral section of the putamen that could be visualized at the ventrolateral surface of the caudate constituted the rostral boundary that typically began within two or three slices after the caudate was first visualized. Although the putamen bordered on the caudate, signal intensities of these two structures differed sufficiently to allow separation. The rostral boundary was then followed caudally to 2) the medial boundary formed by the internal capsule and 3) the lateral boundary defined by the white matter intercalated between the putamen and claustrum. 4) The tracing of the putamen was continued caudally until it could no longer be clearly visualized, usually four or five slices before the caudate terminated
(27–
30).
Volumetric measurements of segmented regions were carried out by using Analyze 5.0. To establish measurement reliability for manual segmentation, two experienced raters (J.H., S.J.K.), who were blind to the subjects’ demographic and clinical characteristics, independently performed regional segmentations using the same subset of MR studies (N=25). Intrarater reliability was tested by one rater (S.J.K.), who unknowingly measured the same subset of MR studies (N=25) over a 1-week interval. Interrater reliability (assessed with intraclass correlation coefficients) was 0.84 for the left caudate, 0.88 for the right caudate, 0.93 for the left putamen, and 0.95 for the right putamen. Intrarater reliability was 0.89 for the left caudate, 0.93 for the right caudate, 0.92 for the right putamen, and 0.94 for the left putamen.
Statistical Analysis
To evaluate for the differences between the study groups, independent t tests, analysis of variance (ANOVA), and analysis of covariance (ANCOVA) with Tukey post hoc tests were performed. To avoid multiple comparison issues, repeated-measures ANCOVA was used to test for differences in the four striatal structures (left and right caudate heads, left and right putamen) between groups.
Between-group comparisons involving categorical data were assessed using Fisher’s exact test for two-by-k table, where k reflects the categorical variables. Statistical significance was defined at an alpha level less than 0.05 in two-tailed tests. All analyses were performed with Statistica 6 for Windows (StatSoft, Tulsa, Okla.).
Shape Analysis Procedures
Parameterization of object surfaces
The surfaces of the regions of interest were extracted by using the Marching Cube algorithm to make polygons from manually segmented data
(31). For multiple subject comparisons, we performed an appropriate transformation using first-order SPHARM in the region-of-interest space to make the region of interest independent of translation, rotation, and scale
(21). In a parameterization stage, through which a polygonized surface is mapped onto a sphere, we used a simple alternative heuristic approach modified from the work of Sijbers et al.
(20). The vertices were deformed toward the surface of a sphere depending on the distance from the vertex to the center of the target sphere
(20,
21). In every iteration, we performed area equalization to ensure the area equality of every polygonal facet. This polygonized surface consisted of parameterized vertices on the unit sphere (20).
SPHARM-based description and comparison between multiple subjects
The SPHARM description was used for shape modeling. This procedure is a Fourier analysis in the spherical domain that is closely associated with Legendre polynomials. The order of spherical harmonics was set as 25, an order number that was fine enough for description of the shapes of the putamen and caudate heads and was also appropriate in the sense of allowing tractable calculations. The least squares fitting was used for fitting the coefficients of spherical harmonic descriptors. To construct corresponding vertices of each region of interest for comparison between multiple subjects, we conducted the resampling of a sphere into polyhedra, as generally used in the point distribution model, where the number of vertices of the polyhedra was 4,181.
Visualization modeling and statistical analysis
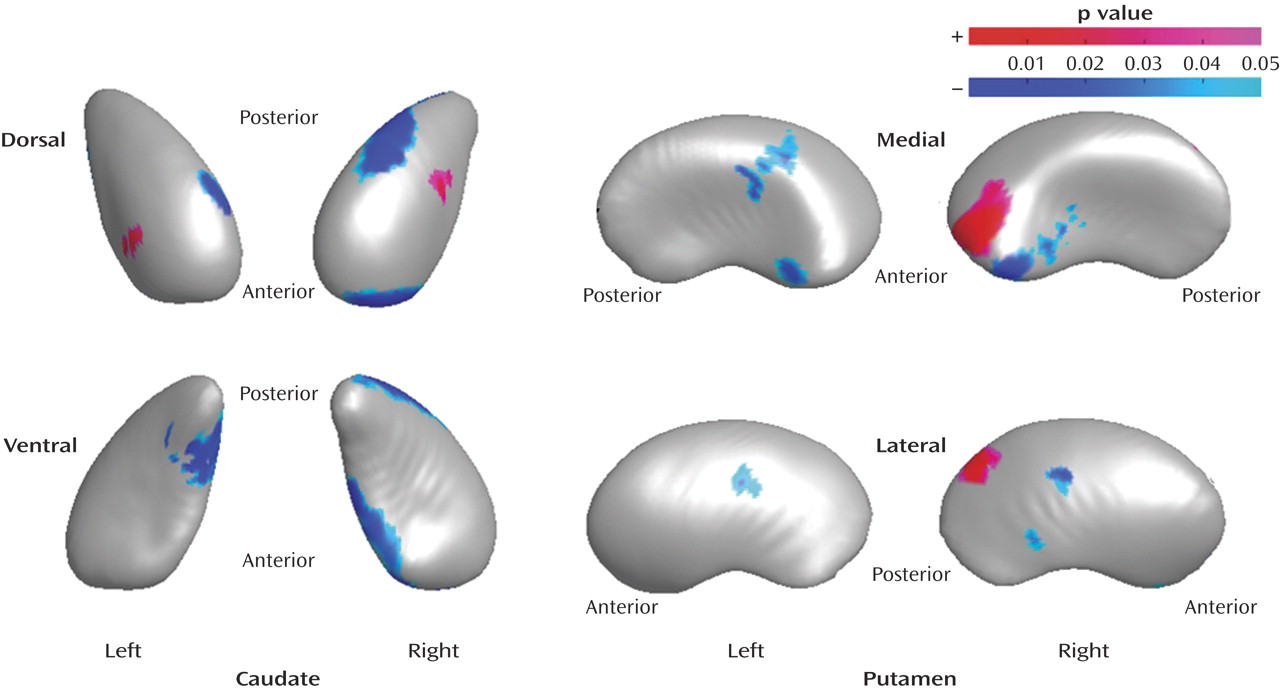
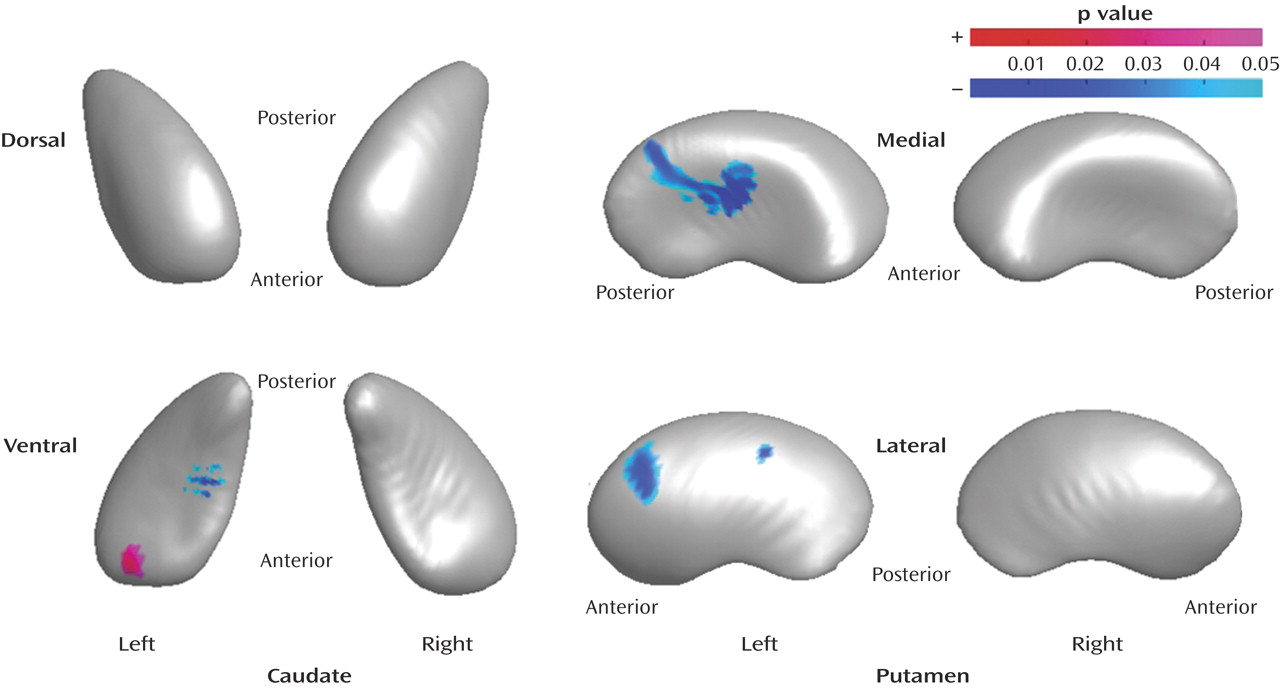
Individual shapes of the putamen and caudate heads were produced by the SPHARM-by-coefficients matrix, and the mean shape of the putamen and caudate heads was formed by the SPHARM-by-averaged coefficients matrix. The volumes of the caudate and putamen of each subject were normalized. Consequently, we could extract a radius from each corresponding vertex of the putamen and caudate heads. The radius reflects the distance from the center of vertices to the vertex of interest. Following these transformations, t values were generated for statistical analysis by using radius differences between groups. Statistical significance was defined based on an alpha level less than 0.05 and clustered vertex points of no less than 15. The regions of significant shape differences in the drug-naive bipolar disorder group were visualized in relationship to the mean shape of the caudate or putamen in the healthy comparison group (
Figure 2 and
Figure 3) or the drug-treated bipolar disorder group (
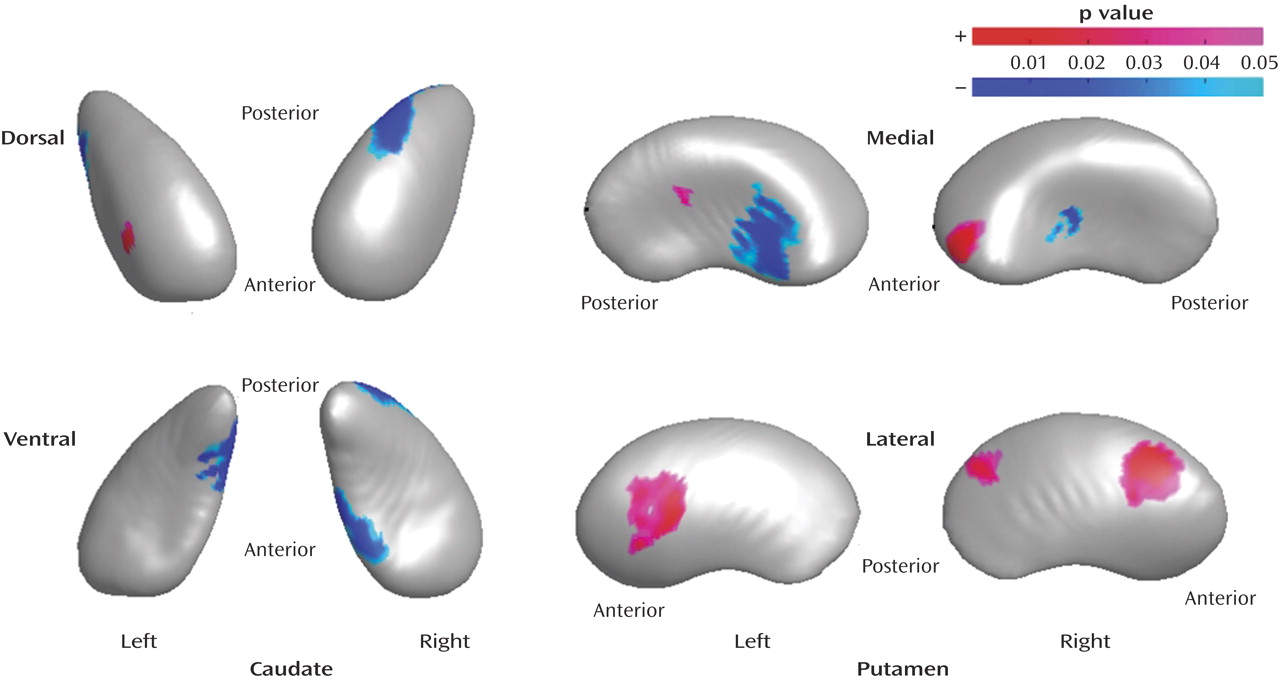
Figure 4).
The number of vertex points with significant differences between the groups was also assessed. The proportions of the points (increased or decreased radius) on the surface between the left and right sides of each structure were compared in order to characterize the laterality of shape differences.
Results
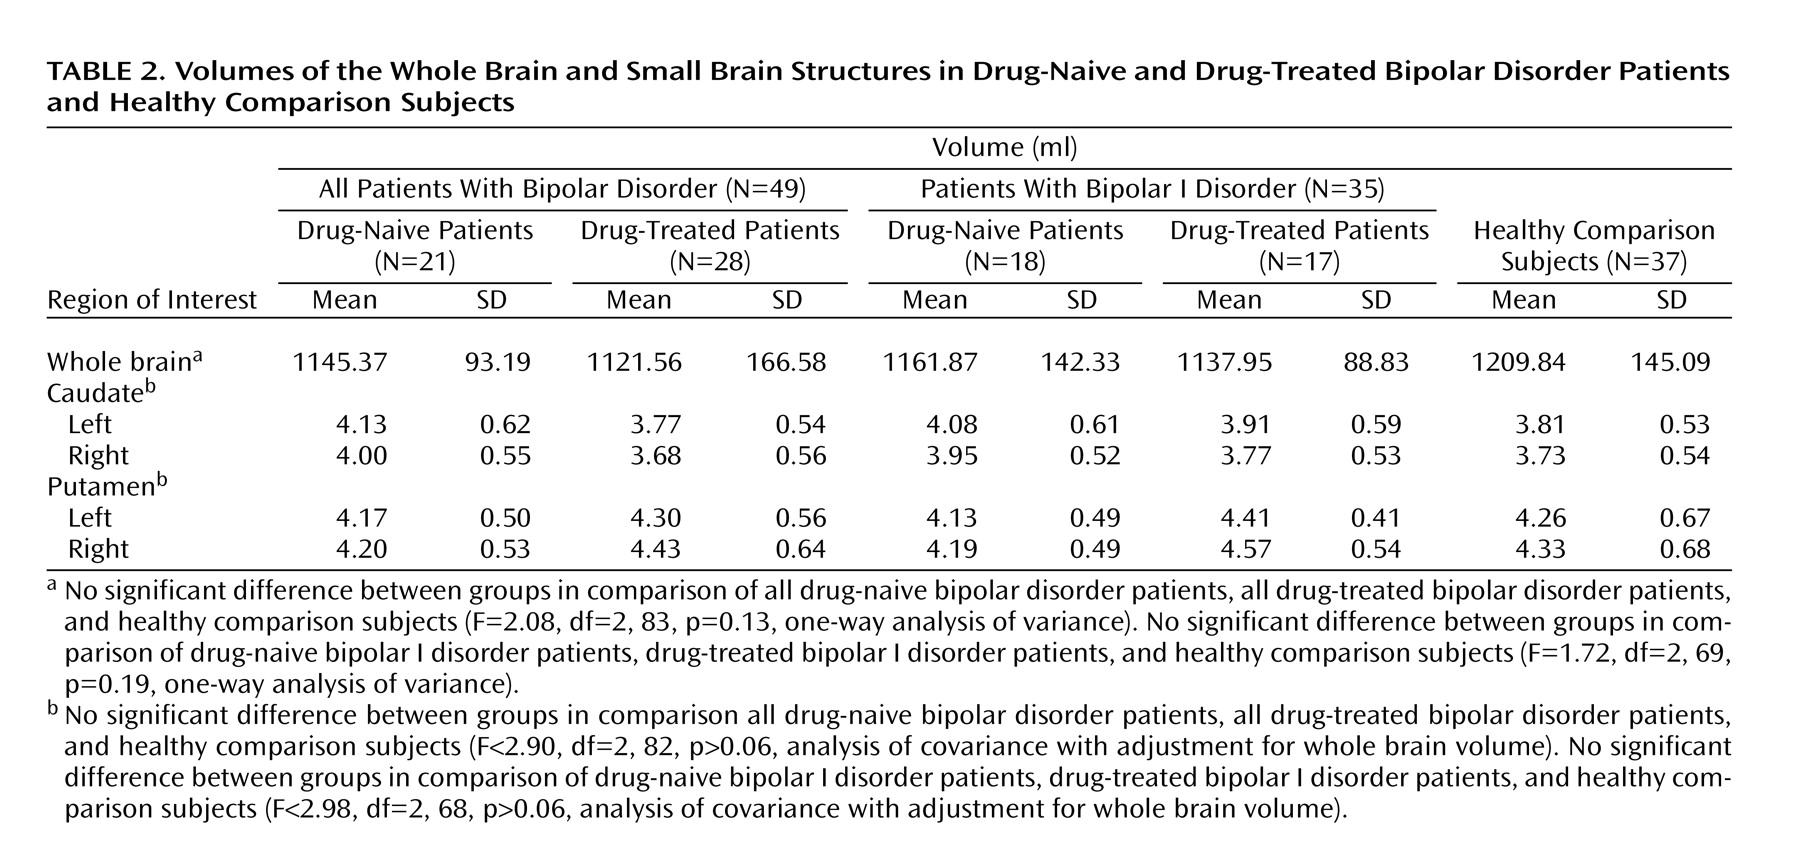
The results of the volumetric analyses are presented in
Table 2. No significant differences between groups were found for whole brain volumes. Striatal volume differences did not reach significance between groups for the left and right caudate volumes or for the left and right putamen volumes adjusted for whole brain volume (
Table 2).
When the patients with bipolar I disorder and those with bipolar II disorder, not differentiated by medication status, were compared to the healthy comparison group, significant differences in whole brain volume were observed. However, the volumes of the individual striatal structures were not significantly different between groups after adjustment for whole brain volume (all F<2.90, df=2, 82, all p>0.06, ANCOVA).
On the basis of observed brain volume differences in the bipolar I disorder group, we repeated the three-group comparison, differentiating bipolar disorder patients on the basis of medication status and including only those patients with a diagnosis of bipolar I disorder (i.e., drug-treated bipolar I disorder patients versus drug-naive bipolar I disorder patients versus healthy comparison subjects). This comparison was done because the difference in distributions of the bipolar disorder subtypes in the drug-treated and drug-naive groups, although not statistically significant, might have confounded the results. Again, no significant differences were observed between the drug-naive bipolar I disorder subjects (N=18), the drug-treated bipolar I disorder subjects (N=17), and healthy comparison subjects (N=37) in whole brain volume or striatal volumes (
Table 2).
As shown in
Figure 2,
Figure 3, and
Figure 4, regional shape differences were found between the drug-naive bipolar disorder group and the healthy comparison group, between the drug-treated bipolar disorder group and the healthy comparison group, and between the drug-naive bipolar disorder group and the drug-treated bipolar disorder group.
Shape Differences in Drug-Naive Bipolar Disorder Patients
In the right caudate in the drug-naive bipolar disorder group, compared to the healthy subjects, regions with significantly decreased radii were found on both the posterodorsal and anteroventral surfaces (11.2 and 9.4% decreases, respectively) and increased radii were found on the dorsal surface (8.3% increase). In the left caudate in the drug-naive bipolar disorder group, relative to the healthy subjects, significantly increased radii were found on the anterodorsal surface (4.8% increase) and significantly decreased radii were found on both the anterodorsal and posteroventral surfaces (6.3% and 11.7% decreases, respectively). In the right putamen in the drug-naive bipolar disorder group, relative to the healthy subjects, significant shape differences were found for anteromedial (3.4% increase) and posterolateral (4.0% increase) surface radii and for anteromedial and lateral surface radii (6.5% and 4.0% decreases, respectively). In the left putamen, the drug-naive bipolar disorder group had regions of significant shape differences, relative to the healthy subjects, for the ventrolateral and dorsomedial surface radii (7.3% and 3.8% decreases, respectively).
Shape Differences in Drug-Treated Bipolar Disorder Patients
In the right caudate, no significant shape differences were observed between the drug-treated bipolar disorder group and the healthy comparison group. In the left caudate, the drug-treated bipolar disorder group, relative to the healthy subjects, had significant shape differences in the anteroventral surface (5.6% increase). Regions of decreased radius (8.8% decrease) were observed for the posteroventral surface in the drug-treated bipolar disorder group, compared to the healthy subjects. In the right putamen, no significant shape differences between groups were found. In the left putamen, significant shape differences were observed in the drug-treated bipolar disorder group, relative to the healthy subjects, for the medial surface (one region had a decrease in radii of 10.3%) and the lateral surface (two regions had decreases in radii of 3.2% and 2.8%, respectively).
Shape Differences in Drug-Naive Bipolar Disorder Subjects Compared to Drug-Treated Bipolar Disorder Subjects
The shape differences that were observed between the drug-naive and drug-treated patients with bipolar disorder were similar to those observed between the drug-naive bipolar disorder patients and the healthy comparison subjects.
In the right caudate, regions of decreased radii were found on the posterodorsal and anteroventral surfaces (12.9% and 11.0%, respectively) in the drug-naive patients, relative to the drug-treated patients. In the left caudate, shape differences in the drug-naive group, relative to the treated group, were found on both anterodorsal and posteroventral surfaces (radii increased by 4.9% and decreased by 10.4%, respectively). In the right putamen, shape differences in the drug-naive group, relative to the treated group, were found for the medial surface regions, varying from 3.3% increases to 10.6% decreases in radii, and for two regions of the lateral surface, where radii were increased by 4.3%. In the left putamen, shape differences in the drug-naive group, relative to the treated group, were found on the both the medial (radii increased by 3.3%) and lateral surfaces (5.5% increase in radii in one region and 8.9% decrease in another region).
Other Shape Analyses
Additional exploratory shape analyses were conducted to assess 1) the potential confounding effect of the different proportions of bipolar I disorder versus bipolar II disorder subjects in the drug-naive and drug-treated groups, 2) the effect of handedness, 3) the influence of medications, and 4) differences between subjects with bipolar I disorder and those with bipolar II disorder. The findings are briefly described in Data Supplement 1, which is available with the online version of this article at http://ajp.psychiatryonline.org. Detailed information about the analyses is available on request from the first author.
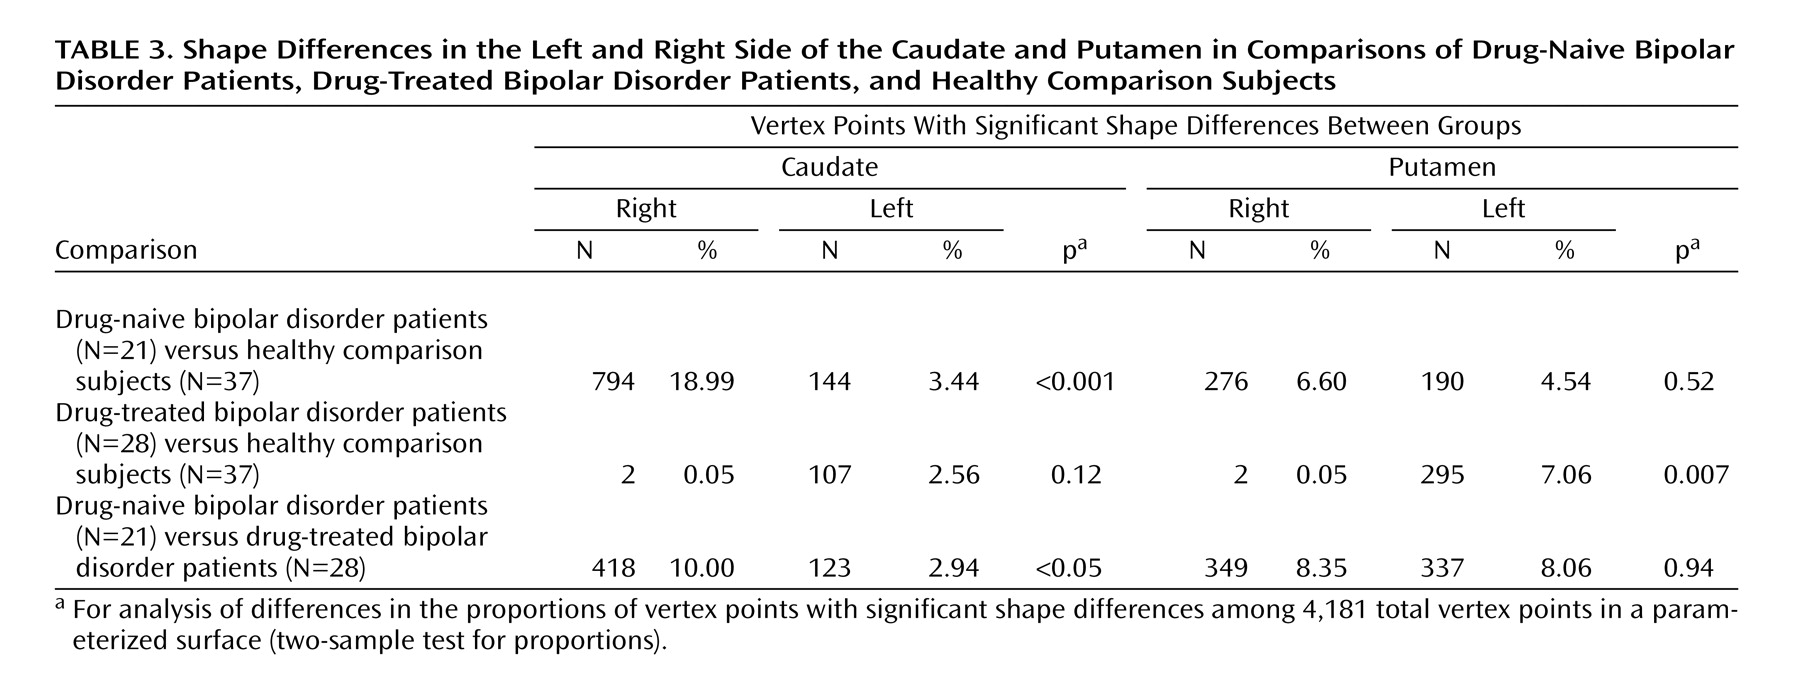
Another index of shape differences that also provides an indication of lateralization is comparison of the number of right and left caudate or putamen vertex points with significant shape differences between the groups. These results, presented in
Table 3, indicate that the drug-naive bipolar disorder group, compared to the healthy group and to the drug-treated bipolar disorder group, had a higher proportion and rate of caudate shape differences on the right side relative to the left side (p<0.001 and p<0.05, respectively, two-sample test for proportions). In addition, the drug-treated bipolar disorder patients, compared to the healthy comparison subjects, had a lower proportion and rate of putamen shape differences on the right side relative to the left side (p=0.007, two-sample test for proportions).
Discussion
To our knowledge, this is the first study to report shape alterations of the right striatum in drug-naive subjects with bipolar disorder. Shape analysis had greater sensitivity than conventional region-of-interest volumetric methods in detecting subtle anatomical differences in these small brain structures. The inconsistent findings for striatal abnormalities in bipolar disorder reported in previous studies with conventional volumetric methods may, in part, reflect power limitations related to factors of measurement sensitivity and reliability
(32,
33). Because changes in striatal shape may occur without detectable changes in overall volume, and vice versa, shape analysis can provide a complementary approach to volumetric methods in the systematic evaluation of regional structural abnormalities of the striatum associated with specific psychiatric disorders, such as bipolar disorder.
Although we found between-group differences in some striatal volumes when the results were adjusted for whole brain volumes, these differences did not reach significance. Previous volumetric studies of the basal ganglia in bipolar disorder have produced inconsistent findings
(1,
4,
8,
10,
34) that may have been influenced by the effects of sample sizes and differences in the demographic and clinical characteristics of the study populations. For example, in prior studies, the bipolar disorder groups have consisted of solely drug-treated subjects
(4,
8,
11), subjects with inconsistent treatment histories and various symptom severities and presentations
(10), and subjects with substantial comorbidity
(11). As further discussed later in this section, our findings suggest that drug treatment status is an important factor in assessing striatal differences in this population.
We did not find significant differences in basal ganglia volumes between drug-naive bipolar disorder patients (N=21) and healthy comparison subjects (N=37). In contrast, Strakowski et al.
(3) reported enlargement of the putamen in first-episode bipolar disorder patients, most of whom were drug naive (N=18), compared to healthy volunteers (N=32). This difference in findings may reflect differences in the clinical characteristics of the bipolar disorder groups. In the study by Strakowski et al.
(3), the patients were predominantly bipolar I disorder patients who were admitted for a first episode of mania, whereas our study included both patients with bipolar I disorder and patients with bipolar II disorder who were predominantly depressed. Also, the patients in our study were older (by approximately 10 years) than the patients in the study by Strakowski et al.
We observed two major shape differences in the bipolar disorder patients, relative to the healthy comparison subjects. First, we found striatal shape differences primarily in the drug-naive bipolar disorder patients, particularly on the right side, compared to the healthy subjects and the drug-treated bipolar disorder patients. The right hemisphere is known to process and operate on nonverbal material and intrinsic functions, whereas the left hemisphere mainly mediates language-related functions. In bipolar disorder patients, performance IQ has been reported to be lower than verbal IQ, and nonverbal, visuospatial, and abstraction abilities have been found to be more severely affected than verbal skills; these differences suggest right or nondominant hemisphere dysfunction
(35). In addition, a recent meta-analysis of brain volumetric studies in bipolar disorder reported that right-sided ventricle enlargement was one of the most consistent findings
(36).
Second, this pattern of shape differences in drug-naive bipolar disorder patients, relative to healthy comparison subjects, was not observed in the drug-treated bipolar disorder patients. Chakos et al.
(23) reported that subjects with first-episode schizophrenia taking antipsychotics had larger caudate volumes after longitudinal follow-up over 18 months. Normalization of caudate glutamatergic concentration after paroxetine treatment in pediatric obsessive-compulsive disorder patients was also reported
(24). In bipolar disorder, Yatham et al.
(25) found that caudate presynaptic dopamine function decreased after divalproex sodium treatment. In addition, Manji et al.
(37) reported that lithium treatment might have neuroprotective effects in mood disorder. Despite the limitations of the current study, which include the cross-sectional design and the heterogeneous characteristics of medications prescribed for the drug-treated patients, our results suggest that the caudate and putamen shape abnormalities observed in the bipolar disorder patients may be modulated with treatment. Further work evaluating longitudinal shape changes in drug-naive subjects who begin taking medication will help address this consideration.
Lehericy et al.
(18) recently studied corticostriatal circuits in humans by using a diffusion tensor imaging axonal mapping technique. They observed that the associative compartment of the striatum (anterior striatum) was connected to the prefrontal cortex, frontal pole, and presupplementary motor area. In addition, the limbic compartment of the striatum (ventral striatum) was connected to the orbitomedial frontal cortex and temporal lobe. The sensorimotor compartment of the putamen (the posterior part of putamen) was connected to primary sensory and motor areas and to the posterior part of the supplementary motor area. These findings are generally in accord with the results of previous anatomical studies on corticostriatal circuits in nonhuman primates
(13,
38,
39).
Consequently, subcortical regions with shape differences in our study may be associated with a specific cerebral region, for example, the frontal and limbic areas. In the current study, shape differences in the anterior part of both caudates and the anterior part of the right and left putamen were observed in drug-naive bipolar disorder subjects, relative to healthy comparison subjects and drug-treated bipolar disorder subjects. These striatal regions, which predominantly constitute the associative territory of the striatum
(18), may be related to the cognitive impairment found in bipolar disorder; this impairment includes executive dysfunction, attention deficit, visuospatial dysfunction, and slowed information processing and has been shown to be closely related to dysfunction of the frontal lobes and basal ganglia
(40).
Levitt et al.
(41) reported that the surface-to-volume ratio of the caudate head was increased and lateralized to the right side in neuroleptic-naive patients with schizophrenia spectrum disorders and that greater surface-to-volume ratio of the caudate head was inversely correlated with decreased neuropsychological performance. These findings suggest that cognitive abnormalities might be related to shape differences of the caudate head. Thus, in bipolar disorder, there may be a relatively subtle prefrontal modulation of the subcortical anatomy, which may, in turn, produce the characteristic cognitive impairments
(34).
We also observed that the ventral caudate was “shrunken” in drug-naive bipolar patients, relative to healthy comparison subjects and drug-treated bipolar disorder patients. Several functional imaging studies have provided evidence for abnormalities in the limbic-striatal-pallidal-thalamic circuits in bipolar disorder
(42). The ventral putamen is included in the limbic territory of the striatum that is connected to the orbitomedial frontal cortex
(18). This ventral putamen territory processes emotional or motivational information, and “shrinkage” of this area could occur in association with mood abnormalities
(17). According to conventional volumetric analyses, volume reduction for a specific structure has been considered to signify loss of its function. Thus, deflated or shrunken surface regions might implicate areas of discrete functional deficits, and inflated surface regions may potentially reflect pathological or compensatory processes.
This study has several limitations, including the small number of subjects, which limits the generalization of the findings, and the limited resolution of the MR images at the 1.5-T MR scanner field strength. In addition, as a result of the multiple comparisons, identification of increased or decreased radii in small regions may represent type I error. Also, the bipolar disorder group in our study was heterogeneous and included both bipolar I disorder patients and bipolar II disorder patients who were differentially distributed across the drug-naive and drug-treated groups. However, the results of additional shape analyses that focused on the bipolar I disorder subgroup demonstrated a similar direction to the results obtained for the entire bipolar disorder group, suggesting that diagnostic heterogeneity was not a substantial confounding factor. Finally, the drug-treated patients were taking a variety of medications, and thus our ability to assess effects of treatment on the modulation of basal ganglia shape abnormalities in bipolar disorder was limited.
In the absence of consistent striatal volume differences in prior imaging studies of bipolar disorder, shape analysis may provide a sensitive method that better characterizes subtle brain anatomical relationships in bipolar disorder. In this study, despite similar volumes across the study groups, subtle right-sided shape differences in the caudate head and putamen were demonstrated in drug-naive bipolar disorder subjects. In contrast, stable bipolar disorder subjects who were taking medication had less dramatic differences, suggesting potential medication effects. Future work with higher field strength scanners that provide greater anatomical resolution, as well as efforts to combine more sensitive structural analytic techniques with the complementary modalities of MR spectroscopic imaging and diffusion tensor imaging, will be helpful in extending these results.