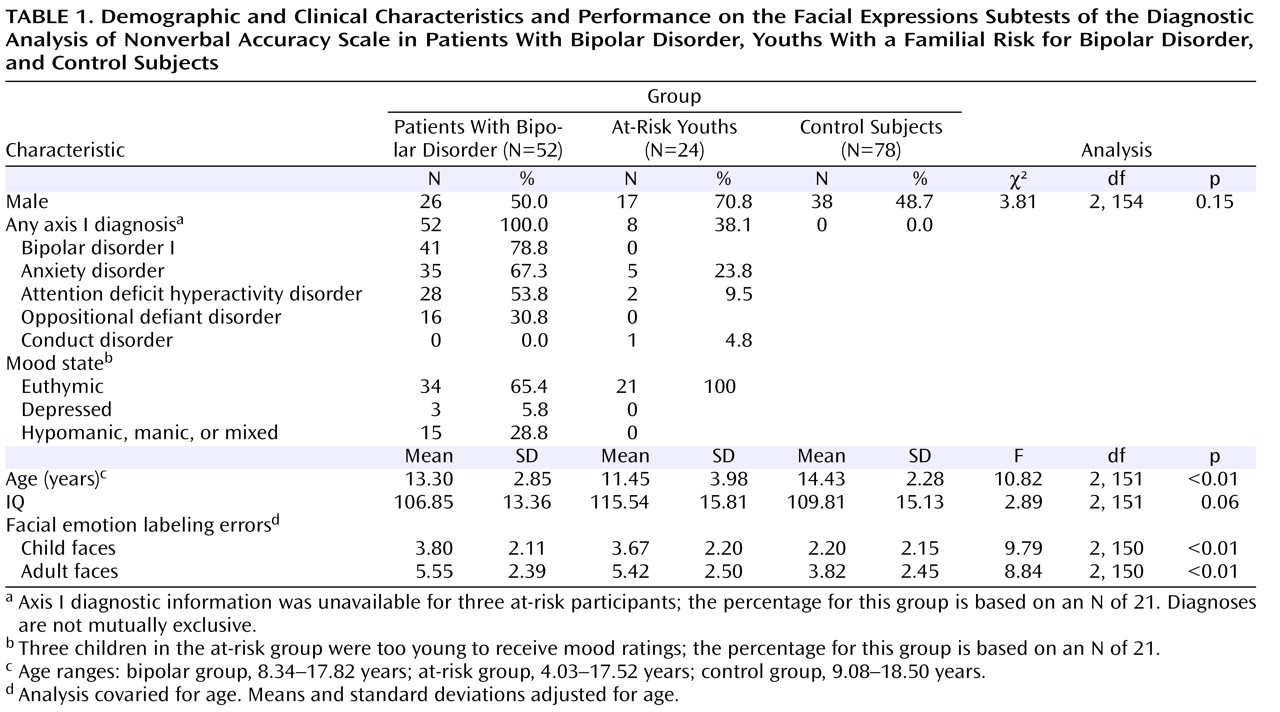
The groups differed significantly in age, but not in IQ or gender (
Table 1 ). Eight at-risk children had current or past anxiety disorders, ADHD, or conduct disorder. Most bipolar patients (78.8%) had bipolar I disorder, and the majority (90.4%) had a comorbid diagnosis. The most common comorbid diagnoses were anxiety disorders, ADHD, and oppositional defiant disorder. In the bipolar group, 41 participants (78.8%) were medicated with a mean of 3.1 medications (SD=1.3), including anticonvulsants (75.6%), atypical antipsychotics (70.7%), lithium (39.0%), antidepressants (34.1%), stimulants (29.3%), and anxiolytics (9.8%). All at-risk youths were medication free. Euthymia, defined as having a Children’s Depression Rating Scale score <40 and a Young Mania Rating Scale score ≤12, was seen in 65.4% of the bipolar patients (for all bipolar patients, mean Children’s Depression Rating Scale score=27.1 [SD=9.0] and mean Young Mania Rating Scale score=9.6 [SD=7.3]) and in all of the at-risk youths (mean Children’s Depression Rating Scale score=21.2 [SD=3.0] and mean Young Mania Rating Scale score=4.0 [SD=3.7]).
Diagnostic Analysis of Nonverbal Accuracy Scale Facial Expressions Subtests
ANCOVA revealed a group difference in emotion labeling errors in both the child and adult subtests (
Table 1 ). Bonferroni-corrected post hoc analyses showed that bipolar and at-risk youths made more errors than control subjects on both child and adult faces (bipolar group: child faces, Cohen’s d=0.75; adult faces, d=0.71; p values ≤0.01; at-risk group: child faces, d=0.68; adult faces, d=0.65; p values ≤0.02). However, the bipolar and at-risk groups did not differ from each other (child faces, d=0.06; adult faces, d=0.05; p values=1.0). Repeating this analysis with both age and IQ included as covariates yielded the same results, with differences in emotion labeling errors on both child and adult faces (adult faces: F=10.12, df=2, 149, p≤0.01; adult faces: F=8.53, df=2, 149, p≤0.01). For errors on both child and adult faces, Bonferroni-corrected post hoc analyses showed that bipolar and at-risk youths made more errors than control subjects (p values ≤0.02) but did not differ from each other.
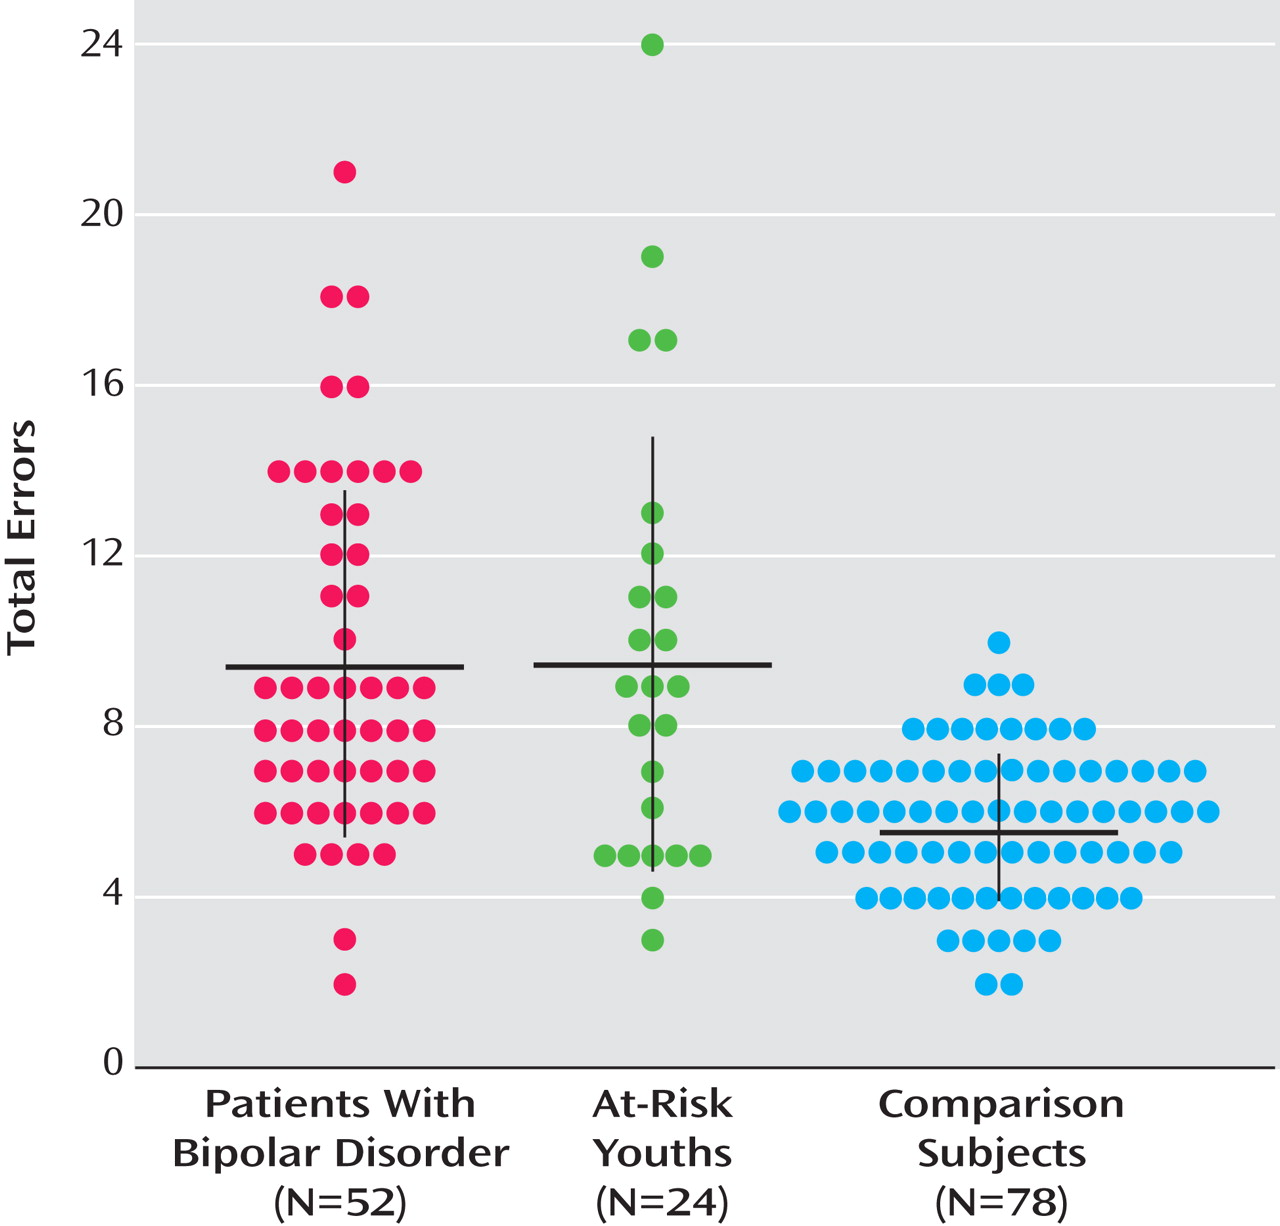
Figure 1 summarizes the total number of errors (i.e., child plus adult faces) in facial emotion identification by group. In total number of errors, 88.5% of the bipolar group and 70.8% of the at-risk group were above the mean of the control group.
To confirm that age differences did not account for the findings, we compared subgroups matched for age (bipolar group: N=38, mean age=12.09 years [SD=2.31]; at-risk group: N=22, mean age=12.10 years [SD=3.48]; control group: N=50, mean age=13.21 years [SD=1.89]). The results mirrored those of the larger groups; between-group differences were observed in the numbers of errors for both child and adult faces (child faces: F=8.49, df=2, 107, p≤0.01; adult faces: F=10.59, df=2, 107, p≤0.01). Bonferroni-corrected post hoc analyses revealed that the bipolar and at-risk groups differed in numbers of errors on each subtest from the control group (p values ≤0.01 and ≤0.05, respectively) but not from each other.
As part of our secondary analyses, we performed a linear mixed model on the larger data set that included multiple biologically related siblings. In this analysis, family was included as a random factor and age as a covariate. Results were identical to those in the primary analyses. Again, there were between-group differences in the numbers of errors for both child and adult faces (child faces: F=8.04, df=2, 165.06, p≤0.01; adult faces F=8.22, df=2, 173, p≤0.01). Bonferroni-corrected post hoc analyses revealed that the bipolar and at-risk groups differed in number of errors on each subtest from the control group (p values ≤0.01 and ≤0.02, respectively) but not from each other. These analyses were considered secondary because the family variable was collinear with the between-group fixed factor (i.e., group) to a degree where this analytic approach could be questioned. As noted, only the bipolar and at-risk groups, but not the control group, included related individuals.
The mean number of errors on child faces was 4.0 (SD=4.5) in at-risk youths who had no psychiatric diagnoses (N=13) and 2.8 (SD=2.3) in at-risk youths with one or more psychiatric diagnoses (N=8); the corresponding means for adult faces were 4.8 (SD=3.1) and 6.1 (SD=2.0). An ANCOVA with age included as a covariate revealed that at-risk youths without psychiatric diagnoses made more errors on both child and adult faces compared with control subjects (child faces: F=9.91, df=1, 88, p≤0.01; adult faces: F=5.40, df=1, 88, p≤0.02). This suggests that the differences in facial emotion processing observed between the control group and the at-risk group were not accounted for by those at-risk individuals with ADHD or anxiety disorders.
In the at-risk group, a t test revealed no differences in the number of errors between children who were at risk by virtue of parental bipolar disorder (N=10) and those who were at risk by virtue of sibling bipolar disorder (N=14).
Pearson’s correlations revealed no association between number of errors and score on the Young Mania Rating Scale or the Children’s Depression Rating Scale in at-risk or bipolar youths. Euthymic bipolar patients (N=34) differed from control subjects in numbers of errors on both child and adult faces (p values ≤0.01). Within the bipolar group, there were no differences between unmedicated patients (mean errors: child faces=3.3 [SD=1.8]; adult faces=6.64 [SD=4.3]) and medicated patients (mean errors: child faces=4.0 [SD=2.1]; adult faces=5.3 [SD=2.6]) in performance on the facial expressions subtests, and performance and number of medications were not significantly related.


