Such epidemiological investigations, while instructive, do not directly provide insight into the causes of the patterns of co-occurrence. By contrast, similar studies performed in genetically informative samples, such as twins, can distinguish between the structures of psychiatric disorders produced by genetic factors on the one hand and environmental factors on the other. However, it might be asked: What is the value of such an approach in the genomic era? Examining the impact of individual molecular variants on risk for multiple psychiatric disorders will explain only very small proportions of the shared genetic variance (
11). Twin studies, by contrast, assess aggregate genetic effects and therefore examine the degree of sharing across disorders of all genetic risk variants. While molecular methods can lead to a clarification of common pathophysiological pathways, the global questions that psychiatric nosologists have traditionally been interested in (e.g., how closely related genetically are two disorders?) can be best addressed at the aggregate level using genetically informative designs like twin studies (
12).
One previous study examined seven common psychiatric and substance use disorders in members of the Virginia Twin Study of Psychiatric and Substance Use Disorders (
13). Consistent with previous epidemiological investigations, that study identified two genetic factors that loaded strongly on, respectively, three internalizing disorders (major depression, generalized anxiety disorder, and phobias) and four externalizing disorders (alcohol dependence, drug abuse or dependence, antisocial personality disorder, and conduct disorder). A parallel analysis of the effects of the environmental factors did not produce clear internalizing and externalizing factors, which suggests that genetic rather than environmental factors are responsible for the coherent underlying structure of common psychiatric disorders. Other researchers have documented the genetic coherence of an externalizing dimension of psychopathology (e.g., references
14,
15).
The present study, conducted in the Norwegian Institute of Public Health Twin Panel (NIPHTP), represents a follow-up and expansion of our earlier effort (
13) in two critical ways. First, we examined a much broader array of common axis I disorders. Second, while the previous study included only one axis II disorder (antisocial personality disorder), the present analysis includes all 10 of the DSM-IV personality disorders. This addition permitted us, for the first time, to study systematically the genetic and environmental relationships between axis I and axis II disorders, a key component of the current conceptual framework for psychiatric disorders first introduced in DSM-III (
16). One limitation of our approach is worth highlighting. Despite our relatively large sample, many of the individual disorders we wished to study were too rare to be examined solely at a fully syndromal level. Therefore, for the personality disorders, as we have done in the past (
17–19) and others have advocated (
20–24), we examined the number of endorsed criteria. For most of the axis I disorders, we also examined patients with subsyndromal cases (and show that such individuals had disorders that reflected milder manifestations of the same underlying liability as those with fully syndromal disorders).
The goal of this study, then, was to investigate the underlying genetic and environmental structure of a large proportion of common axis I DSM-IV disorders and all DSM-IV axis II disorders. We sought to clarify for the first time the broad structure of common axis I and axis II psychiatric syndromal and subsyndromal disorders as seen from an etiological perspective, in this case from a genetic point of view.
Method
Sample and Assessment Methods
Twins were recruited from the NIPHTP (
25). Twins in the NIPHTP were identified through the Norwegian National Medical Birth Registry, which was established on January 1, 1967, and receives mandatory notification of all live births. Questionnaire studies were previously conducted in 1992 (twins born 1967–1974) and in 1998 (twins born 1967–1979). Altogether, 12,698 twins received the second questionnaire, and 8,045 (3,334 pairs and 1,377 single responders) responded after one reminder (cooperation rate, 63%).
The data for this analysis are from an interview study, conducted from 1999 to 2004, assessing DSM-IV axis I and axis II disorders (
26). Interviewers were largely senior clinical psychology students at the end of their 6-year training course (including at least 6 months of clinical practice) and psychiatric nurses with years of clinical experience. They were trained by professionals with extensive experience with the instrument. The interviews were mostly conducted face-to-face, although for practical reasons 231 interviews (8.3%) were conducted by telephone. Each twin in a pair was interviewed by a different interviewer.
As outlined in detail elsewhere (
26), the 6,442 eligible participants were defined as the 3,153 complete pairs in which both members completed the second questionnaire and agreed to be contacted again, as well as 68 pairs unintentionally drawn directly from the NIPHTP.
Altogether, 2,794 twins (44% of those eligible) were interviewed. Noncooperation was overwhelmingly the result of nonresponse to the written invitation; active refusals were rare (0.8%) (
26). The study was approved by the Norwegian Data Inspectorate and the Regional Ethical Committee, and written informed consent was obtained from all participants after they received a complete description of the study. Of those interviewed, 36.5% were male, and the mean age was 28.2 years (SD=3.9).
As outlined elsewhere (
27), zygosity was determined by the use of questionnaire items for the entire sample (
28) and by microsatellite markers for 676 of the like-sex pairs, which, when used together in a discriminant analysis for participants for whom DNA was unavailable, predicted a zygosity misclassification rate of ∼1% of pairs, a rate far too low to substantially bias results (
29).
These analyses included only the same-sex pairs from this sample—2,111 individuals, including both members of 669 monozygotic and 377 dizygotic pairs and 19 individual twins without their co-twin. Only twin pairs in which both twins initially had agreed to participate were interviewed; for the 19 individual twins, the co-twin changed his or her mind after the initial consent.
Axis I Disorders
Axis I disorders other than conduct disorder were assessed using a Norwegian computerized version of the Munich-Composite International Diagnostic Interview (M-CIDI) (30)—a comprehensive structured diagnostic interview assessing DSM-IV axis I disorders (
1) that has been shown to have good test-retest and interrater reliability (
31–33). Both the paper-and-pencil version and the computerized version of the M-CIDI have previously been used in Norway (
34,
35).
Twelve axis I disorders were included in these analyses: major depression, dysthymia, panic disorder, agoraphobia, specific phobia, social phobia, generalized anxiety disorder, eating disorders, somatoform disorder, alcohol abuse or dependence, illicit drug abuse or dependence, and conduct disorder. Except for conduct disorder, initial analyses of these disorders were performed using DSM-IV diagnoses automatically generated by the M-CIDI data program. However, stable solutions were unobtainable because of small or zero cell frequencies for a number of these diagnoses. We therefore created three ordered categories (unaffected, subsyndromal, and fully syndromal) for 10 of these disorders, which substantially improved the stability of our estimates. Our definitions for the subsyndromal categories are detailed briefly in
Table 1 and in more detail in Table S1 in the data supplement that accompanies the online edition of this article.
We assessed the validity of our subsyndromal categories in two ways. First, we compared all the cross-disorder phenotypic correlations using the original dichotomous full-syndrome variables (tetrachoric correlations) with the three-category variables (polychoric correlations); 95% confidence intervals for these two correlations overlapped for 65 of 66 correlations. Second, using a multiple-threshold model in PRELIS 2.3 (
36), we tested whether the three categories represented differing levels of severity on a single continuum of liability. This test failed at the 5% level three of 46 times, consistent with chance expectations (
37).
The phenotypic tetrachoric and polychoric correlations for this sample between all 22 axis I and II disorders examined in these analyses are listed in Table S2 in the online data supplement.
Axis II Disorders
A Norwegian version of the Structured Interview for DSM-IV Personality (SIDP-IV) (
38) was used to assess all 10 DSM-IV personality disorders and conduct disorder. The DSM-III-R and DSM-IV versions of this interview have been used previously in large-scale studies in Norway (
39,
40). The SIDP-IV, a comprehensive semistructured diagnostic interview for the assessment of DSM-IV personality disorders, contains nonpejorative questions organized into topical sections rather than by individual personality disorder, thereby improving the interview flow. The SIDP-IV interview was conducted after the M-CIDI, which helped to distinguish long-standing behaviors from temporary states resulting from axis I disorders.
The SIDP-IV uses the “5-year rule,” meaning that behaviors, cognitions, and feelings that predominated for most of the past 5 years are judged to be representative of an individual's personality. Each DSM-IV criterion is scored on a 4-point scale (0=absent, 1=subthreshold, 2=present, or 3=strongly present). To keep results parallel with other personality disorders, we examined only the A criterion for antisocial personality disorder.
With traditional cutoff scores, too few individuals met full DSM-IV criteria for the 10 personality disorders for statistical analysis (
17–19). We therefore modeled the personality disorders as an ordinal count of the number of positively endorsed criteria. Furthermore, defining a criterion to be present with a score of 1 or higher produced more stable results than using a cutoff of 2 or higher. This approach is justified by results from previous studies of these 10 personality disorders (
17–19) in which, using a multiple-threshold model, we showed that the four response options for scoring individual personality disorder criteria reflected varying levels of “severity” on a single continuum of liability.
Because few individuals endorsed most of the criteria for individual personality disorders, we collapsed the total criterion count into five categories to reduce the frequency of null cells. We have also tested the validity of this approach by examining the fit of the multiple-threshold model, which asks whether the number of endorsed criteria reflects differences of severity on a single normal continuum of liability. This assumption was supported for all 10 personality disorders (
17–19). For ease of expression, we refer in this article to “personality disorders” in place of the more accurate but cumbersome term “five categories of endorsed criteria for personality disorders.” We previously reported the high interrater reliability for the assessed personality disorder obtained by two raters scoring 70 audiotaped interviews (
27) (intraclass correlations for number of endorsed criteria ranged from 0.81 to 0.96).
Statistical Methods
Our analytic approach involved three major steps: 1) estimating polychoric correlations for 44 (2×22) variables, including within-twin cross-disorder, cross-twin within-disorder, and cross-twin cross-disorder correlations, for monozygotic and dizygotic twins separately; 2) estimating genetic and environmental correlations between all 22 disorders, based on multivariate biometric modeling; and 3) applying exploratory factor analysis to the resulting genetic and environmental correlation matrices.
First, monozygotic and dizygotic polychoric correlations with corresponding asymptotic weights were estimated in Mplus 5.21 for the monozygotic and same-sex dizygotic twin pair data (
41). The robust weighted least squares mean and variance estimator was used. Under this method, all twin correlations for all disorder variables are estimated pairwise using all available ordinal raw data for each combination of variables. The weights are the estimated variances of these correlation parameters. These were obtained in Mplus using the TECH3 output and savedata options. These asymptotic variances up- or down-weight the contribution of each of the respective polychoric correlations.
Next, a saturated Cholesky decomposition of the monozygotic and dizygotic twin correlations among our 22 disorders was performed in Mx. A diagonally weighted least squares fit function was implemented in Mx (
42) to maximize the agreement between the observed statistics and those predicted by the model. The squared deviations between observed and expected correlations were weighted by the inverse of the asymptotic covariances of each statistic; these weights were computed using Mplus. Because of the large number of variables in the model, we had to use limited-information diagonally weighted least squares instead of the more desirable full-information maximum-likelihood approach. A diagonally weighted least squares fit function was implemented in Mx to fit a two-group (monozygotic and dizygotic pairs) Cholesky model including additive genetic (A) and unique environmental (E) parameters to these estimated polychoric correlations and asymptotic weights. Because standard estimating functions could not be used, ordinary statistical indexes were not available to evaluate model-data fit and to compare nested models.
After obtaining estimates of the A and E parameters of the Cholesky decomposition model, the estimated Cholesky path coefficients were converted and rescaled into A and E correlation matrices for the 22 variables, which then served as the input to exploratory factor analyses performed in Mplus 5.21. Exploratory factor analyses were conducted using an unweighted least squares estimator because of the nonpositive definite properties of the A and E correlation structures. The geomin rotation method in Mplus was used to obtain the oblique rotation of the chosen exploratory factor analysis solution. We used oblique rotations because we wanted to examine the magnitude of the relationship between the resulting genetic and environmental factors.
The exploratory factor analysis of the genetic correlation matrix produced four eigenvalues above unity: 9.88, 3.19, 1.85, and 1.53. A scree plot was consistent with an inflection break at either three or four factors. The fourth factor identified a coherent factor of five disorders (genetic factor 4 below) and so merited retention. By contrast, a fifth factor included only one syndrome with a substantial loading (eating disorders)—a clear sign of overextraction. Furthermore, the four-factor solution provides a reasonable summary of the matrix of genetic correlations seen in Table S3 in the online data supplement.
Exploratory factor analysis of the specific environmental correlation matrix revealed six factors with eigenvalues exceeding unity: 5.17, 2.70, 1.46, 1.34, 1.19, and 1.10. Examining the scree plot suggests a break between three and four factors. Adding a third factor identified a coherent bipolar factor with salient loadings on five disorders (environmental factor 3 below). Adding a fourth factor, by contrast, identified a minimally coherent factor with loadings on only two disorders—positive on drug abuse or dependence and negative on dependent personality disorder. We again saw this as evidence of overextraction, so we present results from a four-factor genetic and a three-factor unique environmental solution.
Discussion
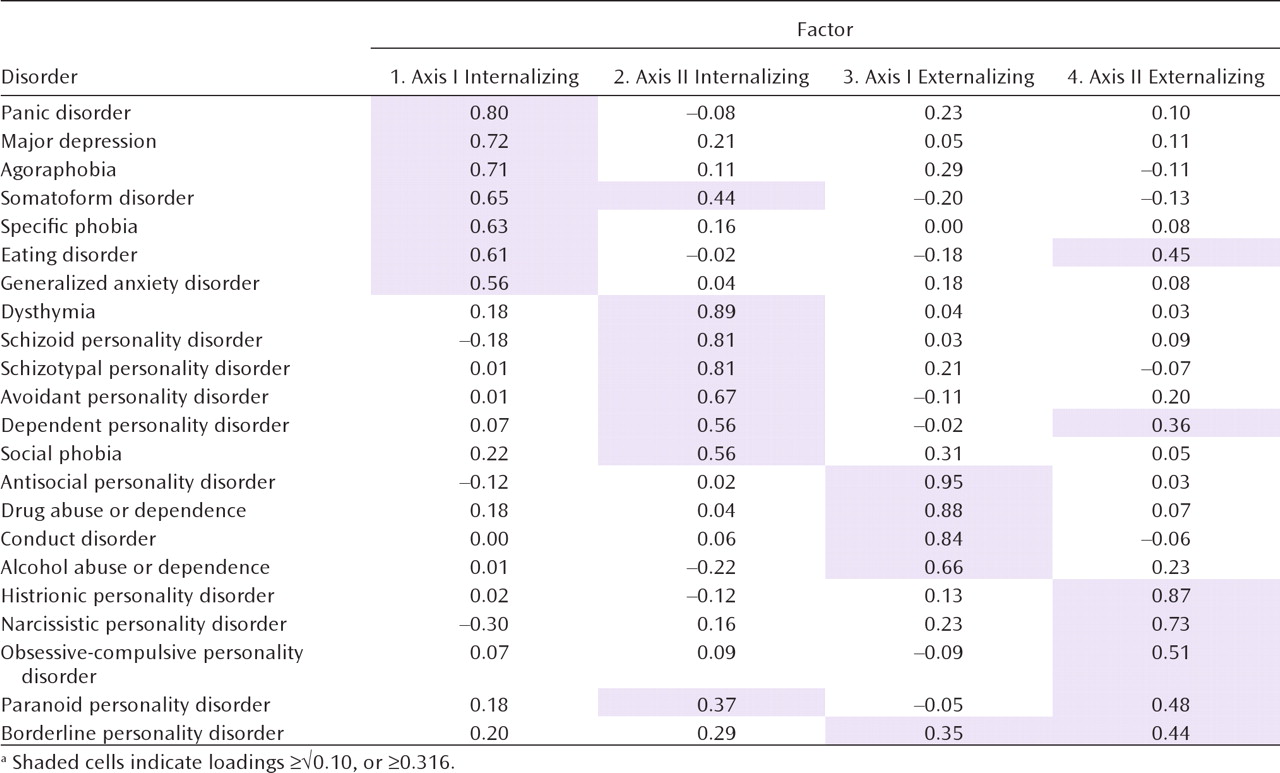
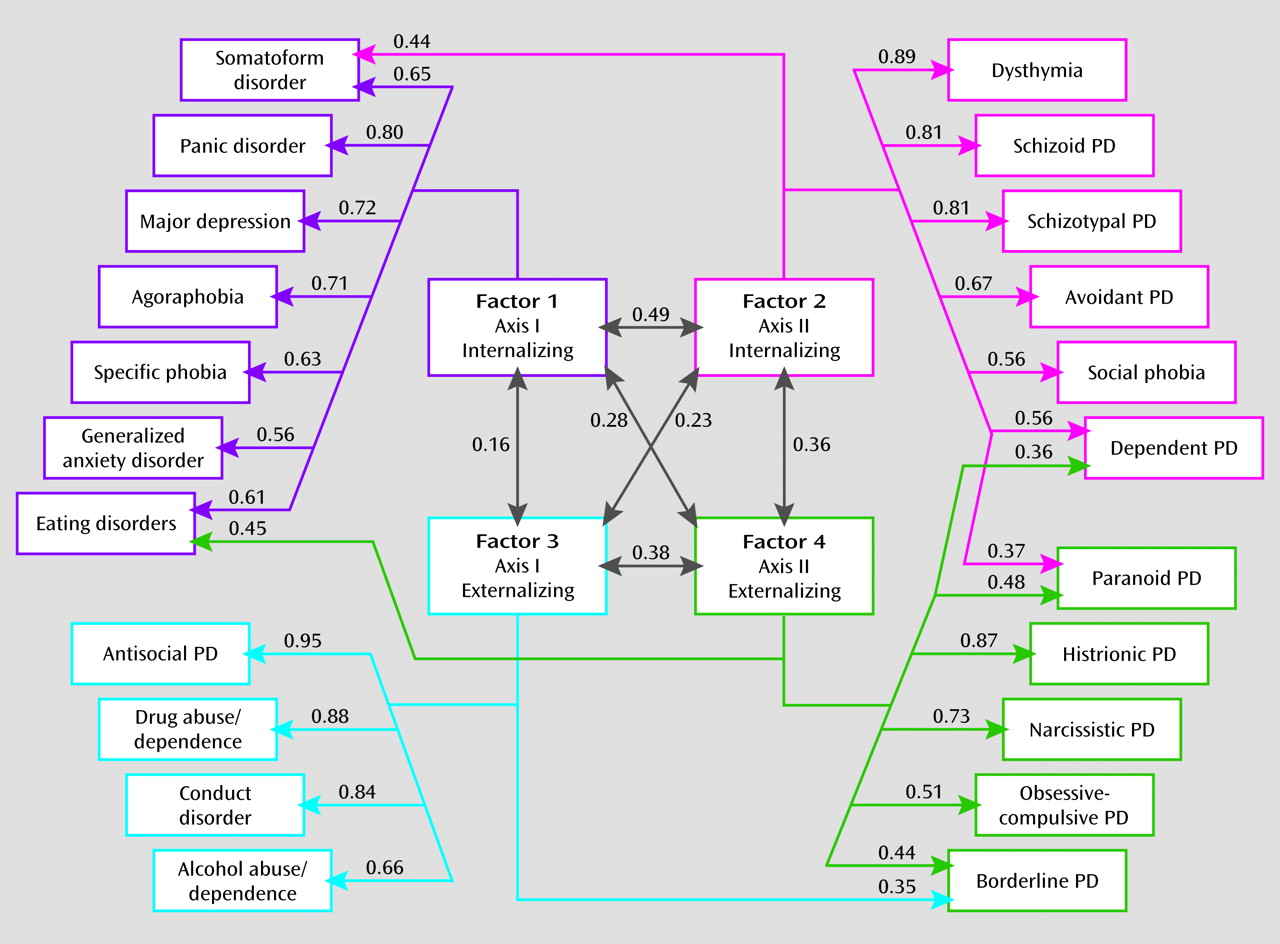
Our goal in this study was to clarify the structure of genetic and environmental risk factors for syndromal and subsyndromal common axis I disorders and all axis II personality disorders as assessed by a criterion count. Using multivariate twin analyses, we identified, from the 22 disorders examined, four coherent genetic factors: axis I internalizing, axis II internalizing, axis I externalizing, and axis II externalizing.
Although not without important limitations (see below), these findings provide, for the first time, a view of the etiological structure of a substantial proportion of common psychiatric disorders. Furthermore, this structure, especially the genetic factors, is coherent and clinically sensible. The structure of the genetic risks for these disorders is neither extremely simple (e.g., just one dimension of underlying risk) nor bewilderingly complex. Of the many interesting results from these analyses, three are particularly noteworthy.
First, we replicated and extended the results of our earlier multivariate twin analysis, which included only seven disorders but clearly identified genetic internalizing and externalizing factors (
13). The present study provides -further support for the importance and generalizability of the internalizing and externalizing genetic dimensions of risk for common psychiatric disorders. While we identified separate internalizing and externalizing factors for axis I and II disorders, they were moderately intercorrelated.
Second, our results provide—for the first time to our knowledge—some support, from a genetic perspective, for the decision in DSM-III to distinguish between axis I and axis II disorders. The genetic substrate for axis II disorders is, in our analyses, at least partially separable from those factors that predispose to axis I disorders. However, the axis I and II disorders that loaded on our genetic factors are not isomorphic with those articulated by DSM-III. Two axis I disorders—dysthymia and social phobia—were included in the internalizing axis II cluster. The concept of dysthymia evolved in part from the concept of “depressive personality” (
16,
43). Our results suggest that from a genetic perspective, it may be better placed with the personality disorders than in the mood disorders section. A debate has long simmered about the relationship between social phobia and avoidant personality disorder (see, for example, references
44–47). Our results suggest that from a genetic perspective, social phobia belongs with avoidant personality disorder on axis II.
Our results supporting a genetic distinction between axis I and axis II disorders might be seen as surprising, given previous evidence that they are highly comorbid and hard to distinguish empirically (
48). Another plausible interpretation of our findings, particularly for internalizing disorders, is that different sets of genetic risk factors predispose to psychiatric disorders that are typically transient and episodic in nature and those that are characteristically more chronic.
Third, “transitional” disorders with substantial loadings on two genetic factors provide further insights into the structure of the genetic risk for psychiatric disorders. Furthermore, the existence of these transitional disorders indicates that the psychiatric disorders in our current classification do not neatly fall into our four proposed clusters. Individuals with high criterion counts for borderline personality disorder were predicted by our results to require elevated genetic risk for both axis I and II externalizing disorders. Paranoid personality disorder stood out because it required risk genes from both the axis II internalizing and externalizing dimensions. Eating disorders had the most unusual configuration, requiring high risk on both the axis I internalizing and the axis II externalizing dimensions.
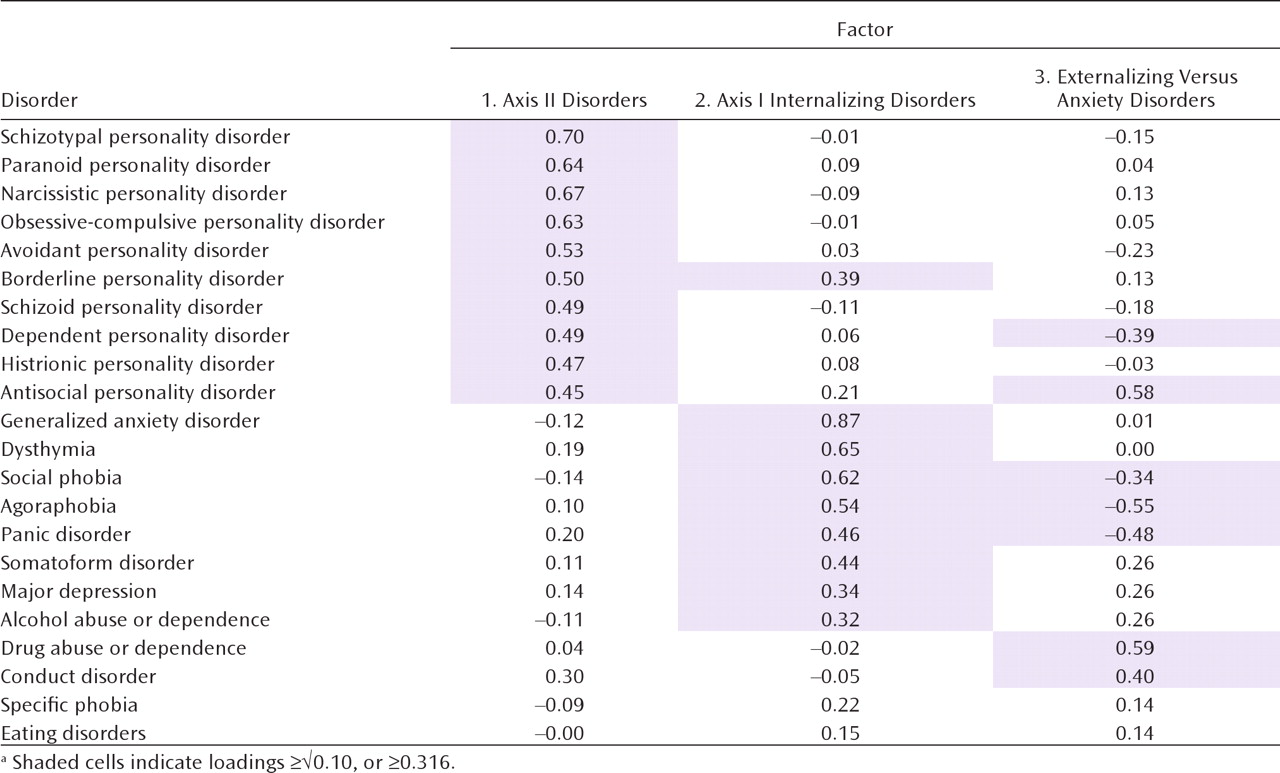
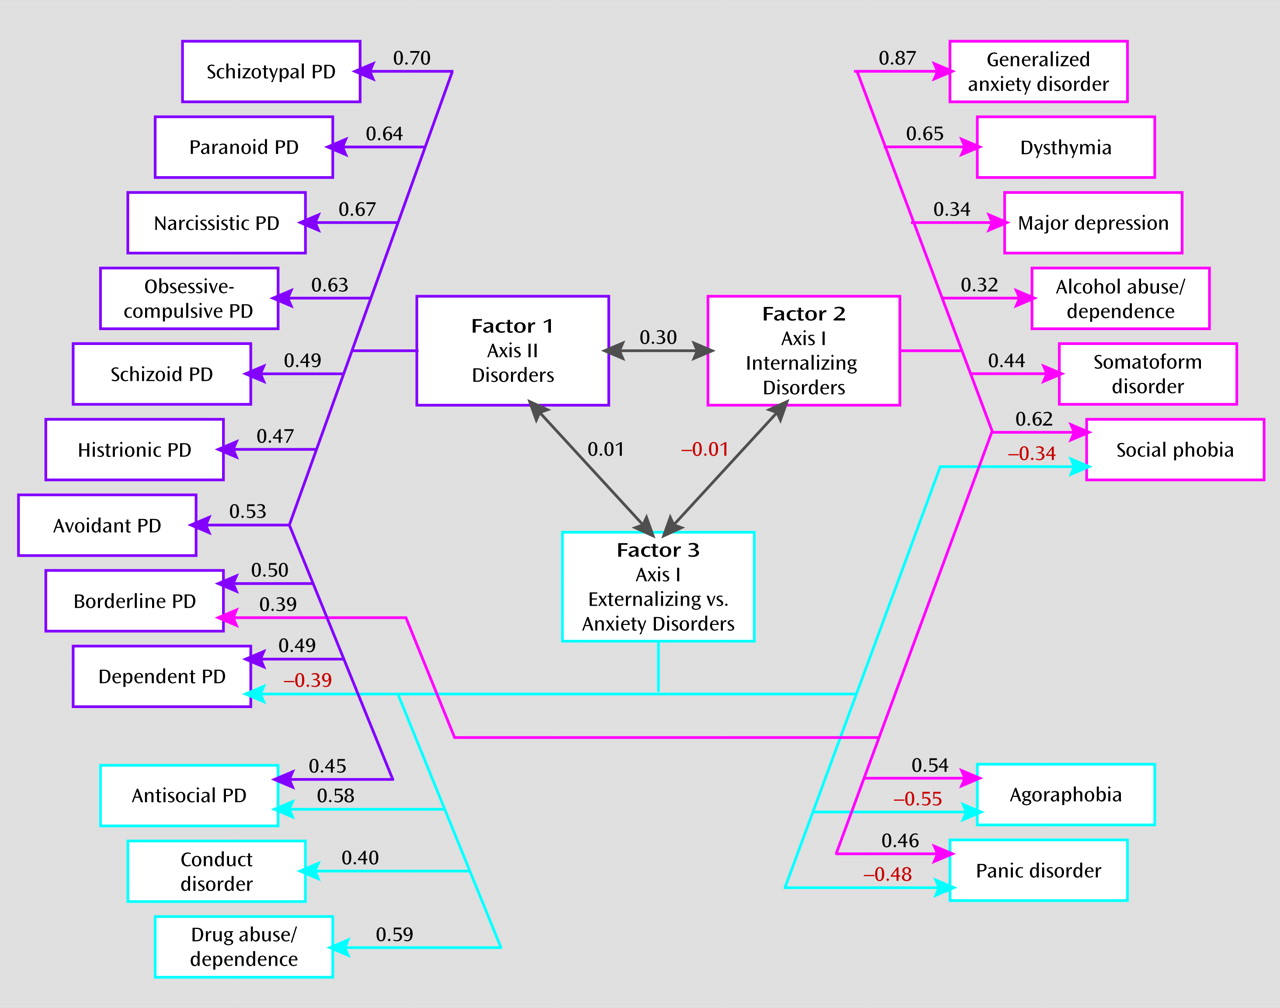
We also identified three unique environmental factors. The first resulted from environmental experiences predisposing to all personality disorders. The second reflected environmental factors altering risk solely to internalizing axis I disorders. Consistent with our Virginia study (
13), with respect to individual-specific environmental risk factors, alcohol abuse or dependence more closely resembled major depression and generalized anxiety disorder than antisocial personality disorder, conduct disorder, or drug abuse or dependence. The third environmental factor reflected environmental exposures that predisposed to the anxiety disorders while protecting against the core externalizing disorders (or vice versa). The inverse relationship between anxiety and externalizing traits is, in our analyses, largely environmental in origin.
It is illustrative to compare the location of a few sets of disorders in genetic versus environmental space. From a genetic perspective, dysthymia sorts with the personality disorders, yet its environmental risk factors place it much closer to major depression. Environmentally, alcohol abuse or dependence shares most risk factors with internalizing disorders but shares genetic risk factors with the axis I externalizing disorders. Environmentally, borderline personality disorder has links with all personality disorders and with axis I internalizing disorders; genetically, it is closely tied to axis I and II externalizing disorders.
Consistent with our earlier study (
13), the division of common psychiatric disorders into internalizing versus externalizing factors results from genetic and not from environmental risk factors. By contrast, the division into axis I versus axis II disorders arises from the effects of both genes and the environment.
Our results are also congruent with our previous analysis in this sample of the structure of genetic risk factors for personality disorders (
27). That study, which examined only the 10 personality disorders, identified three genetic factors, the first of which loaded most heavily on histrionic, narcissistic, and borderline personality disorders—clearly reflecting our axis II externalizing factor. The second factor loaded more specifically on antisocial and borderline personality disorders—approximating our broader axis I externalizing genetic factor. The third genetic factor loaded most heavily on avoidant and schizoid personality disorders, with weaker loadings on dependent and schizotypal personality disorders—reflecting our axis II internalizing genetic factor.
Limitations
These results need to be interpreted in the context of nine additional potentially significant limitations. First, our results are obtained in native-born young adult Norwegian twins and may not generalize to other ethnic or age groups.
Second, as many important psychiatric disorders (e.g., schizophrenia, autism, bipolar illness) were not included in these analyses, no claims can be made for our identification of the structure of risk factors for all psychiatric illness.
Third, using traditional statistical methods, we were unable to estimate results separately in male and female participants. While we controlled for prevalence differences across the sexes, we cannot rule out the possibility that we have averaged results of the two sexes that might meaningfully differ from one another. However, three findings reduce our concern that we have thereby introduced significant biases in our findings. In our earlier multivariate study in the Virginia Twin Registry (
13), once we accounted for differences in prevalence, we were able, in a much larger twin sample, to constrain to equality parameter estimates across the sexes. In all of our previous analyses of the axis I and II disorders in this Norwegian sample, we have failed to find evidence for sex-specific genetic or environmental effects (
17–19,
27,
49–52). Finally, we examined several models of our 22 disorders treating the criterion counts and subthreshold and threshold diagnoses as normally distributed variables. While this approach does not correctly capture the distributional properties of our variables, it nonetheless provides some useful information. Compared to the full model with separate parameter estimates for male and female participants, a model constraining all the genetic and environmental parameters to equality in the two sexes provided a much better fit using the Bayesian information criterion, a fit index particularly well suited for complex models (
53).
Fourth, we were unable to test, using standard twin model fitting, whether the addition of shared environmental factors would improve the fit of this large multivariate model. However, a wide range of previous analyses with most of the disorders included in our model failed to find evidence for substantial shared environmental effects (
17–19,
27,
47,
49–52,
54). Furthermore, treating the criterion counts and subthreshold and threshold diagnoses as normally distributed, we compared the full model and a model that dropped all of the shared environmental parameters. It fitted much better using the Bayesian information criterion and also was clearly superior to a model that dropped all the additive genetic parameters. While we cannot rule out a modest degree of confounding of genetic with shared environmental effects, it is unlikely that this confounding is substantial.
Fifth, we could not formally test the number of genetic and environmental factors extracted. We therefore had to rely on the more traditional methods of the scree plot and clinical interpretation. We feel confident, however, that four genetic and three specific-environmental factors represent the most parsimonious structure that well accounts for the observed results.
Sixth, we lacked the ability to calculate confidence intervals for the individual parameter estimates. Given the size of our sample, we suspect that our parameter estimates are known with only moderate accuracy (
55). However, it is the broad pattern of our findings rather than the specific value of any individual parameter that is probably of greatest value in these analyses.
Seventh, substantial attrition was observed from the original birth registry through three waves of contact. However, detailed analyses of the predictors of nonresponse across waves (
26) revealed that cooperation was strongly predicted by sex, zygosity, age, and education but not psychiatric symptoms or self-report personality disorder items that have been shown empirically to predict DSM-IV personality disorder criteria in the personal interview phase. For example, among 45 predictors, including 22 mental health variables, only two—older age and monozygosity—predicted cooperation in the personal interview phase. Twin analyses of 25 mental health-related variables from earlier questionnaires reflecting psychiatric and personality disorder symptoms and substance use revealed no significant differences between those who completed a personal interview and those who did not (
26). Thus it is unlikely that attrition introduced bias in the estimates of the etiological role of genetic and environmental risk factors for this broad range of mental health indicators. Our sample is probably broadly representative of the Norwegian population with respect to psychopathology.
Eighth, could our results be sensitive to the specific method of factor extraction? In addition to the oblique geomin rotations, we examined solutions obtained by the orthogonal varimax and oblique promax methods. All four genetic factors and the first environmental factor were stable across rotational methods, with only small differences on the second and third environmental factors (e.g., higher cross-loadings for antisocial personality disorder and drug abuse or dependence). The main features of our results, especially the four genetic factors, were stable with respect to the method of factor extraction.
Finally, could method variance account for critical parts of our findings? We used two separate instruments with different formats for the assessment of axis I versus conduct and personality disorders. However, our results -suggest that this concern is unwarranted. Our second genetic factor contained five axis II personality disorders and two axis I disorders. Antisocial personality disorder and conduct disorder, both assessed in our personality disorder interview, were placed in the third genetic factor and the third environmental factor each time with other axis I disorders. This pattern of results is not consistent with a method variance account.
