Recently, both the National Institute of Mental Health and the DSM-5 work groups have emphasized the importance of a lifespan perspective for understanding the risk for and the onset, etiology, and prognosis of psychiatric disorders (
1). While the scientific rationale for such a perspective is well justified, there are significant methodological challenges inherent in assessing development or change in psychiatric outcomes across broader periods of the lifespan. In this article, we specifically discuss the design choice issues posed by such developmental or lifespan approaches.
Context and Approach
One of the fundamental methodological challenges in characterizing illness trajectories in psychiatry involves the ability to capture, characterize, and explain between-patient variation in illness trajectories. For example, the trajectory of a disorder in an individual patient will reflect the timing of illness onset as well as when in the course of an illness the number and severity of symptoms increase or decrease. There will likely be substantial variation in these features between patients. Accurately characterizing trajectories for any disorder requires considering the sources of variation that affect the course of illness in the individual patient, as well as differences between patients. These sources of variation are confounded in many psychiatric studies.
In this article we discuss 1) the sources of between-patient and within-patient variation that make characterization of illness trajectories difficult; 2) the implications for design choices in studies aiming to characterize illness trajectories; 3) the ways in which psychiatric research often ignores one source of potential variation in particular, namely, variation associated with differences between cohorts; and 4) the ways in which ignoring the presence of age cohorts can produce misleading results. We illustrate these challenges with an example taken from the Alzheimer's Disease Neuroimaging Initiative (ADNI). Finally, we outline a design approach that addresses many of these issues, maximizing the ability of researchers of psychiatric disorders to arrive at the most accurate characterization of illness trajectories possible.
Although there is a rich and detailed literature on the characterization of trajectories in developmental and lifespan psychology (
2–
7), these issues have been frequently neglected in psychiatric research. We emphasize that we draw substantially on this literature to underscore for academic researchers in psychiatry the importance of accounting for different sources of variation in accurately estimating illness trajectories and how choosing the most appropriate study design and analyses can go a long way toward minimizing conflation of sources of variation (
3,
5,
8,
9). We also expand beyond the traditional methodological literature on age cohort effects by emphasizing related issues that are particularly germane to psychiatric research, namely, the importance of characterizing between-patient differences in the timing of transitions between illness states and the ways these transitions can interact with study design to affect trajectory estimates of psychiatric disorders.
Methodological Challenges in Characterizing Trajectories
Three sources of between-patient variation can seriously undermine the utility of commonly employed experimental designs for making developmental or longitudinal inferences in psychiatric research: population cohort effects, sampling variation across cohorts, and presence of nonlinear or nonparallel illness trajectories between patients.
Population Cohort Effects
A cohort is defined as “the total population of individuals entering a specified environment at the same point in time” (
10, p. 92). The most commonly implemented cohort-defining event is year of birth, giving rise to age cohorts. A rule of thumb is that individuals born within the same 5-year period belong to the same age cohort. Other cohort-defining events may be more or less uncoupled from chronological age—for example, year of menopause or year of disease onset (
11). Age cohort effects arise from differences between subjects that are linked to year of birth, such as improvements in the ability to diagnose and treat autism in the first 5 years of life for cohorts born in recent decades. Another example might be the impact of differences across age cohorts in access to childhood education, which could change the risk for cognitive decline later in life. In general, variation over time in environmental exposure, diagnostic criteria, or treatment protocols, especially during sensitive periods of development, can yield substantial cohort effects.
Age cohort effects should not be confused with changes within individual patients with the passing of time. Confusing age cohort effects with within-patient changes over time can seriously bias conclusions regarding trajectories of illness.
Sampling Variation Across Age Cohorts
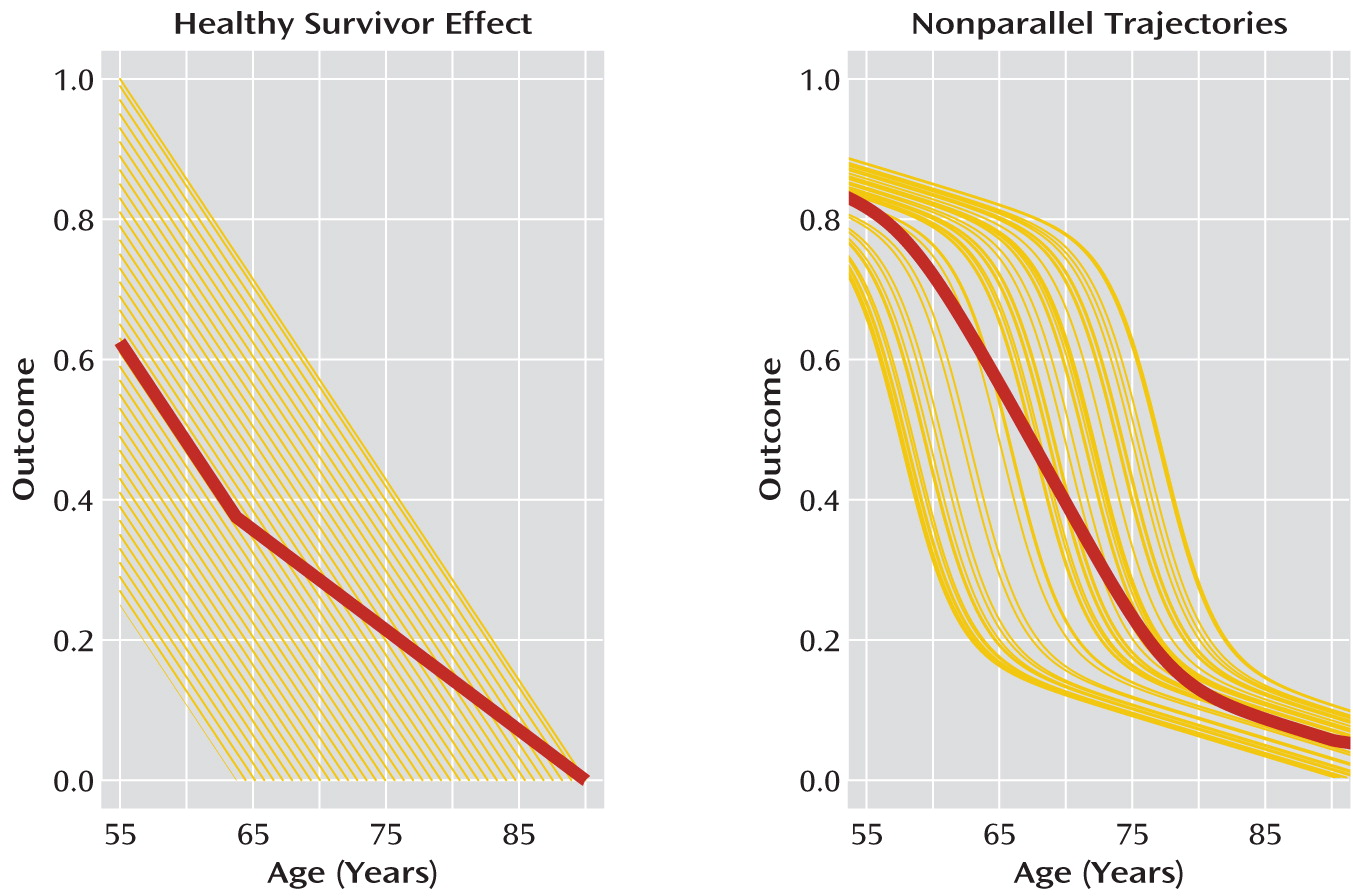
Sampling criteria that result in differences in how subjects are selected according to age or across age cohorts may be systematically linked to biases in any trajectories derived from the study data. These differences can have a marked impact on the accuracy of illness trajectory estimates if they are not taken into consideration when designing and analyzing the data in a psychiatric study. A common example is the “healthy survivor” effect (
Figure 1). The healthy survivor effect occurs when the psychiatric outcomes under investigation affect which subjects of a certain age cohort are sampled. For example, a cognitive performance outcome may decline as subjects grow older, but subjects with cognitive performance below a certain level may be too disabled to participate in the study. In this case, subjects in the sampled older age cohorts will tend to have higher levels of the cognitive outcome than would be typical for the general population in that age cohort. The net effect would be to bias estimates of cognitive performance trajectories upward in later age cohorts.
Another situation that gives rise to sampling variation across age cohorts in psychiatric studies occurs when trajectories are nonlinear. As we illustrate below, if outcome trajectories are steeper after illness onset, sampling all subjects at the same chronological age regardless of age at illness onset can introduce spurious effects.
Between-Patient Variation in Nonparallel Trajectories
Another source of confusion arises from assuming parallel trajectories of illness across patients when this is not true. If trajectories are nonparallel, simply computing or modeling an average value of the outcome at each age results in an estimated illness trajectory that is a misleading characterization of illness trajectories in the population (
Figure 1).
The ability to differentiate these sources of variation, and hence to characterize illness trajectories accurately, is intimately tied to the choice of study design. Next, we discuss how the three most commonly used designs in psychiatry—cross-sectional, single-cohort longitudinal, and unstructured multicohort longitudinal designs—affect the ability to account for these sources of variation and thus to characterize illness trajectories accurately.
Design Issues and Choices for Characterizing Trajectories
Cross-Sectional Designs
Developmental or longitudinal inferences are often drawn from serial cross-sectional designs, in which each subject is studied once at a particular age, with age varying across subjects (
12–
17). An
unstructured serial cross-sectional study is one in which each subject is observed only once and the ages between subjects are randomly distributed over the age span under investigation. A
structured serial cross-sectional design is one in which a prespecified number of subjects is sampled from a population at prespecified ages. The relationship between age and outcome may then be described by the average response of the subjects sampled at each age.
Cross-sectional studies completely confound within- and between-subject sources of variation (
9) and assume that there are no age cohort differences, or negligible age cohort differences, when drawing longitudinal inferences (
12). Cross-sectional designs cannot capture individual variation in the “shape” of trajectories (i.e., timing of inflection points) across subjects and thus can be very misleading. The shape of an average trajectory computed from a cross-sectional study is the same as the shape of individual subject trajectories only if the trajectories for all subjects in the study are parallel. This assumption is usually not true. Bell (
2) noted that the prepubertal growth spurt is often seen in individual growth curves but not in the average curve, because such spurts begin at different ages for different individuals. Similarly, age of conversion to Alzheimer's disease, or age at which the rate of cognitive decline accelerates, can be highly variable across individuals (
18). Thus, cross-sectional data alone are clearly insufficient for drawing robust developmental or longitudinal inferences.
Single-Cohort Longitudinal Designs
Prospective single-cohort longitudinal designs follow subjects in one cohort over the entire age span of interest, measuring outcomes repeatedly over time. The prospective single-cohort longitudinal design has long been considered the ideal design for understanding within-subject change over time at any stage of the lifespan. True single-cohort longitudinal designs follow patients from the same cohort over a specified age span of interest (
19,
20). Single-cohort longitudinal designs confer an important advantage over other study designs because they characterize trajectories based on directly measuring longitudinal change for each patient over the entire age span under investigation.
Because single-cohort longitudinal studies contain only one cohort, there is no variation in outcome that occurs as a result of cohort effects. However, by the same token, a single-cohort longitudinal design cannot capture variation in outcomes that may differ across age cohorts. This reduces the ability to generalize trajectory estimates to other age cohorts (
8). Single-cohort longitudinal designs also completely confound aging and period effects. Period effects result from historical influences that broadly affect a population, regardless of age or age cohort, within that historical time frame (
6). An example might be the rapid introduction of a new and highly effective medication to most patients in a given population. This confound is more of a problem over longer study time spans (
9).
There are also significant practical problems with single-cohort longitudinal designs. Studies must be of sufficient length to observe the impact of longitudinal trajectories for psychiatric disorders. For example, if the age span of a study were from 55 to 90 years, that would entail recruiting a sample of 55-year-olds and following each periodically for 35 years. The length of time involved in such a study can create a number of problems beyond the frustration of waiting 35 or more years to obtain a complete data set of longitudinal trajectories. Rapidly developing clinical tools and technology related to measurement of outcomes, such as gene expression or brain function, are virtually certain to be substantially changed by the end of a 35-year single-cohort longitudinal study. Employing obsolete measurement instruments creates problems of relevance, and switching to more modern instruments creates problems of within-study comparability. Even in the absence of problems with funding and measurement, the logistic issues in long-term single-cohort longitudinal designs can have a strong impact on developmental inferences. Missing data and subject attrition are likely to be substantial over 35 years and unlikely to occur at random, and hence estimates of longitudinal trajectories may be quite biased.
Unstructured Multicohort Longitudinal Designs
In a prospective multicohort longitudinal study, data are collected from multiple age cohorts, with each cohort followed longitudinally for a given length of time. Typically, although not necessarily, the length of time each cohort is followed is a small fraction of the total age range under study. A greater span of ages can thus be obtained in a shorter time span than in single-cohort longitudinal designs. Unlike cross-sectional designs, multicohort longitudinal designs capture variation both between and within patients across age.
Variation due to age cohort has not been routinely considered either in the design or in the analyses for most multicohort longitudinal studies in psychiatry. Indeed, when conducting longitudinal investigations, most psychiatric studies simply specify that subjects must be within a certain age range at baseline and otherwise allow recruitment to vary randomly as a function of baseline age. By allowing age to distribute randomly at baseline, investigators assume they are doing a prospective single-cohort study. But when age at entry covers a broad span, for example, a range of 10 years or more, the investigators are actually conducting a study that encompasses several age cohorts. We denote these designs as unstructured multicohort longitudinal designs because they enroll subjects in a random, or unstructured, fashion with respect to age and age cohort.
Unstructured multicohort longitudinal designs are particularly common in psychiatric studies, sometimes covering 20–40 years (for examples, see references
21–
27). In such studies, variation tied to age cohort is typically overlooked. Random sampling of baseline ages often leads to unequal cohort cell sizes that do not necessarily produce overlapping trajectories and hence can lead to suboptimal assessment of the impact of age cohort or sampling effects and less accurate characterization of illness trajectories.
Unstructured Multicohort Longitudinal Designs: An Example From ADNI
To illustrate the effects of different study designs, we conducted an analysis using data from the ADNI database (
www.loni.ucla.edu/ADNI), current through November 17, 2011. ADNI was formed in 2003 by the National Institute on Aging, the National Institute of Biomedical Imaging and Bioengineering, the Food and Drug Administration, private pharmaceutical companies, and nonprofit organizations. It is a multisite initiative that collects serial MRI images, data on genetics and biological markers, and data from clinical and neuropsychological assessments to measure the progression of mild cognitive impairment (N=400) and early Alzheimer's disease (N=200). Participants have been recruited from 50 sites across the United States and Canada.
The ADNI study is an unstructured multicohort longitudinal design, in that participants enter the study at baseline ages that vary randomly between ages 55 and 91 years (mean=75, SD=7.4) and are subsequently followed roughly biannually for approximately 2 years (years in study: mean=1.7, SD=0.6; number of visits: mean=3.8, SD=1.5). The entorhinal cortex-hippocampus system appears particularly vulnerable to the pathology of this illness and is already damaged at the time clinical symptoms first manifest (
28).
Our analyses focused on estimating trajectories of change in total entorhinal cortex thickness in 157 participants with Alzheimer's disease for whom we had serial MRI measures and genetic information. Of these, 107 were carriers and 50 were noncarriers of the apolipoprotein E (APOE) ε4 risk allele (denoted by ε4+ and ε4–, respectively, and coded as 0.5 and –0.5 in analyses) for developing Alzheimer's disease. Entorhinal cortex thickness was standardized to have a mean of zero and a standard deviation of 1, and patient age was centered at 55 years. We included site of imaging scan as a random factor. All analyses were conducted in the R statistical program, version 2.10 (
www.r-project.org).
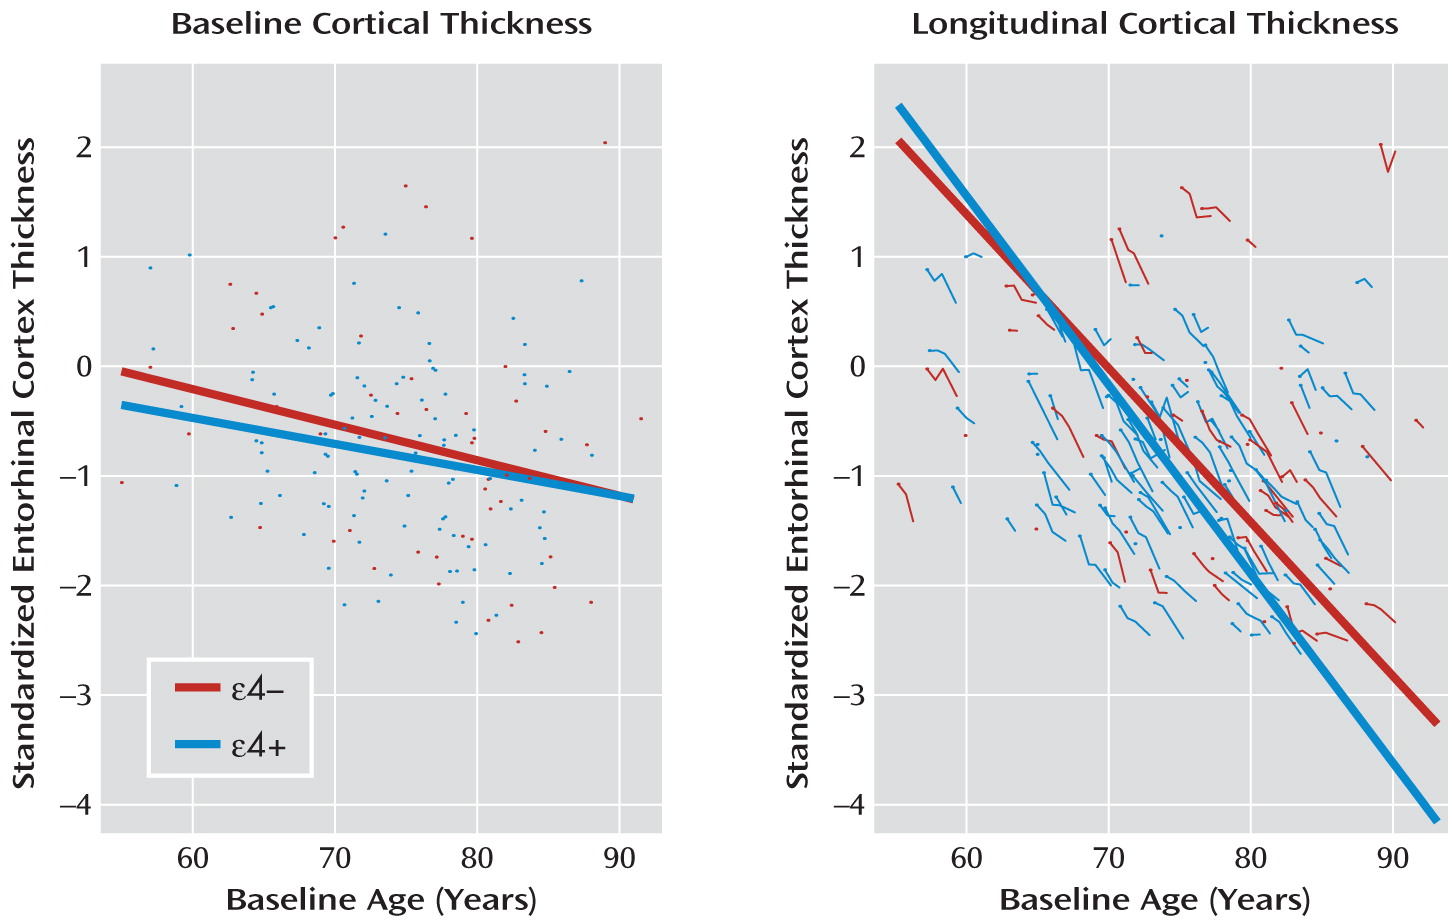
First, this example clearly illustrates the limits of characterizing illness trajectories from cross-sectional data. In
Figure 2, the left panel displays a linear regression of baseline entorhinal cortex thickness against baseline age in the 157 patients with Alzheimer's disease. APOE-ε4 status is also entered into the regression along with the interaction of ε4 status with baseline age. Baseline thickness decreases as a function of baseline age (mean annual change=–0.032, SE=0.010, p=0.001). Neither ε4+ status nor the interaction of ε4+ status with baseline age is statistically significant. The conclusion reached from the baseline data alone is that cortical atrophy is modest in patients with early-onset Alzheimer's disease and that APOE-ε4 status has a negligible effect.
As is illustrated in the right-hand panel in
Figure 2, the longitudinal data tell a markedly different story. For these data, we fitted a linear mixed-effects model with standardized entorhinal cortex thickness as the dependent variable and with age, ε4 status, and their interaction as independent variables. Intercept and age were entered as random effects to account for within-subject correlation in outcomes. For simplicity, in this example we do not explore further correlation structures on error variances. In tests of fixed effects, the degrees of freedom for the denominator were approximated using the same decomposition as in balanced multilevel analyses of variance (
29). Entorhinal cortex thickness trajectories have a much more negative slope (mean annual change=–0.140, df=288, SE=0.006, p<0.001) in the longitudinal model compared with the cross-sectional model. Moreover, as seen in the figure, entorhinal cortex thickness decreases more rapidly with age in the ε4+ group than in the ε4– group (mean annual change=–0.032, df=288, SE=0.013, p=0.011).
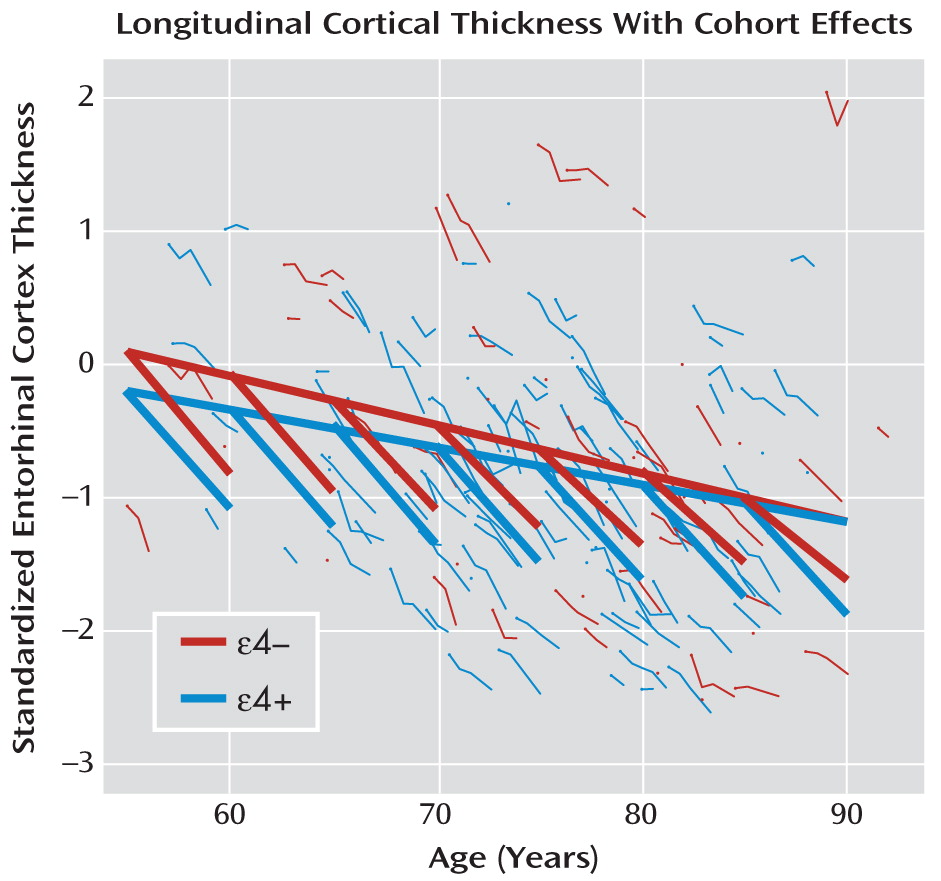
However, an even more accurate and complete representation of the trajectories is obtained if we assess the degree to which decreasing thickness with age in both ε4 groups reflects within-subject aging effects or between-subject age cohort or sampling effects. To do this, we refitted the mixed-effects model, this time using age cohort as an independent variable and including within-subject change in age (from baseline) and ε4 status, along with their interaction, as additional independent variables. Intercept and within-subject change in age were entered as random effects.
Our results indicate that age cohort has a significantly negative effect on entorhinal cortex thickness (mean annual change=–0.31, df=154, SE=0.010, p=0.001), but only at one-fifth the rate of within-subject change in age from baseline (mean annual change=–0.157, df=287, SE=0.006, p<0.001). The interaction of age with APOE-ε4 status is also significantly negative (mean annual change=–0.028, df=287, SE=0.013, p=0.030). Thus, entorhinal cortex thickness decreases much more slowly as a function of age cohort than it does as a function of within-subject change in age, an effect even more pronounced in the ε4+ group (
Figure 3).
The estimated age cohort effects allow us to account for a significant source of variation in trajectories across patients and help provide a more accurate characterization of cortical atrophy in early-onset Alzheimer's disease. In other words, while longitudinal data yield a more accurate picture than cross-sectional data of cortical atrophy within patients (left versus right panel of
Figure 2), including age cohort further refines the longitudinal model, capturing a more complete picture of entorhinal cortex thickness trajectories (
Figure 3 compared to the left or the right panel of
Figure 2).
In addition to yielding more accurate estimates of the relationship between outcomes and age, detection of age cohort effects can be highly informative. In this example, our results show that younger age cohorts of patients with early-onset Alzheimer's disease have lower entorhinal cortical thickness relative to the equivalent-age patients in older age cohorts (
Figure 3). It may be that this reflects true population age cohort effects. However, it is difficult to explain scientifically why entorhinal cortex thickness would be reduced in younger relative to equivalent-age subjects from more recent than older cohorts.
Any detected cohort effects can also be the result of sampling criteria, rather than actual true cohort effects. If the true illness trajectories are nonlinear, the timing of when subjects are sampled can have a dramatic impact on the characterization of the trajectory. Thus, for example, studies have found evidence of accelerating rates of atrophy in brain regions at onset of mild cognitive impairment and in early Alzheimer's disease (
30,
31). It is plausible that the estimated age cohort slope (heavy unbroken lines in
Figure 3) reflects rates of atrophy occurring before the diagnosis of Alzheimer's disease is made, whereas the steeper within-subject slopes (heavy broken line segments in
Figure 3) reflect postdiagnosis rates of atrophy. Age cohort effects then arise from sampling patients with nonlinear trajectories at a time point after illness onset and hence after the time at which accelerated decline occurs in entorhinal cortex thickness.
Structured Multicohort Longitudinal Designs
Many of the deficiencies of unstructured multicohort longitudinal designs can be ameliorated by carefully prespecifying the number of subjects in each age cohort and the degree of overlap across neighboring cohorts. We term this approach a
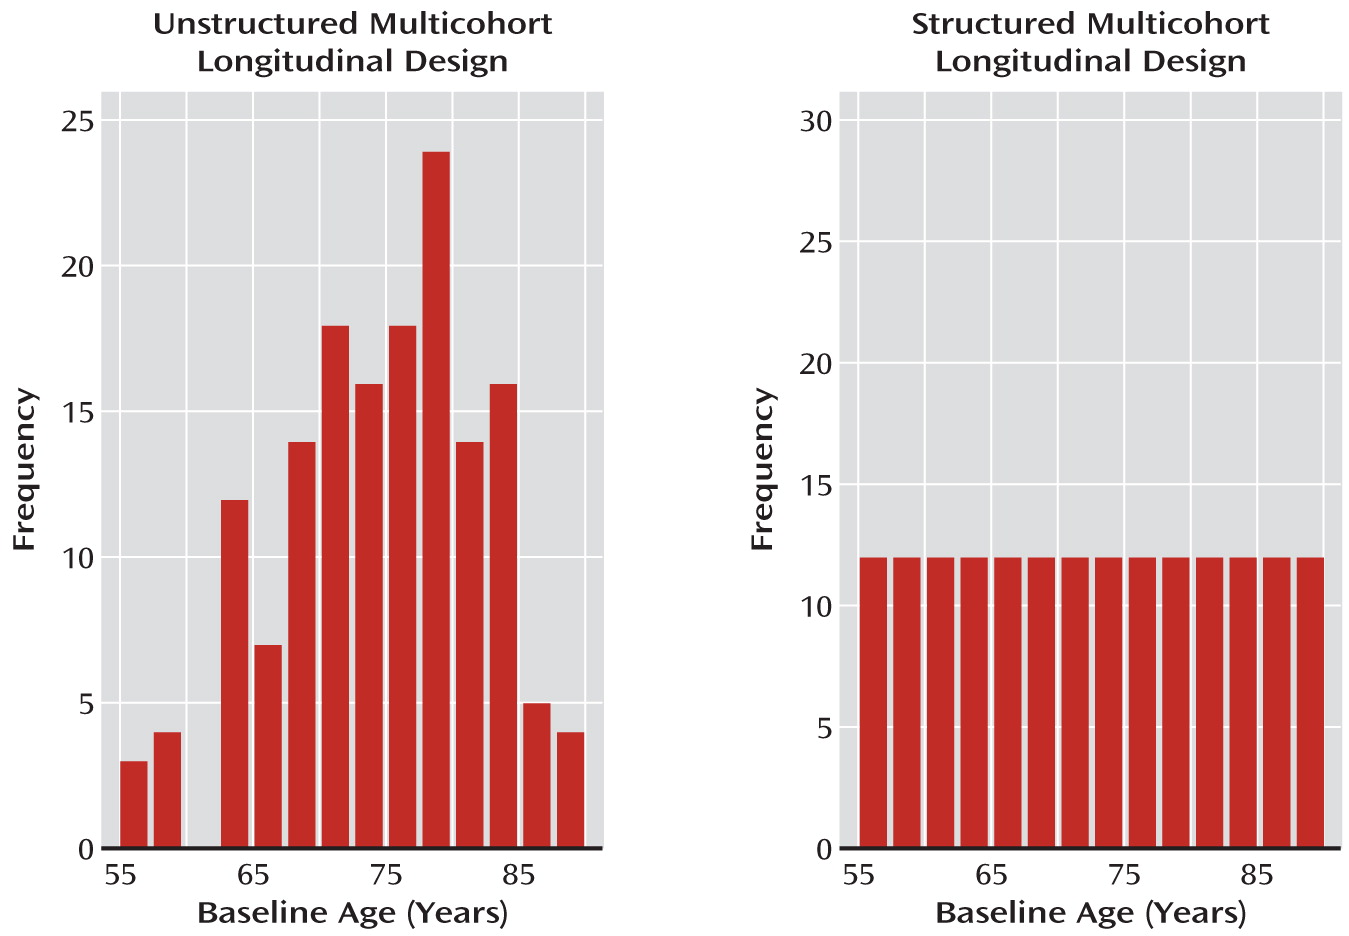
structured multicohort longitudinal design. Unlike in an unstructured design, where age varies randomly at baseline, in a structured design, individuals enter the study at preselected ages (age cohorts; see
Figure 4) spanning the age range of interest, with each subject followed longitudinally over a shorter time span relative to the entire age range under investigation. Structured multicohort longitudinal designs of various types have been very successfully conceptualized and applied to developmental research elsewhere (
3,
5,
9,
32) but have been used minimally in studies of the genetic, biological, and environmental factors that affect the development and progression of psychiatric disorders (
33–
35).
An important example of a structured design is the accelerated longitudinal design, proposed by Bell (
2,
36), also sometimes called the cohort-sequential design (
37). Essentially, each age cohort in an accelerated longitudinal design enters a prospective longitudinal study of a duration that can be encompassed within, for example, a 5-year funding period (
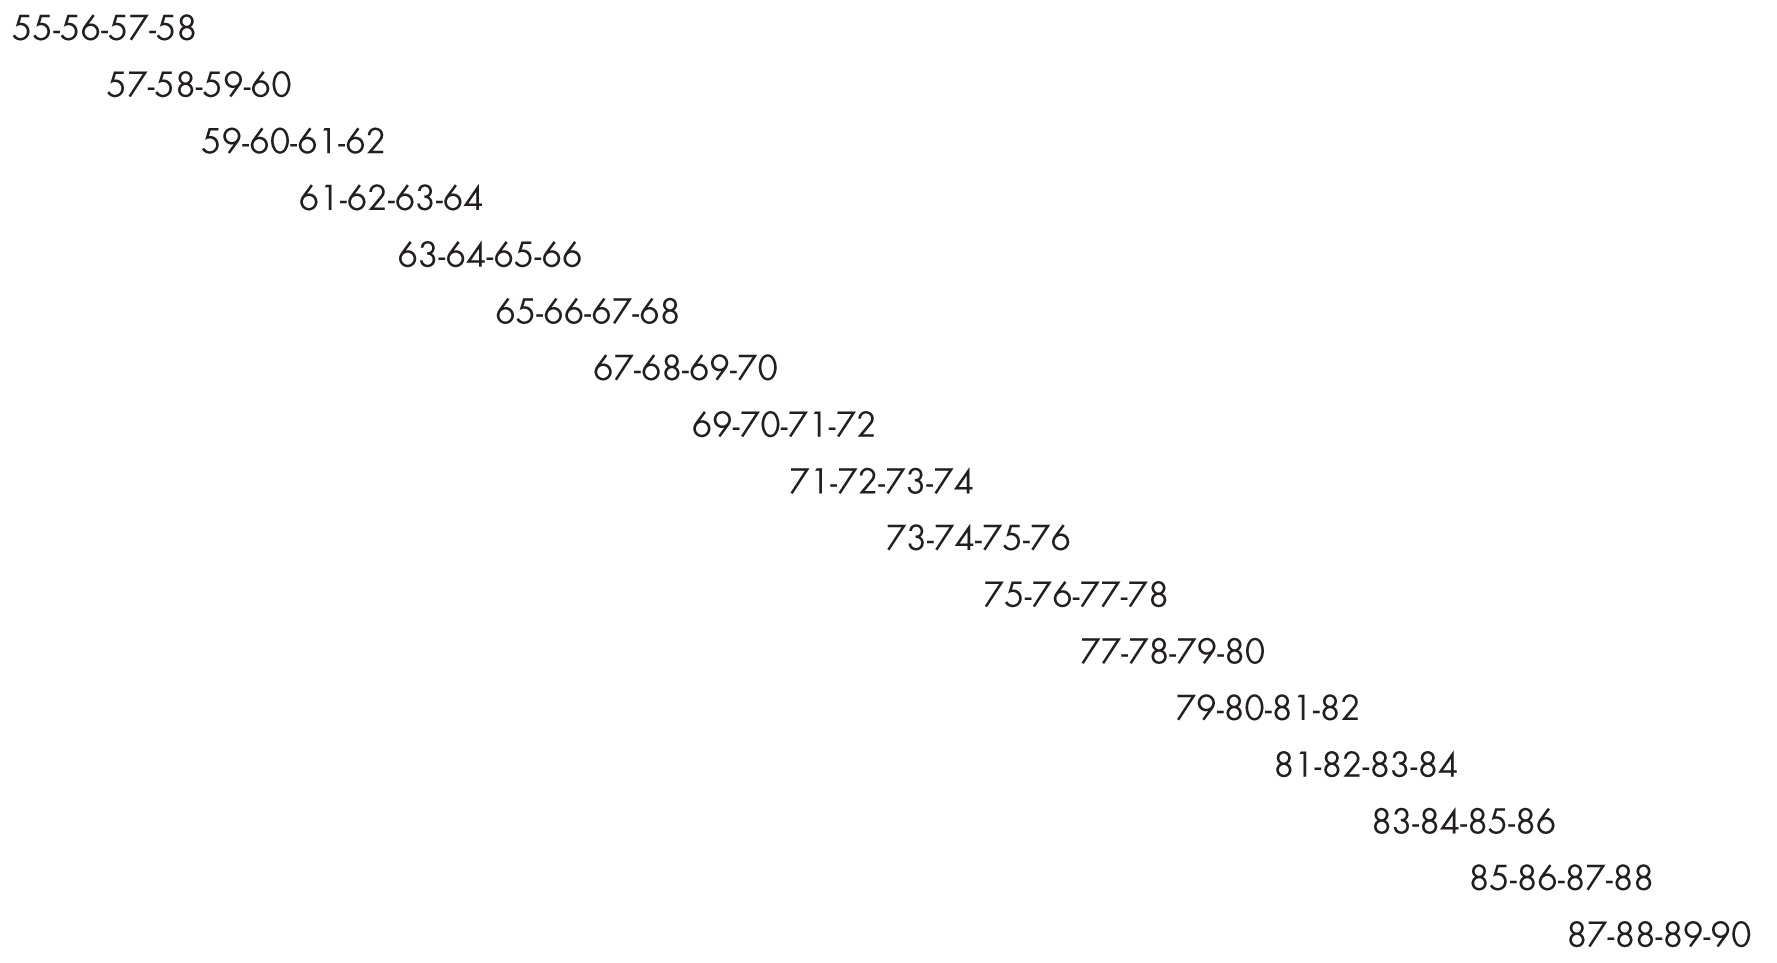
Figure 5). A crucial design requirement is that the short cohort age spans overlap. If the age span were 55–90 years, one might select age cohorts followed yearly from ages 55–58, 57–60, and so on. There would be 17 age cohorts, with each subject being followed for 3 years after the first baseline measurement, covering the 55–90 year age span, with a 2-year overlap between consecutive age cohorts. Thus, by choosing the appropriate overlapping cohorts, trajectories across long age spans can be estimated within the confines of a 5-year grant.
Conceptually, a longitudinal model is fitted to subjects within each age cohort, and these short sections of developmental trajectories are spliced together to estimate the total developmental trajectory over the entire age span. In practice, this is accomplished by an application of mixed-effects models that include both age and age cohort as independent variables. Trajectories of subjects in overlapping age cohorts are used to estimate and test for the presence of age cohort effects (
3,
38–
40), and the design structure facilitates disentangling the effects of age from effects due to age cohort, sampling, or nonlinear and nonparallel trajectories.
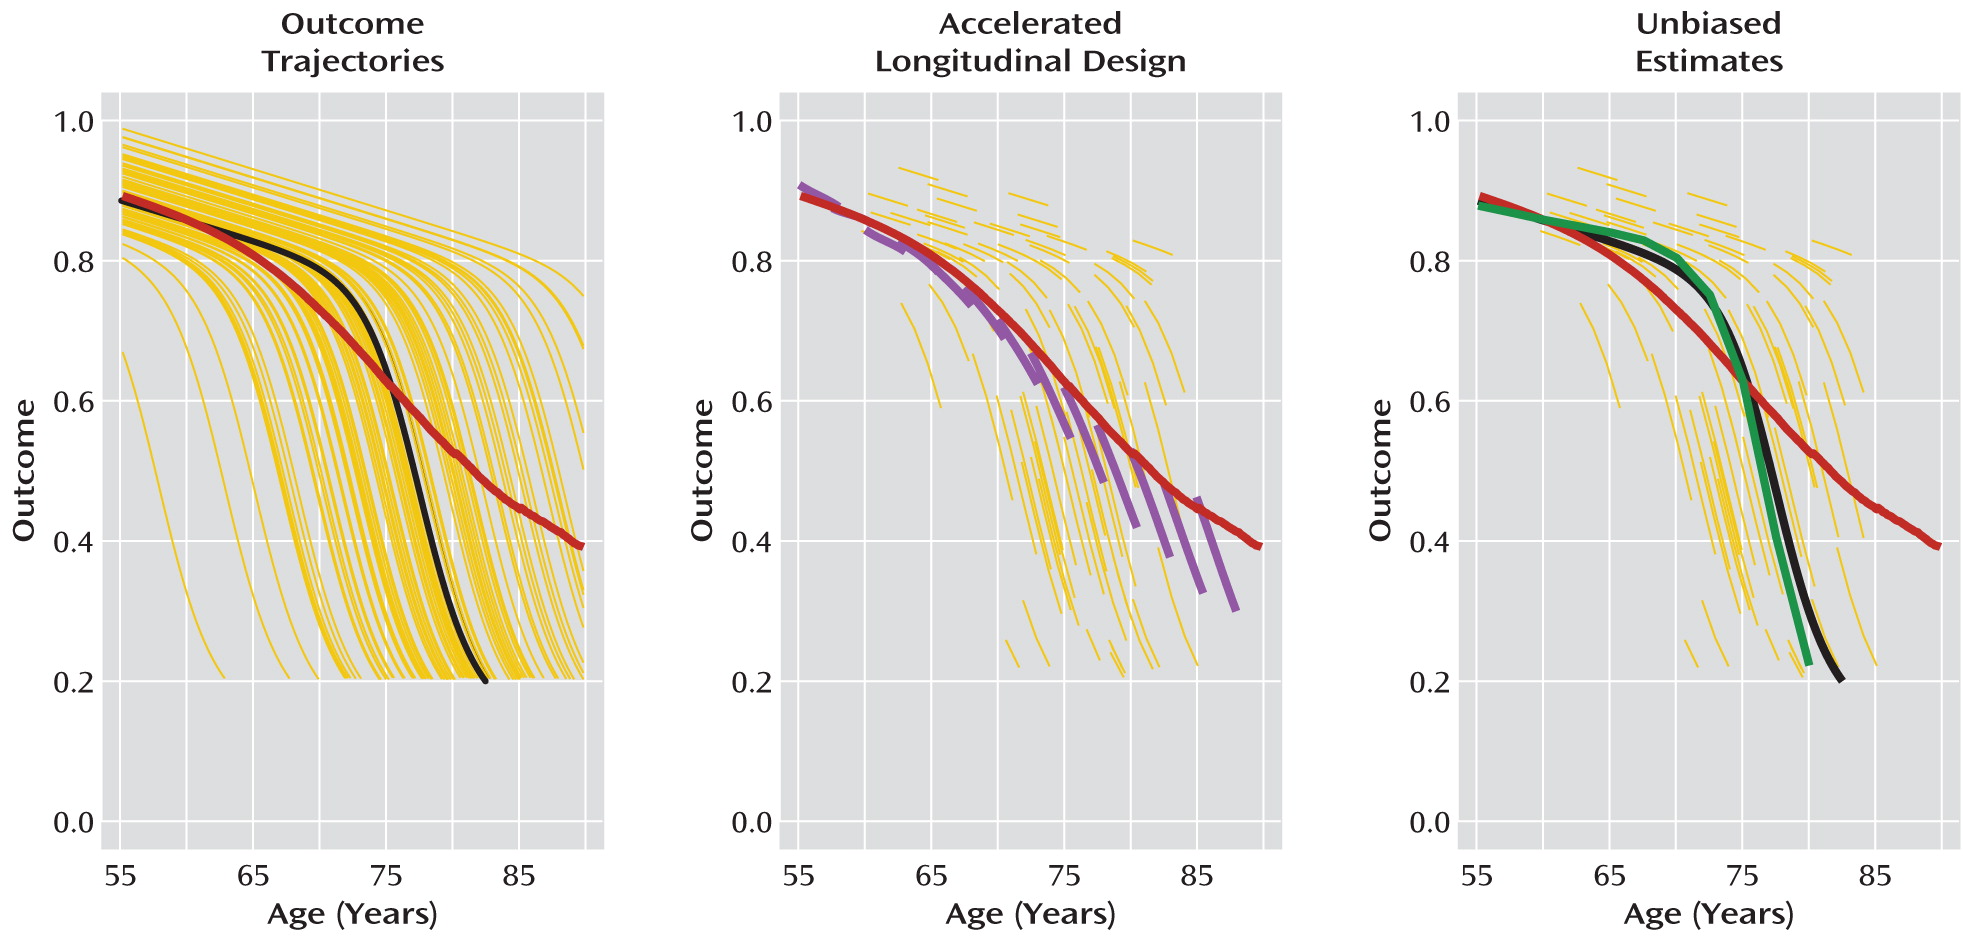
Figure 6, produced from simulated data, illustrates the potential advantages of a structured multicohort longitudinal design for characterizing illness trajectories. The left panel in the figure presents hypothetical nonlinear, nonparallel trajectories of illness from a population 55–90 years of age. These trajectories might represent, for example, the effects of aging on cortical thickness before and after onset of Alzheimer's disease, with patients too disabled to participate in the study when cortical thickness declines below a certain level. The heavy black line corresponds to a “typical” trajectory. It has the same shape as other trajectories and has the population median onset time. In contrast, computing the average value of outcomes at each age (heavy red line) produces an average trajectory estimate that does not have the characteristic shape of any individual trajectory. This is caused by nonparallel illness trajectories and worsened by the healthy survivor effect.
The middle panel of
Figure 6 shows data from an accelerated longitudinal design obtained from these population trajectories. In this design, departures of individual patient trajectory slopes from the average trajectory estimate appear as age cohort effects. These age cohort effects can be used to help reconstruct typical trajectories by fitting curves that minimize cohort effects, as in the right-hand panel of
Figure 6. By repeating this analysis across age cohorts, a more accurate estimate of the individual trajectory shapes and timing of disease onset can be obtained. If additional patient-level information, such as genetic or other biomarkers, is obtained, it can be used to help further explain observed between-subject variation in the shape or timing of illness trajectories.
Challenges in Using Multicohort Longitudinal Designs
Multicohort longitudinal designs are optimal in many situations, but they also bring challenges that stem from observing only a small proportion of a given subject's developmental trajectory compared to the entire age range of interest. Cohort or sampling effects may be small and hard to detect in neighboring cohorts, yet may cumulatively have a large impact across the age range of the sample. Moreover, sampling criteria, either explicit or implicit, can strongly affect not only which subjects enter the study but also what portion of the developmental curve is observed, potentially limiting inferences to certain stages of development. For example, if all subjects are sampled after illness onset, it will be difficult to determine the nature of the pre-illness trajectories or factors leading to onset of illness. To accurately characterize the course of development after illness onset, it may be necessary to retroactively determine age at illness onset for each subject in a multicohort design and to model trajectories as a function of changing duration of illness as well as changing chronological age. A further complication arises if the systematic sampling across age cohorts does not reflect the prevalence of the disorder during the time frame of any specific age cohort. Of course, single-cohort longitudinal and unstructured multicohort designs face similar challenges, since there is no guarantee that patients selected into such studies represent the true prevalence of the disorder across different ages. An analytic approach that accounts for potential differences in illness trajectories between age cohorts can go a long way toward addressing these issues. Furthermore, if dropout is expected to be a problem in certain age cohorts, or if variation in illness trajectories is expected to be greater in one cohort than in another, these age cohorts can be oversampled to maximize the overall power to estimate trajectories reliably. In short, by implementing a carefully planned accelerated longitudinal design, the researcher can ensure good coverage across the entire age span of interest, thus maximizing the ability to disentangle the effects of age from effects due to age cohort, sampling, and nonlinear and nonparallel trajectories.
Conclusions
Despite the increased awareness of the importance of characterizing trajectories of change in psychiatric disorders, many psychiatric studies use approaches that do not lend themselves to the accurate characterization of such trajectories. Cross-sectional designs are particularly inadequate for this purpose (
9,
12). As we have described, even a perfectly designed and executed single-cohort longitudinal design is not without its methodological and practical constraints. Moreover, most longitudinal investigations in psychiatry are in fact unstructured multicohort longitudinal designs, and most psychiatric studies employing these designs do not formally consider the potential impact of age cohort and sampling effects. Failure to consider cohort effects not only leads to mischaracterization of trajectories but also results in a missed opportunity to more fully understand the onset and course of psychiatric illnesses.
Despite their use in developmental psychology, structured designs such as accelerated longitudinal designs, which address many of these issues, have been utilized far less often for the investigation of psychiatric disorders. Structured multicohort longitudinal designs, which systematically incorporate both within- and between-subject variation in age, are a significant improvement over cross-sectional and unstructured multicohort longitudinal designs for making developmental inferences and are more feasible to implement than single-cohort longitudinal designs. Because of the equal age cohort sizes and overlapping trajectories in an accelerated longitudinal design, age cohort and sampling effects are detected with more power and estimated with more accuracy across the entire age span of interest. A good strategy might be to begin the study of illness trajectories using structured multicohort longitudinal designs and to use results from these studies to guide a continuation to longer follow-up times for certain cohorts or to the implementation of new longitudinal studies over critical age spans suggested by the trajectories revealed by the multicohort design.
In sum, while multicohort longitudinal designs, even structured ones, are not a panacea for all methodological problems in characterizing illness trajectories, use of these designs, combined with a stronger focus on cohort effects, will go a long way toward providing the best estimates possible of the trajectories of psychiatric disorders and symptoms across the lifespan.
