The Origins of Cognitive Deficits in Victimized Children: Implications for Neuroscientists and Clinicians
Abstract
Objective:
Method:
Results:
Conclusions:
Method
Study 1: The Environmental-Risk Longitudinal Twin Study
Sample.
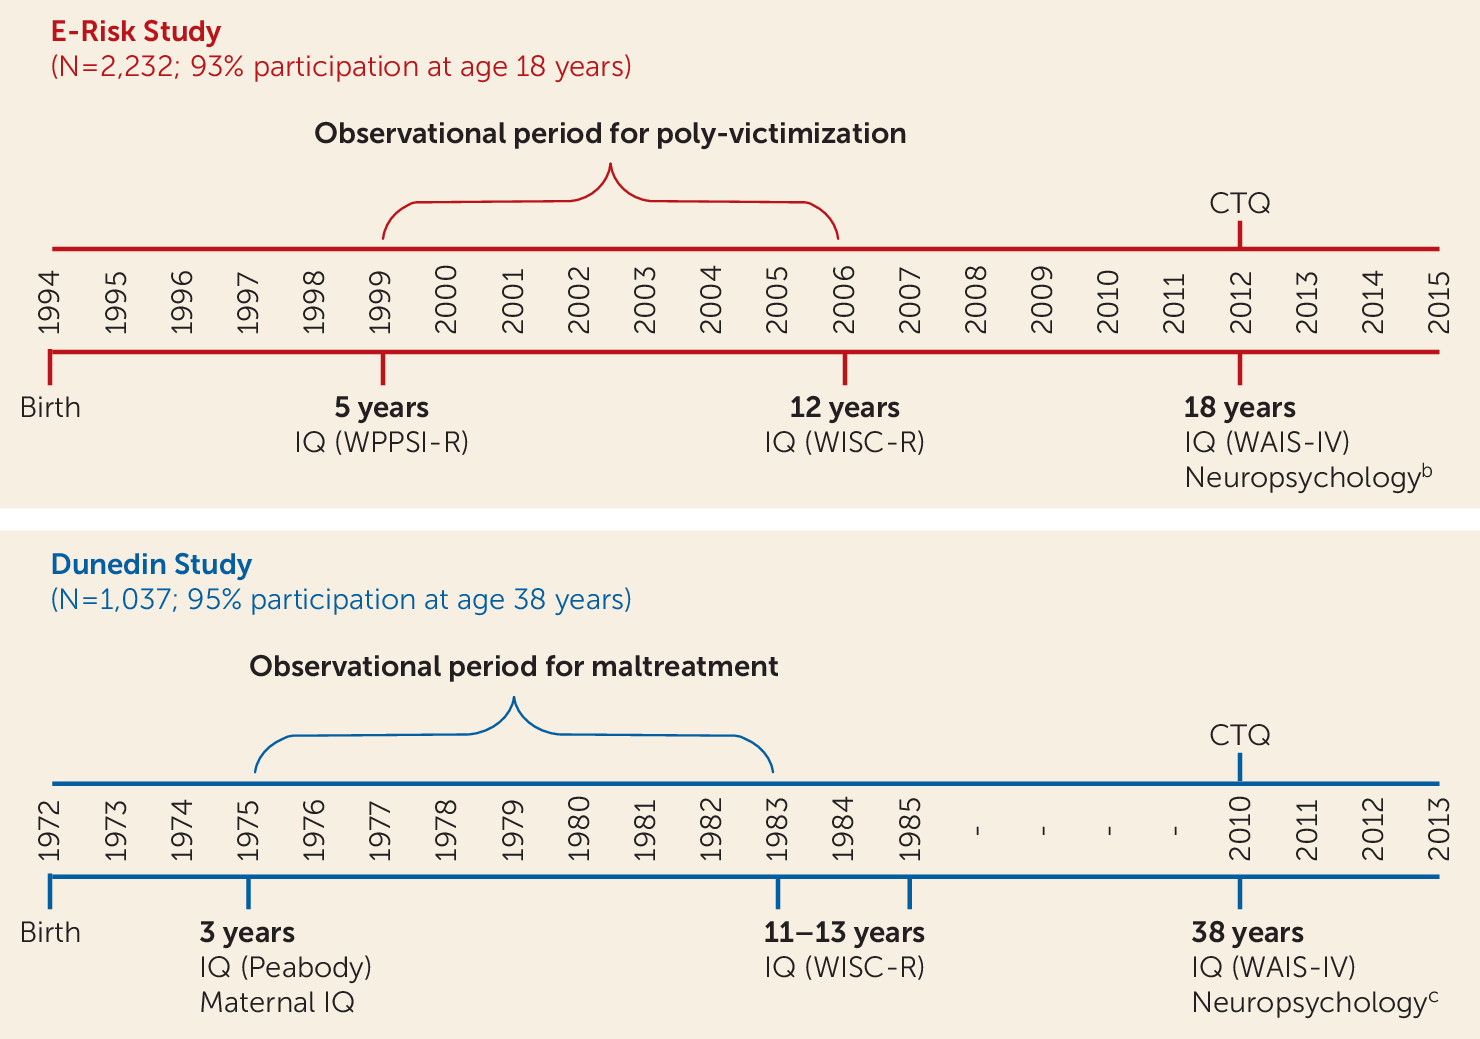
Childhood poly-victimization.
Cognitive testing.
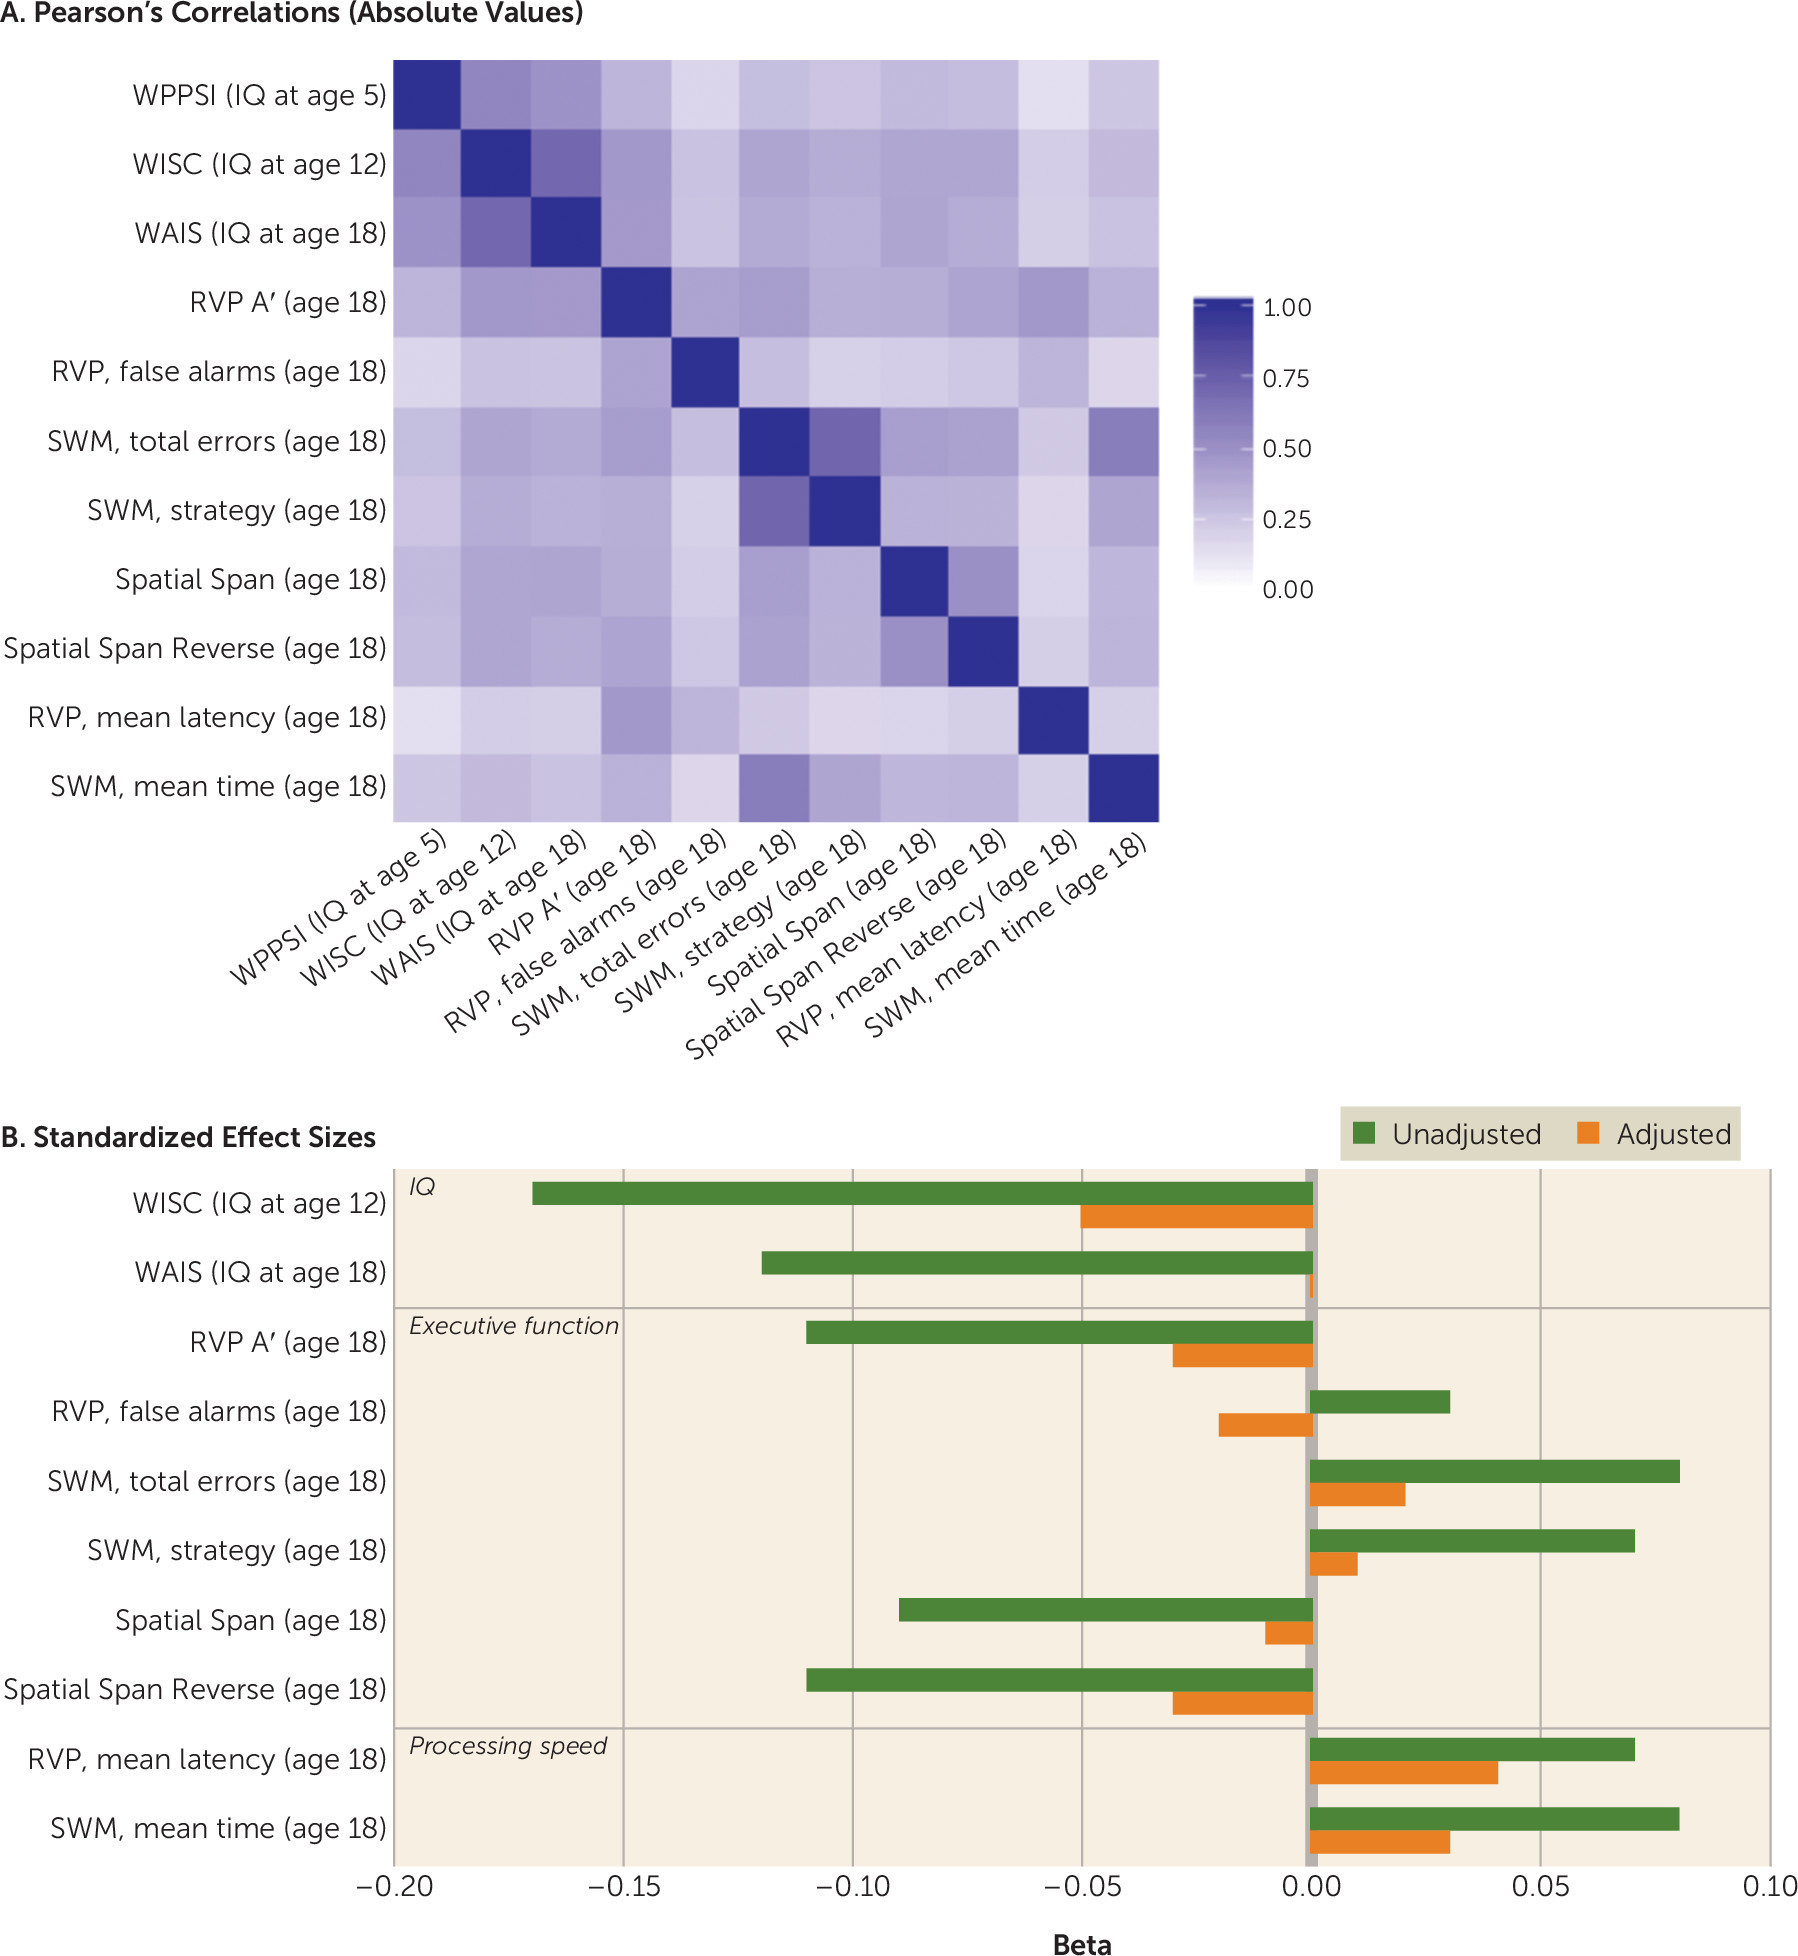
Statistical analysis.
Study 2: The Dunedin Longitudinal Study
Sample.
Childhood victimization.
Cognitive testing.
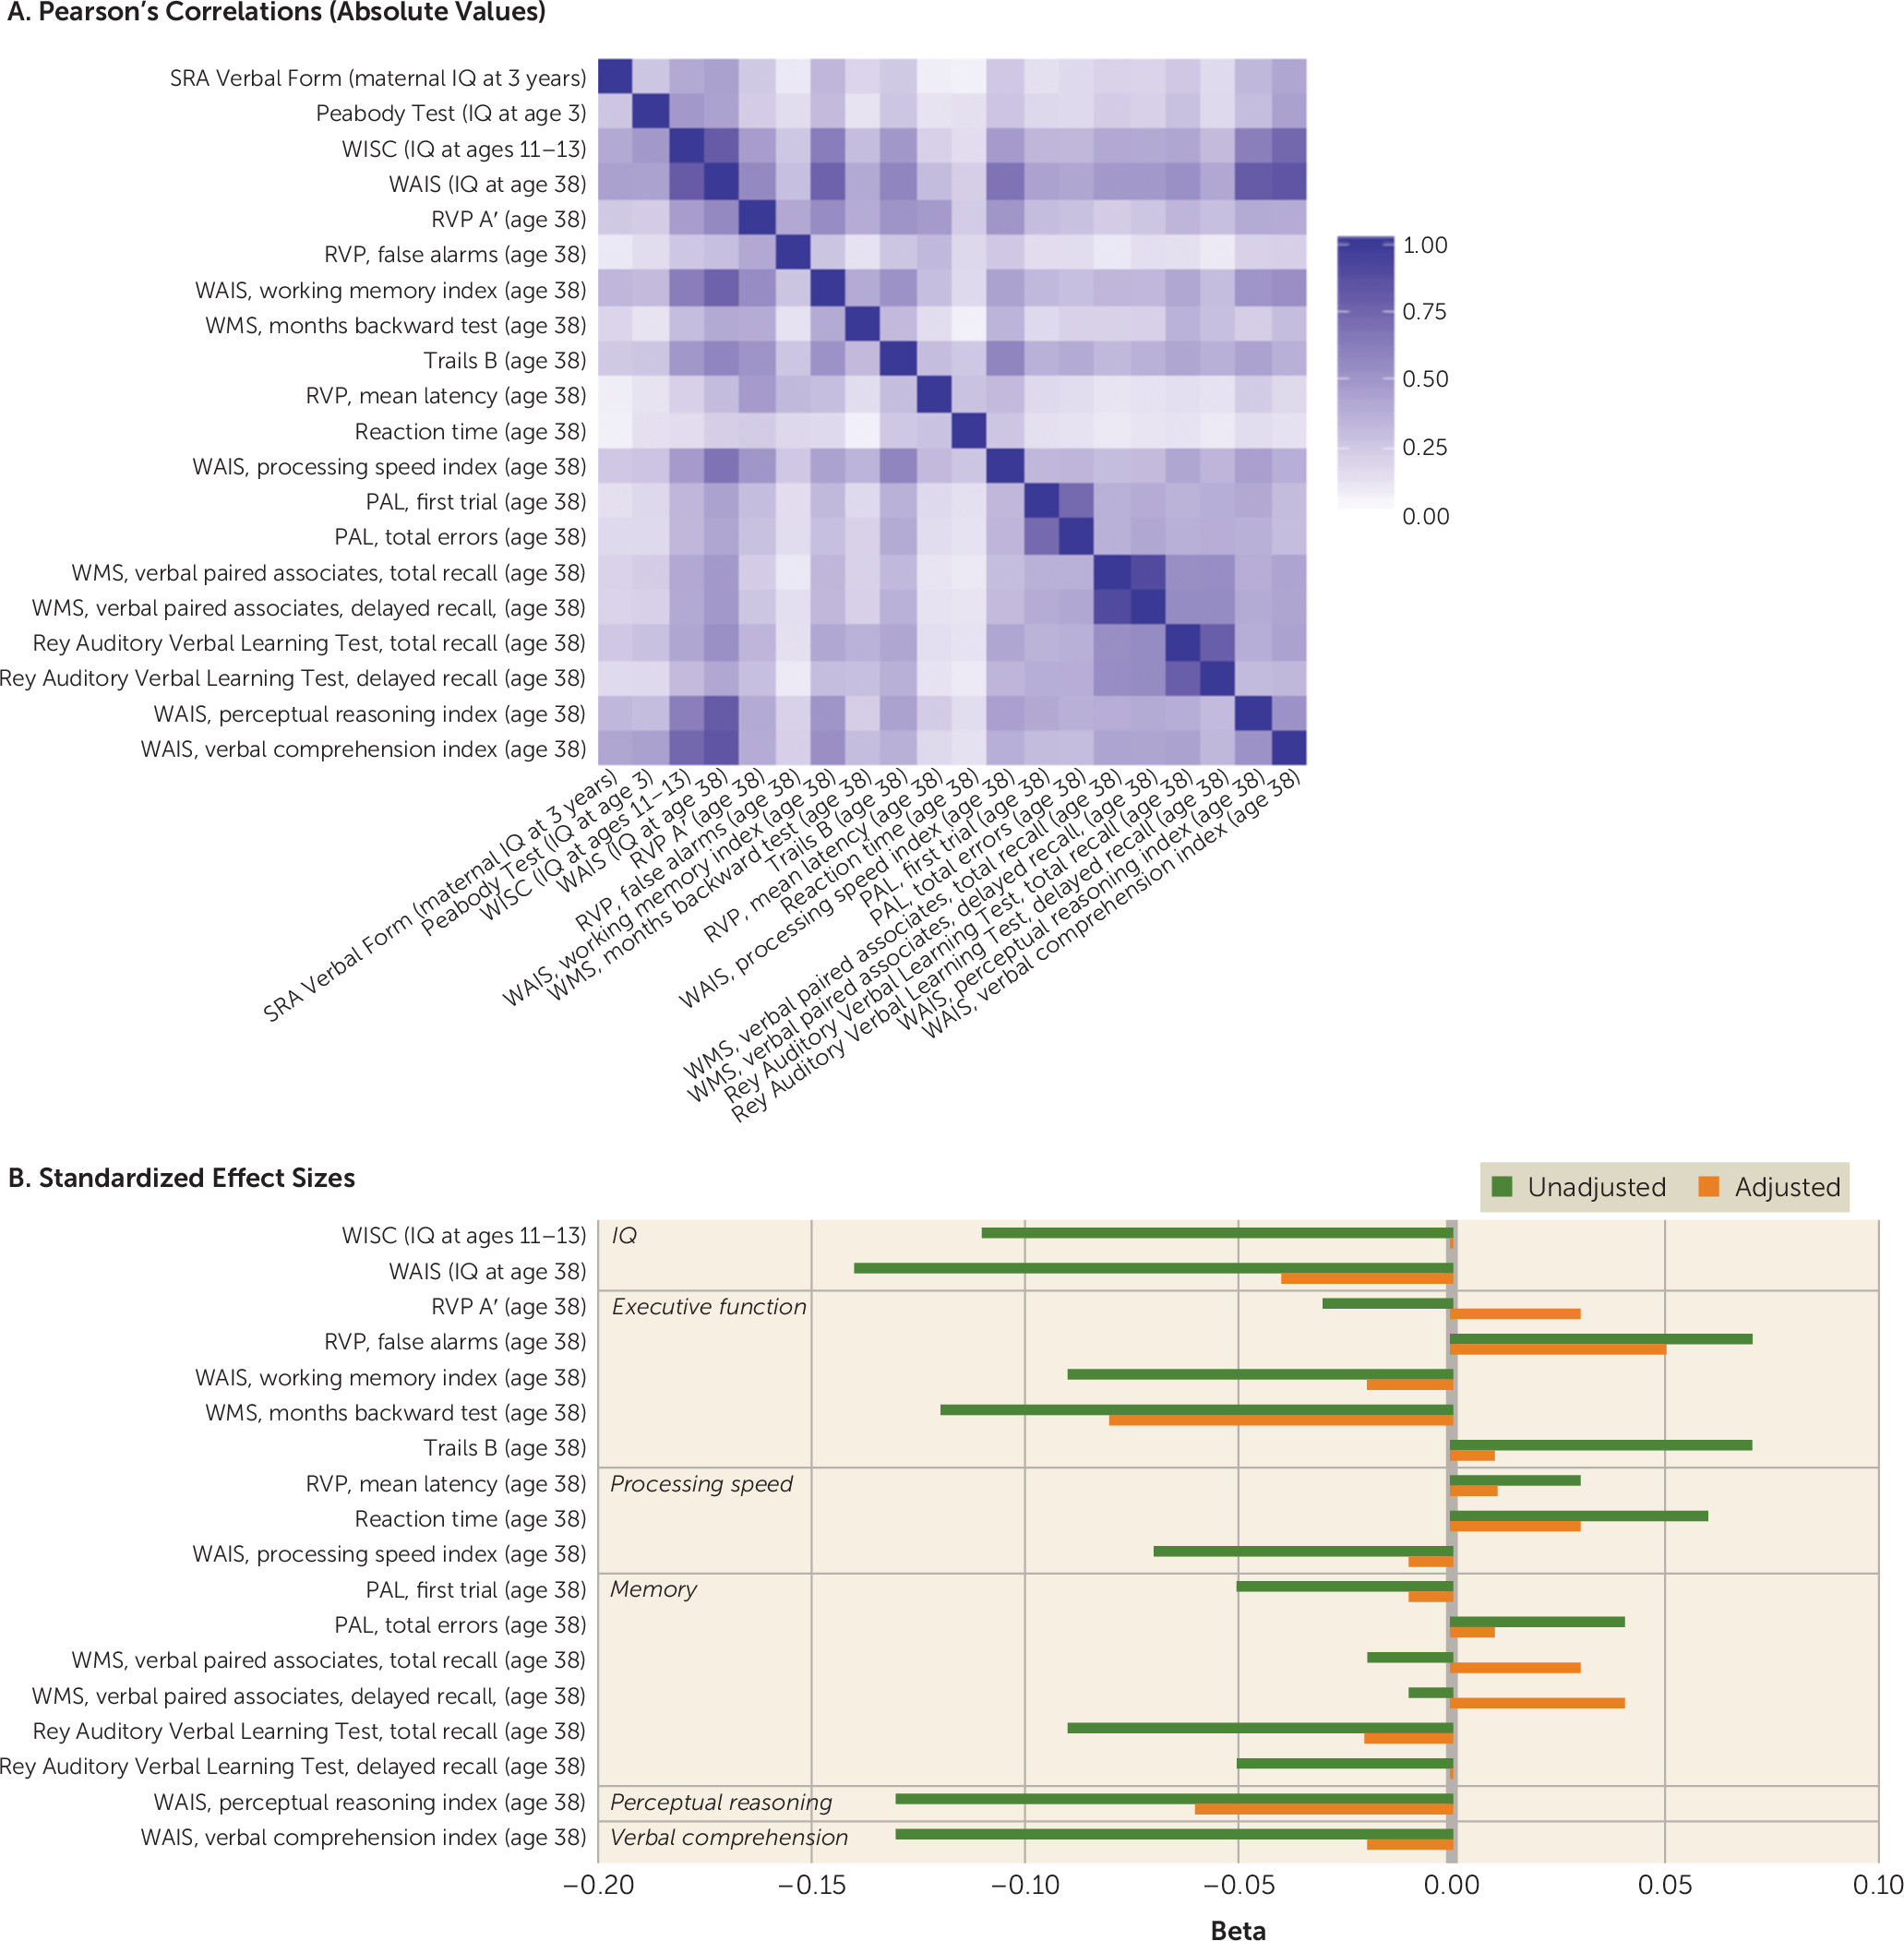
Statistical analysis.
Results
Study 1: The E-Risk Study
Does childhood victimization predict low IQ in adolescence?
| Model 1 | Model 2 | Model 3 | Model 4 | Omitted Variable Bias | |||||||||||
|---|---|---|---|---|---|---|---|---|---|---|---|---|---|---|---|
| Measure | b1 | SE | p | b2 | SE | p | b3 | SE | p | b4 | SE | p | b1–b4 | SE | p |
| IQ | |||||||||||||||
| A. WISC-R (IQ at age 12) (N=2,112) | |||||||||||||||
| Poly-victimization | –0.17 | 0.02 | <0.01 | –0.10 | 0.02 | <0.01 | –0.09 | 0.02 | <0.01 | –0.05 | 0.02 | 0.02 | –0.13 | 0.006 | <0.01 |
| IQ at age 5 | 0.45 | 0.02 | <0.01 | 0.44 | 0.02 | <0.01 | 0.38 | 0.02 | <0.01 | ||||||
| Family SES | 0.43 | 0.02 | <0.01 | 0.41 | 0.03 | <0.01 | 0.28 | 0.02 | <0.01 | ||||||
| B. WAIS-IV (IQ at age 18) (N=2,045) | |||||||||||||||
| Poly-victimization | –0.12 | 0.02 | <0.01 | –0.05 | 0.02 | 0.02 | –0.03 | 0.02 | 0.13 | 0.00 | 0.02 | 0.82 | –0.13 | 0.005 | <0.01 |
| IQ at age 5 | 0.42 | 0.02 | <0.01 | 0.41 | 0.02 | <0.01 | 0.34 | 0.02 | <0.01 | ||||||
| Family SES | 0.44 | 0.02 | <0.01 | 0.43 | 0.02 | <0.01 | 0.31 | 0.02 | <0.01 | ||||||
| Executive function | |||||||||||||||
| C. Rapid Visual Information Processing A′ (age 18) (N=2,042) | |||||||||||||||
| Poly-victimization | –0.11 | 0.02 | <0.01 | –0.05 | 0.02 | 0.02 | –0.06 | 0.02 | 0.02 | –0.03 | 0.02 | 0.23 | –0.08 | 0.005 | <0.01 |
| IQ at age 5 | 0.30 | 0.02 | <0.01 | 0.29 | 0.02 | <0.01 | 0.25 | 0.02 | <0.01 | ||||||
| Family SES | 0.25 | 0.02 | <0.01 | 0.23 | 0.03 | <0.01 | 0.15 | 0.03 | <0.01 | ||||||
| D. Rapid Visual Information Processing, false alarms (age 18) (N=2,044) | |||||||||||||||
| Poly-victimization | 0.03 | 0.02 | 0.15 | 0.00 | 0.02 | 0.95 | 0.00 | 0.02 | 0.99 | –0.02 | 0.02 | 0.46 | — | — | — |
| IQ at age 5 | –0.18 | 0.02 | <0.01 | –0.18 | 0.02 | <0.01 | –0.15 | 0.02 | <0.01 | ||||||
| Family SES | –0.14 | 0.02 | <0.01 | –0.14 | 0.02 | <0.01 | –0.09 | 0.03 | 0.01 | ||||||
| E. Spatial Working Memory, total errors (age 18) (N=2,044) | |||||||||||||||
| Poly-victimization | 0.08 | 0.02 | <0.01 | 0.03 | 0.02 | 0.15 | 0.04 | 0.03 | 0.08 | 0.02 | 0.02 | 0.45 | 0.06 | 0.006 | <0.01 |
| IQ at age 5 | –0.26 | 0.02 | <0.01 | –0.25 | 0.02 | <0.01 | –0.23 | 0.02 | <0.01 | ||||||
| Family SES | –0.18 | 0.03 | <0.01 | –0.17 | 0.03 | <0.01 | –0.09 | 0.03 | 0.01 | ||||||
| F. Spatial Working Memory, strategy (age 18) (N=2,044) | |||||||||||||||
| Poly-victimization | 0.07 | 0.02 | <0.01 | 0.03 | 0.02 | 0.24 | 0.04 | 0.02 | 0.15 | 0.01 | 0.02 | 0.62 | 0.06 | 0.005 | <0.01 |
| IQ at age 5 | –0.24 | 0.02 | <0.01 | –0.23 | 0.02 | <0.01 | –0.21 | 0.02 | <0.01 | ||||||
| Family SES | –0.17 | 0.02 | <0.01 | –0.16 | 0.03 | <0.01 | –0.09 | 0.03 | 0.01 | ||||||
| G. Spatial Span (age 18) (N=2,041) | |||||||||||||||
| Poly-victimization | –0.09 | 0.02 | <0.01 | –0.04 | 0.02 | 0.13 | –0.04 | 0.02 | 0.12 | –0.01 | 0.02 | 0.66 | –0.08 | 0.005 | <0.01 |
| IQ at age 5 | 0.29 | 0.02 | <0.01 | 0.28 | 0.02 | <0.01 | 0.24 | 0.02 | <0.01 | ||||||
| Family SES | 0.24 | 0.02 | <0.01 | 0.23 | 0.03 | <0.01 | 0.14 | 0.03 | <0.01 | ||||||
| H. Spatial Span Reversed (age 18) (N=2,034) | |||||||||||||||
| Poly-victimization | –0.11 | 0.02 | <0.01 | –0.06 | 0.02 | 0.02 | –0.06 | 0.02 | 0.02 | –0.03 | 0.02 | 0.15 | –0.07 | 0.005 | <0.01 |
| IQ at age 5 | 0.26 | 0.02 | <0.01 | 0.25 | 0.02 | <0.01 | 0.22 | 0.02 | <0.01 | ||||||
| Family SES | 0.22 | 0.02 | <0.01 | 0.20 | 0.03 | <0.01 | 0.13 | 0.03 | <0.01 | ||||||
| Processing speed | |||||||||||||||
| I. Rapid Visual Information Processing, mean latency (age 18) (N=2,042) | |||||||||||||||
| Poly-victimization | 0.07 | 0.02 | <0.01 | 0.05 | 0.02 | 0.05 | 0.05 | 0.02 | 0.04 | 0.04 | 0.02 | 0.13 | 0.04 | 0.006 | <0.01 |
| IQ at age 5 | –0.14 | 0.02 | <0.01 | –0.13 | 0.02 | <0.01 | –0.11 | 0.02 | <0.01 | ||||||
| Family SES | –0.11 | 0.02 | <0.01 | –0.10 | 0.02 | <0.01 | –0.06 | 0.03 | 0.02 | ||||||
| J. Spatial Working Memory, mean time (age 18) (N=2,044) | |||||||||||||||
| Poly-victimization | 0.08 | 0.02 | <0.01 | 0.03 | 0.02 | 0.16 | 0.05 | 0.03 | 0.03 | 0.03 | 0.02 | 0.22 | 0.05 | 0.006 | <0.01 |
| IQ at age 5 | –0.23 | 0.02 | <0.01 | –0.23 | 0.02 | <0.01 | –0.22 | 0.02 | <0.01 | ||||||
| Family SES | –0.11 | 0.03 | <0.01 | –0.10 | 0.03 | <0.01 | –0.02 | 0.03 | 0.41 | ||||||
Does childhood victimization predict low IQ in young adulthood?
Does childhood victimization predict impaired cognitive functions in young adulthood?
Does childhood victimization predict cognitive deficits in those not victimized before age 5?
Do differences in childhood victimization predict differences in cognitive function within sibling pairs?
| Dizygotic and Monozygotic Twin Pairs (Npairs=1,003–1,061) | Monozygotic Twin Pairs (Npairs=556–578) | Dizygotic Twin Pairs (Npairs=447–483) | ||||
|---|---|---|---|---|---|---|
| Measure | r | p | r | p | r | p |
| IQ | ||||||
| WISC-R (IQ at age 12) | –0.066 | 0.032 | –0.020 | 0.636 | –0.100 | 0.028 |
| WAIS-IV (IQ at age 18) | –0.020 | 0.529 | –0.066 | 0.120 | 0.016 | 0.737 |
| Executive function | ||||||
| Rapid Visual Information Processing A′ (at age 18) | –0.045 | 0.157 | –0.039 | 0.363 | –0.051 | 0.283 |
| Rapid Visual Information Processing, false alarms (at age 18) | –0.021 | 0.515 | –0.024 | 0.570 | –0.016 | 0.741 |
| Spatial Working Memory, total errors (at age 18) | –0.004 | 0.891 | 0.022 | 0.610 | –0.028 | 0.548 |
| Spatial Working Memory, strategy (at age 18) | –0.009 | 0.773 | 0.017 | 0.685 | –0.035 | 0.458 |
| Spatial Span (at age 18) | 0.011 | 0.724 | 0.003 | 0.938 | 0.017 | 0.716 |
| Spatial Span Reversed (at age 18) | –0.023 | 0.477 | 0.007 | 0.867 | –0.048 | 0.309 |
| Processing speed | ||||||
| Rapid Visual Information Processing, mean latency (at age 18) | 0.037 | 0.240 | 0.059 | 0.165 | 0.017 | 0.713 |
| Spatial Working Memory, mean time (at age 18) | –0.023 | 0.457 | –0.037 | 0.385 | –0.013 | 0.776 |
Are retrospective reports of childhood victimization in young adulthood associated with low IQ and impaired cognitive functions?
Study 2: The Dunedin Study
Does childhood victimization predict low IQ in adolescence?
| Model 1 | Model 2 | Model 3 | Model 4 | Model 5 | Omitted Variable Bias | |||||||||||||
|---|---|---|---|---|---|---|---|---|---|---|---|---|---|---|---|---|---|---|
| Measure | b1 | SE | p | b2 | SE | p | b3 | SE | p | b4 | SE | p | b5 | SE | p | b1–b5 | SE | p |
| IQ | ||||||||||||||||||
| A. WISC-R (IQ at ages 11–13) (N=899) | ||||||||||||||||||
| Child maltreatment | –0.11 | 0.03 | <0.01 | –0.06 | 0.03 | 0.06 | –0.05 | 0.03 | 0.07 | –0.04 | 0.03 | 0.17 | 0.00 | 0.03 | 0.89 | –0.10 | 0.005 | <0.01 |
| Maternal IQ | 0.40 | 0.03 | <0.01 | 0.39 | 0.03 | <0.01 | 0.23 | 0.03 | <0.01 | |||||||||
| IQ at age 3 | 0.48 | 0.03 | <0.01 | 0.47 | 0.03 | <0.01 | 0.36 | 0.03 | <0.01 | |||||||||
| Family SES | 0.39 | 0.03 | <0.01 | 0.38 | 0.03 | <0.01 | 0.20 | 0.03 | <0.01 | |||||||||
| B. WAIS-IV (IQ at age 38) (N=913) | ||||||||||||||||||
| Child maltreatment | –0.14 | 0.03 | <0.01 | –0.08 | 0.03 | <0.01 | –0.08 | 0.03 | <0.01 | –0.08 | 0.03 | 0.01 | –0.04 | 0.03 | 0.21 | –0.10 | 0.005 | <0.01 |
| Maternal IQ | 0.44 | 0.03 | <0.01 | 0.43 | 0.03 | <0.01 | 0.30 | 0.03 | <0.01 | |||||||||
| IQ at age 3 | 0.43 | 0.03 | <0.01 | 0.42 | 0.03 | <0.01 | 0.30 | 0.03 | <0.01 | |||||||||
| Family SES | 0.38 | 0.03 | <0.01 | 0.37 | 0.03 | <0.01 | 0.17 | 0.03 | <0.01 | |||||||||
| Executive function | ||||||||||||||||||
| C. Rapid Visual Information Processing A′ (age 38) (N=890) | ||||||||||||||||||
| Child maltreatment | –0.03 | 0.03 | 0.44 | 0.01 | 0.03 | 0.85 | 0.00 | 0.03 | 0.99 | 0.00 | 0.03 | 0.95 | 0.03 | 0.03 | 0.41 | — | — | — |
| Maternal IQ | 0.24 | 0.03 | <0.01 | 0.24 | 0.03 | <0.01 | 0.18 | 0.04 | <0.01 | |||||||||
| IQ at age 3 | 0.22 | 0.03 | <0.01 | 0.22 | 0.03 | <0.01 | 0.16 | 0.04 | <0.01 | |||||||||
| Family SES | 0.17 | 0.03 | <0.01 | 0.17 | 0.03 | <0.01 | 0.06 | 0.04 | 0.11 | |||||||||
| D. Rapid Visual Information Processing, false alarms (age 18) (N=895) | ||||||||||||||||||
| Child maltreatment | 0.07 | 0.03 | 0.04 | 0.06 | 0.03 | 0.09 | 0.05 | 0.03 | 0.13 | 0.06 | 0.03 | 0.08 | 0.05 | 0.03 | 0.17 | 0.02 | 0.006 | <0.01 |
| Maternal IQ | –0.09 | 0.03 | <0.01 | –0.09 | 0.03 | 0.01 | –0.06 | 0.04 | 0.11 | |||||||||
| IQ at age 3 | –0.15 | 0.03 | <0.01 | –0.14 | 0.03 | <0.01 | –0.13 | 0.04 | <0.01 | |||||||||
| Family SES | –0.06 | 0.03 | 0.10 | –0.05 | 0.03 | 0.18 | 0.01 | 0.04 | 0.71 | |||||||||
| E. WAIS-IV, working memory index (age 38) (N=910) | ||||||||||||||||||
| Child maltreatment | –0.09 | 0.03 | <0.01 | –0.05 | 0.03 | 0.09 | –0.06 | 0.03 | 0.07 | –0.05 | 0.03 | 0.13 | –0.02 | 0.03 | 0.56 | –0.08 | 0.006 | <0.01 |
| Maternal IQ | 0.34 | 0.03 | <0.01 | 0.33 | 0.03 | <0.01 | 0.23 | 0.03 | <0.01 | |||||||||
| IQ at age 3 | 0.31 | 0.03 | <0.01 | 0.30 | 0.03 | <0.01 | 0.21 | 0.03 | <0.01 | |||||||||
| Family SES | 0.29 | 0.03 | <0.01 | 0.28 | 0.03 | <0.01 | 0.14 | 0.03 | <0.01 | |||||||||
| F. Wechsler Memory Scale–III, months backward test (age 38) (N=911) | ||||||||||||||||||
| Child maltreatment | –0.12 | 0.03 | <0.01 | –0.10 | 0.03 | <0.01 | –0.11 | 0.03 | <0.01 | –0.09 | 0.03 | <0.01 | –0.08 | 0.03 | 0.01 | –0.04 | 0.006 | <0.01 |
| Maternal IQ | 0.19 | 0.03 | <0.01 | 0.18 | 0.03 | <0.01 | 0.13 | 0.04 | <0.01 | |||||||||
| IQ at age 3 | 0.12 | 0.03 | <0.01 | 0.11 | 0.03 | <0.01 | 0.05 | 0.04 | 0.18 | |||||||||
| Family SES | 0.18 | 0.03 | <0.01 | 0.16 | 0.03 | <0.01 | 0.10 | 0.04 | <0.01 | |||||||||
| G. Trail Making Test, part B (age 38) (N=909) | ||||||||||||||||||
| Child maltreatment | 0.07 | 0.03 | 0.05 | 0.04 | 0.03 | 0.25 | 0.04 | 0.03 | 0.27 | 0.04 | 0.03 | 0.23 | 0.01 | 0.03 | 0.67 | 0.05 | 0.006 | <0.01 |
| Maternal IQ | –0.24 | 0.03 | <0.01 | –0.24 | 0.03 | <0.01 | –0.17 | 0.03 | <0.01 | |||||||||
| IQ at age 3 | –0.26 | 0.03 | <0.01 | –0.26 | 0.03 | <0.01 | –0.20 | 0.03 | <0.01 | |||||||||
| Family SES | –0.18 | 0.03 | <0.01 | –0.17 | 0.03 | <0.01 | –0.05 | 0.04 | 0.14 | |||||||||
| Processing speed | ||||||||||||||||||
| H. Rapid Visual Information Processing, mean latency (age 38) (N=890) | ||||||||||||||||||
| Child maltreatment | 0.03 | 0.03 | 0.45 | 0.02 | 0.03 | 0.65 | 0.01 | 0.03 | 0.74 | 0.02 | 0.03 | 0.55 | 0.01 | 0.03 | 0.80 | — | — | — |
| Maternal IQ | –0.08 | 0.03 | 0.02 | –0.07 | 0.03 | 0.03 | –0.06 | 0.04 | 0.13 | |||||||||
| IQ at age 3 | –0.12 | 0.03 | <0.01 | –0.11 | 0.03 | <0.01 | –0.11 | 0.04 | <0.01 | |||||||||
| Family SES | –0.03 | 0.03 | 0.35 | –0.03 | 0.03 | 0.42 | 0.02 | 0.04 | 0.51 | |||||||||
| I. Reaction time index (age 38) (N=895) | ||||||||||||||||||
| Child maltreatment | 0.06 | 0.03 | 0.08 | 0.05 | 0.03 | 0.15 | 0.04 | 0.03 | 0.21 | 0.04 | 0.03 | 0.20 | 0.03 | 0.03 | 0.33 | — | — | — |
| Maternal IQ | –0.08 | 0.03 | 0.02 | –0.07 | 0.03 | 0.04 | –0.03 | 0.04 | 0.47 | |||||||||
| IQ at age 3 | –0.13 | 0.03 | <0.01 | –0.13 | 0.03 | <0.01 | –0.11 | 0.04 | <0.01 | |||||||||
| Family SES | –0.10 | 0.03 | <0.01 | –0.09 | 0.03 | <0.01 | –0.05 | 0.04 | 0.18 | |||||||||
| J. WAIS-IV, processing speed index (age 38) (N=912) | ||||||||||||||||||
| Child maltreatment | –0.07 | 0.03 | 0.04 | –0.04 | 0.03 | 0.26 | –0.03 | 0.03 | 0.29 | –0.04 | 0.03 | 0.24 | –0.01 | 0.03 | 0.73 | –0.06 | 0.006 | <0.01 |
| Maternal IQ | 0.25 | 0.03 | <0.01 | 0.24 | 0.03 | <0.01 | 0.18 | 0.03 | <0.01 | |||||||||
| IQ at age 3 | 0.27 | 0.03 | <0.01 | 0.26 | 0.03 | <0.01 | 0.21 | 0.03 | <0.01 | |||||||||
| Family SES | 0.18 | 0.03 | <0.01 | 0.17 | 0.03 | <0.01 | 0.05 | 0.04 | 0.15 | |||||||||
| Memory | ||||||||||||||||||
| K. Paired Associates Learning, first trial (age 38) (N=898) | ||||||||||||||||||
| Child maltreatment | –0.05 | 0.03 | 0.17 | –0.03 | 0.03 | 0.41 | –0.03 | 0.03 | 0.44 | –0.03 | 0.03 | 0.37 | –0.01 | 0.03 | 0.69 | — | — | — |
| Maternal IQ | 0.14 | 0.03 | <0.01 | 0.14 | 0.03 | <0.01 | 0.10 | 0.04 | <0.01 | |||||||||
| IQ at age 3 | 0.17 | 0.03 | <0.01 | 0.17 | 0.03 | <0.01 | 0.14 | 0.04 | <0.01 | |||||||||
| Family SES | 0.10 | 0.03 | <0.01 | 0.10 | 0.03 | <0.01 | 0.02 | 0.04 | 0.57 | |||||||||
| L. Paired Associates Learning, total errors (age 38) (N=898) | ||||||||||||||||||
| Child maltreatment | 0.04 | 0.03 | 0.19 | 0.02 | 0.03 | 0.50 | 0.03 | 0.03 | 0.45 | 0.03 | 0.03 | 0.39 | 0.01 | 0.03 | 0.75 | — | — | — |
| Maternal IQ | –0.17 | 0.03 | <0.01 | –0.16 | 0.03 | <0.01 | –0.13 | 0.04 | <0.01 | |||||||||
| IQ at age 3 | –0.16 | 0.03 | <0.01 | –0.16 | 0.03 | <0.01 | –0.12 | 0.04 | <0.01 | |||||||||
| Family SES | –0.10 | 0.03 | <0.01 | –0.09 | 0.03 | <0.01 | –0.01 | 0.04 | 0.77 | |||||||||
| M. Wechsler Memory Scale–III, verbal paired associates, total recall (age 38) (N=911) | ||||||||||||||||||
| Child maltreatment | –0.02 | 0.03 | 0.56 | 0.01 | 0.03 | 0.87 | 0.01 | 0.03 | 0.83 | 0.02 | 0.03 | 0.64 | 0.03 | 0.03 | 0.29 | — | — | — |
| Maternal IQ | 0.20 | 0.03 | <0.01 | 0.20 | 0.03 | <0.01 | 0.12 | 0.04 | <0.01 | |||||||||
| IQ at age 3 | 0.22 | 0.03 | <0.01 | 0.22 | 0.03 | <0.01 | 0.15 | 0.03 | <0.01 | |||||||||
| Family SES | 0.22 | 0.03 | <0.01 | 0.22 | 0.03 | <0.01 | 0.13 | 0.04 | <0.01 | |||||||||
| N. Wechsler Memory Scale–III, verbal paired associates, delayed recall (age 38) (N=908) | ||||||||||||||||||
| Child maltreatment | –0.01 | 0.03 | 0.72 | 0.01 | 0.03 | 0.71 | 0.01 | 0.03 | 0.70 | 0.02 | 0.03 | 0.55 | 0.04 | 0.03 | 0.24 | — | — | — |
| Maternal IQ | 0.19 | 0.03 | <0.01 | 0.19 | 0.03 | <0.01 | 0.12 | 0.04 | <0.01 | |||||||||
| IQ at age 3 | 0.20 | 0.03 | <0.01 | 0.20 | 0.03 | <0.01 | 0.14 | 0.04 | <0.01 | |||||||||
| Family SES | 0.20 | 0.03 | <0.01 | 0.20 | 0.03 | <0.01 | 0.12 | 0.04 | <0.01 | |||||||||
| O. Rey Auditory Verbal Learning Test, total recall (age 38) (N=910) | ||||||||||||||||||
| Child maltreatment | –0.09 | 0.03 | <0.01 | –0.06 | 0.03 | 0.08 | –0.05 | 0.03 | 0.09 | –0.05 | 0.03 | 0.14 | –0.02 | 0.03 | 0.45 | –0.06 | 0.006 | <0.01 |
| Maternal IQ | 0.25 | 0.03 | <0.01 | 0.25 | 0.03 | <0.01 | 0.16 | 0.03 | <0.01 | |||||||||
| IQ at age 3 | 0.27 | 0.03 | <0.01 | 0.26 | 0.03 | <0.01 | 0.19 | 0.03 | <0.01 | |||||||||
| Family SES | 0.25 | 0.03 | <0.01 | 0.24 | 0.03 | <0.01 | 0.13 | 0.04 | <0.01 | |||||||||
| P. Rey Auditory Verbal Learning Test, delayed recall (age 38) (N=911) | ||||||||||||||||||
| Child maltreatment | –0.05 | 0.03 | 0.15 | –0.03 | 0.03 | 0.39 | –0.03 | 0.03 | 0.38 | –0.02 | 0.03 | 0.60 | 0.00 | 0.03 | 0.90 | — | — | — |
| Maternal IQ | 0.16 | 0.03 | <0.01 | 0.16 | 0.03 | <0.01 | 0.09 | 0.04 | 0.01 | |||||||||
| IQ at age 3 | 0.16 | 0.03 | <0.01 | 0.16 | 0.03 | <0.01 | 0.10 | 0.04 | <0.01 | |||||||||
| Family SES | 0.19 | 0.03 | <0.01 | 0.19 | 0.03 | <0.01 | 0.13 | 0.04 | <0.01 | |||||||||
| Perceptual reasoning | ||||||||||||||||||
| Q. WAIS-IV, perceptual reasoning index (age 38) (N=911) | ||||||||||||||||||
| Child maltreatment | –0.13 | 0.03 | <0.01 | –0.09 | 0.03 | <0.01 | –0.09 | 0.03 | <0.01 | –0.09 | 0.03 | <0.01 | –0.06 | 0.03 | 0.05 | –0.07 | 0.006 | <0.01 |
| Maternal IQ | 0.33 | 0.03 | <0.01 | 0.32 | 0.03 | <0.01 | 0.24 | 0.03 | <0.01 | |||||||||
| IQ at age 3 | 0.29 | 0.03 | <0.01 | 0.28 | 0.03 | <0.01 | 0.20 | 0.03 | <0.01 | |||||||||
| Family SES | 0.24 | 0.03 | <0.01 | 0.23 | 0.03 | <0.01 | 0.08 | 0.03 | 0.02 | |||||||||
| Verbal comprehension | ||||||||||||||||||
| R. WAIS-IV, verbal comprehension index (age 38) (N=913) | ||||||||||||||||||
| Child maltreatment | –0.13 | 0.03 | <0.01 | –0.08 | 0.03 | 0.01 | –0.07 | 0.03 | 0.01 | –0.06 | 0.03 | 0.04 | –0.02 | 0.03 | 0.39 | –0.10 | 0.005 | <0.01 |
| Maternal IQ | 0.42 | 0.03 | <0.01 | 0.41 | 0.03 | <0.01 | 0.26 | 0.03 | <0.01 | |||||||||
| IQ at age 3 | 0.44 | 0.03 | <0.01 | 0.43 | 0.03 | <0.01 | 0.30 | 0.03 | <0.01 | |||||||||
| Family SES | 0.41 | 0.03 | <0.01 | 0.40 | 0.03 | <0.01 | 0.21 | 0.03 | <0.01 | |||||||||
Does childhood victimization predict low IQ in midlife?
Does childhood victimization predict impaired cognitive functions in midlife?
Are reports of childhood victimization in midlife associated with low IQ and impaired cognitive functions?
Discussion
Supplementary Material
- View/Download
- 1.53 MB
References
Information & Authors
Information
Published In
History
Keywords
Authors
Competing Interests
Funding Information
Metrics & Citations
Metrics
Citations
Export Citations
If you have the appropriate software installed, you can download article citation data to the citation manager of your choice. Simply select your manager software from the list below and click Download.
For more information or tips please see 'Downloading to a citation manager' in the Help menu.
View Options
View options
PDF/EPUB
View PDF/EPUBLogin options
Already a subscriber? Access your subscription through your login credentials or your institution for full access to this article.
Personal login Institutional Login Open Athens loginNot a subscriber?
PsychiatryOnline subscription options offer access to the DSM-5-TR® library, books, journals, CME, and patient resources. This all-in-one virtual library provides psychiatrists and mental health professionals with key resources for diagnosis, treatment, research, and professional development.
Need more help? PsychiatryOnline Customer Service may be reached by emailing [email protected] or by calling 800-368-5777 (in the U.S.) or 703-907-7322 (outside the U.S.).
