Sixty Years of Placebo-Controlled Antipsychotic Drug Trials in Acute Schizophrenia: Systematic Review, Bayesian Meta-Analysis, and Meta-Regression of Efficacy Predictors
Abstract
Objective:
Method:
Results:
Conclusions:
Method
Inclusion/Exclusion Criteria
Participants.
Interventions.
Types of studies.
Search Strategy
Outcomes
Study Selection and Data Extraction
Statistical Synthesis of Study Results
Meta-Regression Analyses
Patient-related factors.
Drug-related factors.
Design-related factors.
Sensitivity Analyses of Primary Outcome
Publication Bias
Results
Description of Included Studies
Outcome Results


Change of Trial Characteristics Over Time
| Meta-Regression | ||||
|---|---|---|---|---|
| Explanatory Variable | Weighted Mean Publication Year | Number of Studies | Coefficient | 95% CrI |
| Study design factors | ||||
| Number of total participantsa | 105 | 79.77b | 58.50, 101.03 | |
| Number of sitesa | 96 | 12.22b | 9.57, 14.91 | |
| Academic sites (%)a | 59 | –13.75b | –19.75, –7.74 | |
| Baseline severity entry minimum scorea | ||||
| No (reference) | 1988 | 29 | ||
| Yes | 2008 | 73 | 2.52c | 1.18, 5.38 |
| Duration of washout period (days)a | 89 | –9.20b | –11.78, –6.62 | |
| Study duration (weeks)a | 96 | –0.92b | –1.33, –0.50 | |
| Randomization | ||||
| Low risk (reference) | 2007 | 48 | ||
| Unclear | 2006 | 57 | 0.80c | 0.53, 1.20 |
| Allocation concealment | ||||
| Low risk (reference) | 2008 | 33 | ||
| Unclear | 2006 | 72 | 0.76c | 0.48, 1.21 |
| Intention-to-treat analysis or completersa | ||||
| Intention-to-treat analysis (reference) | 2007 | 95 | ||
| Completers | 1981 | 7 | 0.21c | 0.11, 0.39 |
| Risk of bias due to missing outcome dataa | ||||
| Low risk (reference) | 2008 | 73 | ||
| Unclear | 2002 | 19 | 0.50c | 0.32, 0.81 |
| High risk | 2000 | 13 | 0.47c | 0.27, 0.82 |
| Blinding | ||||
| Low risk (reference) | 2007 | 57 | ||
| Unclear | 2006 | 48 | 0.80c | 0.52, 1.23 |
| High risk | — | — | — | |
| Number of arms | ||||
| Two arms (reference) | 2006 | 10 | ||
| More than two arms | 2007 | 95 | 1.11c | 0.74, 1.65 |
| Number of medications | ||||
| Two medications (reference) | 2009 | 33 | ||
| More than two medications | 2005 | 72 | 0.53c | 0.27, 1.02 |
| Industry-sponsored drug or not | ||||
| Nonsponsored drugs (reference) | 2006 | 32 | ||
| At least one sponsored drug | 2007 | 65 | 1.15c | 0.73, 1.81 |
| Percentage patients randomized to placebo | 105 | 0.00b | –0.04, 0.03 | |
| Scalea | ||||
| PANSS (reference) | 2009 | 68 | ||
| BPRS | 1990 | 33 | 0.02c | 0.00, 0.07 |
| Drug-related factors | ||||
| Drug mechanisma,d | ||||
| M1 (reference) | 1998 | 18 | ||
| M2 versus M1 | 1999 | 47 | 0.49c | 0.26, 0.92 |
| M3 versus M1 | 2012 | 12 | 14.79c | 2.74, 79.93 |
| M4 versus M1 | 2008 | 17 | 4.40c | 1.17, 16.51 |
| M5 versus M1 | 2007 | 7 | 4.79c | 0.65, 37.17 |
| Fixed or flexible dosea | ||||
| Fixed dose (reference) | 2008 | 79 | ||
| Flexible dose | 1997 | 26 | 0.38c | 0.24, 0.60 |
| Mean dose (chlorpromazine equivalents)a | 91 | –86.95b | –121.18, –52.71 | |
| Patient-related factors | ||||
| Percentage mena | 91 | 6.81b | 3.81, 9.82 | |
| Operationalized criteria or nota | ||||
| Operationalized (reference) | 2007 | 88 | ||
| Not operationalized | 1977 | 16 | 0.07c | 0.02, 0.20 |
| Countrya | ||||
| United States (reference) | 2002 | 45 | ||
| Other or mixed | 2008 | 60 | 2.32c | 1.37, 3.93 |
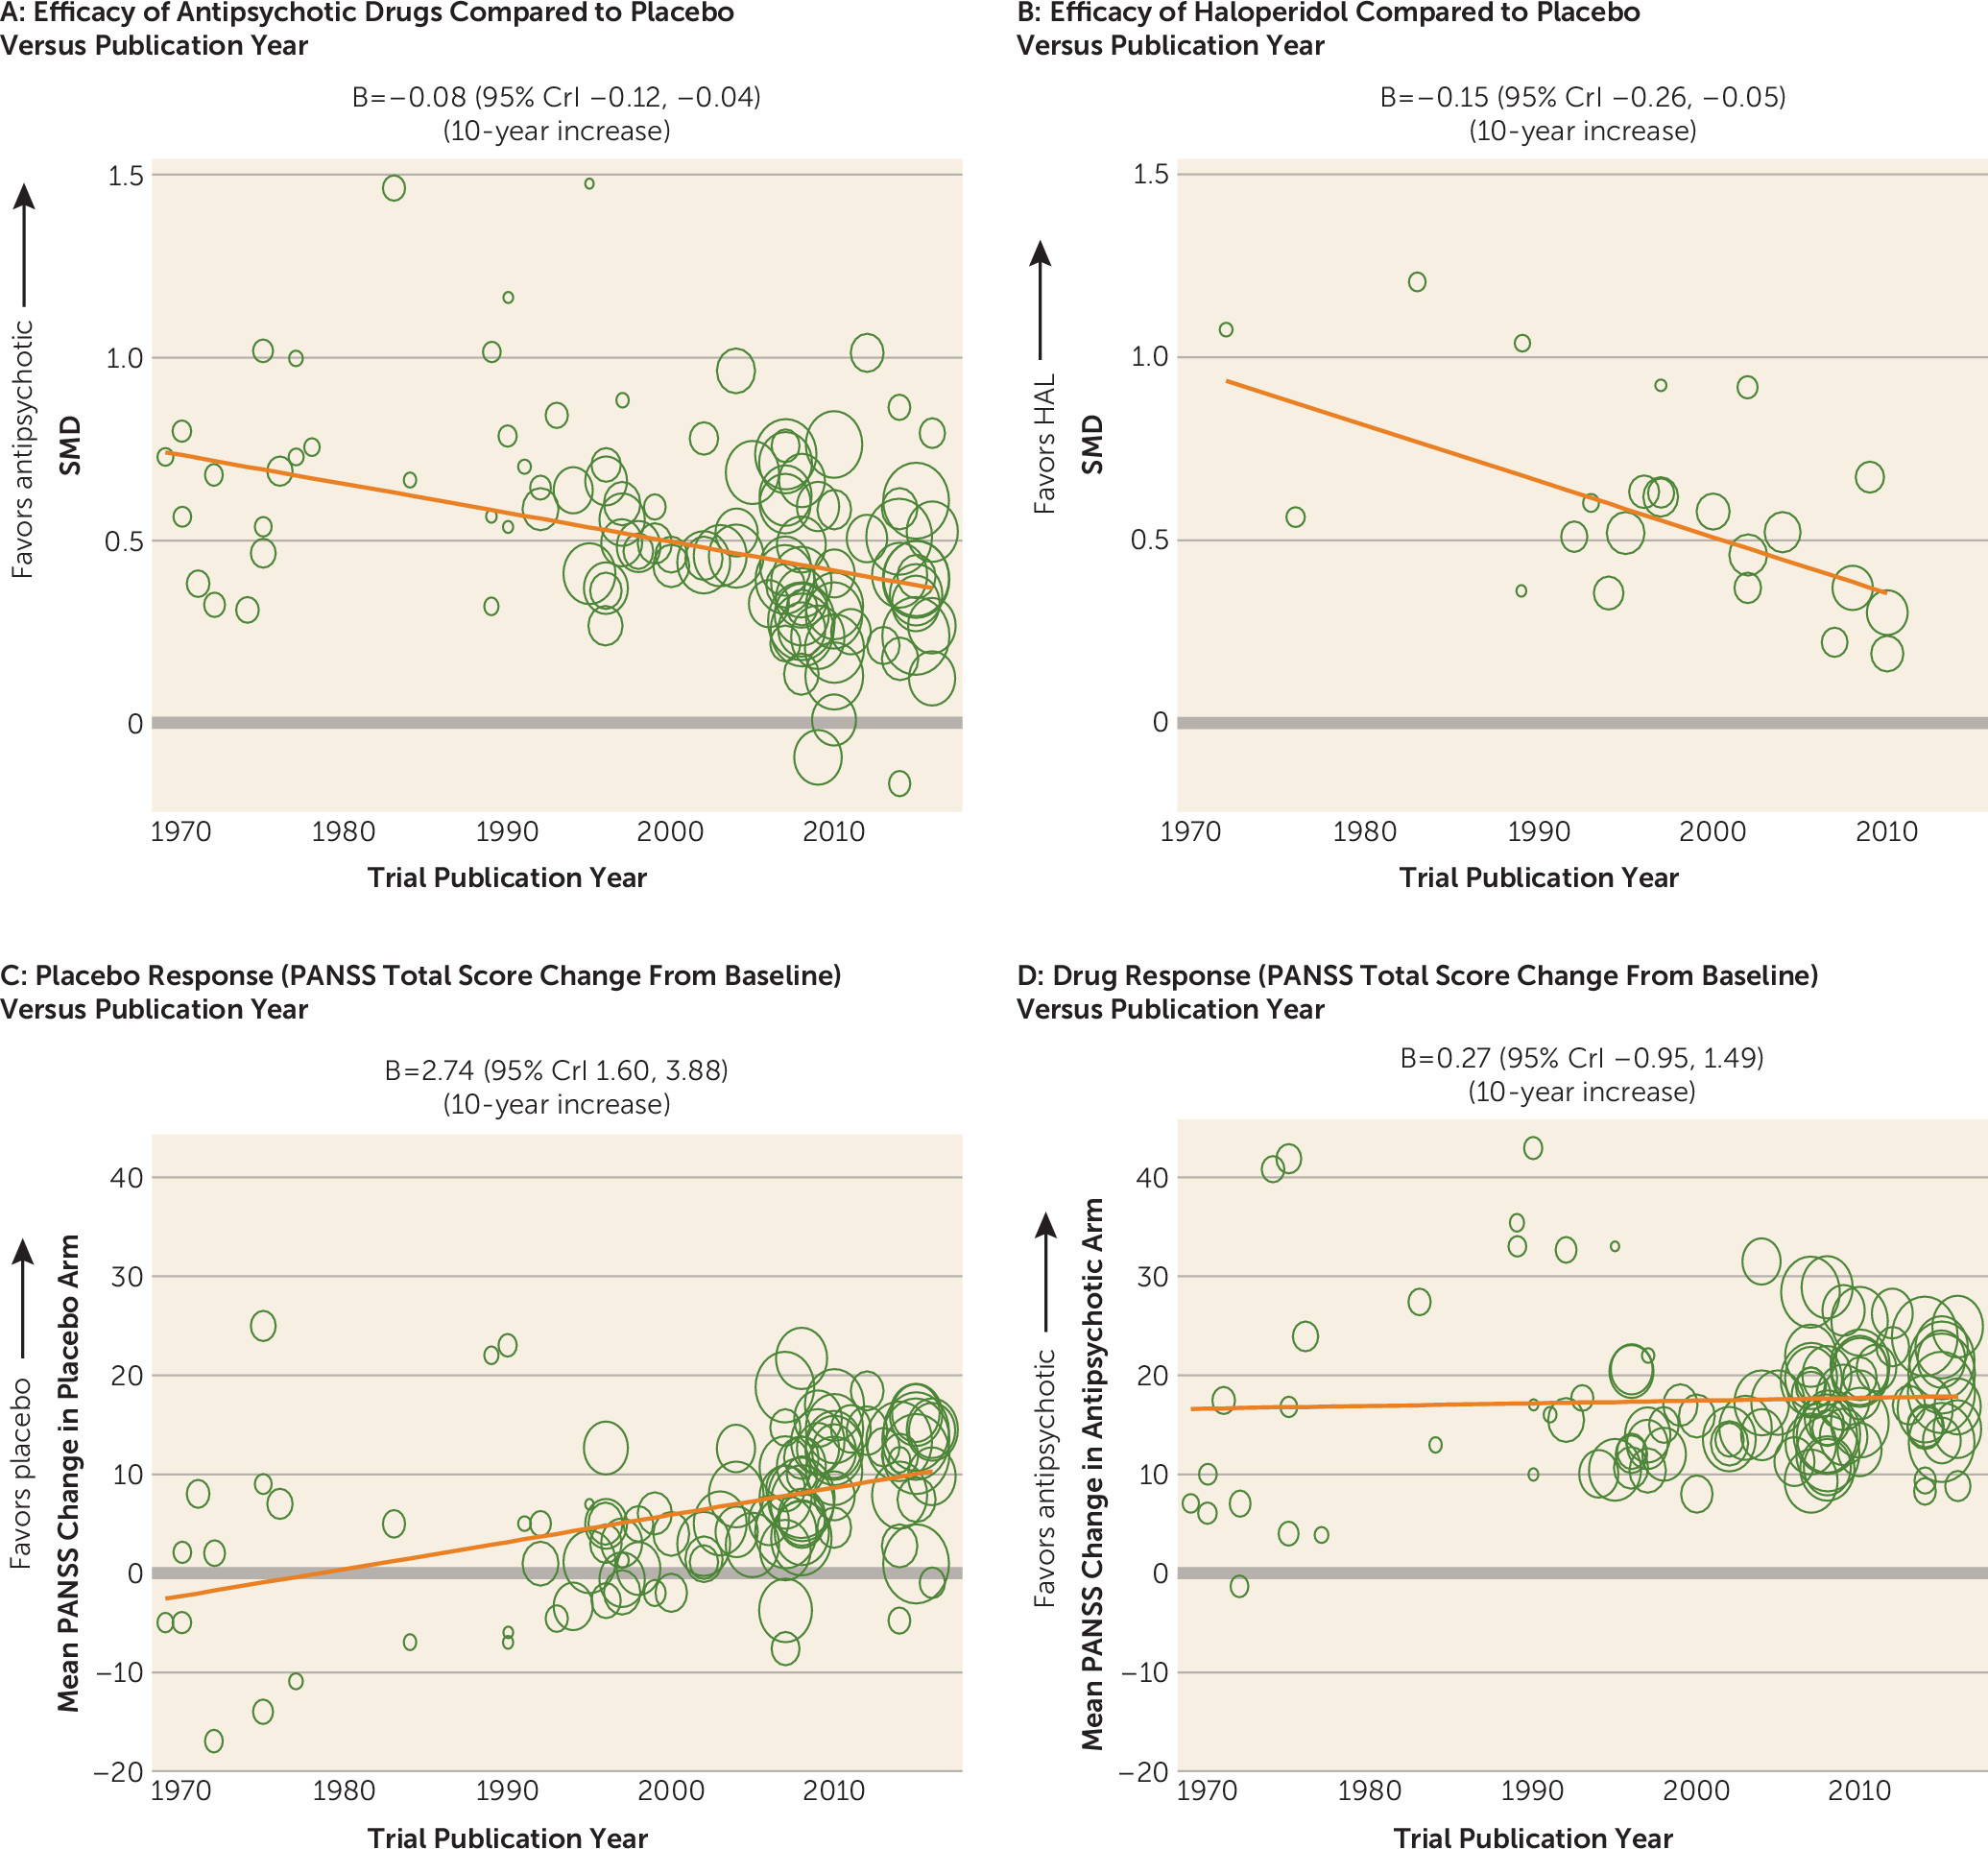
| Placebo responsea | 99 | 2.74b | 1.60, 3.88 | |
| Drug response | 100 | 0.27b | –0.95, 1.49 | |
| Average age | 100 | 0.64b | –0.08, 1.37 | |
| Duration of illness | 60 | 0.66b | –0.21, 1.53 | |
| Baseline severity (PANSS total score) | 85 | –0.48b | –1.57, 0.62 | |
Moderators of Antipsychotic Efficacy: Univariable Analysis
| Univariable Meta-Regression | SMD at Moderator Mean Value or Reference Categoryb | Heterogeneity SD | |||||||||
|---|---|---|---|---|---|---|---|---|---|---|---|
| Explanatory Variable | Coefficient | 95% CrI | Coefficient Corresponds toa | Number of Studies | N | SMD | 95% CrI | Moderator Mean Value or Reference Category | SD | 95% CrI | % Heterogeneity Explained |
| Study design factors | |||||||||||
| Publication year | –0.08c | –0.12, –0.04 | 10-year increase | 105 | 22,741 | 0.50 | 0.45, 0.55 | 2000 | 0.14 | 0.10, 0.19 | 12.5 |
| Number of total participants | –0.04c | –0.06, –0.01 | 100 participants more | 105 | 22,741 | 0.49 | 0.44, 0.54 | 225 | 0.15 | 0.11, 0.20 | 6.3 |
| Number of sites | –0.02c | –0.04, 0.00 | 10-site increase | 96 | 20,941 | 0.49 | 0.44, 0.55 | 28 | 0.17 | 0.12, 0.22 | — |
| Number of medications | 0.08c | 0.02, 0.15 | 1 drug more | 105 | 22,741 | 0.40 | 0.33, 0.47 | 2 drugs | 0.15 | 0.11, 0.20 | 6.3 |
| Baseline severity entry minimum score | –0.17c | –0.29, –0.04 | Minimum entry score | 102 | 22,291 | 0.61 | 0.50, 0.72 | Without entry score | 0.15 | 0.11, 0.20 | 6.3 |
| Industry sponsored drug or not | –0.15c | –0.25, –0.05 | Sponsored | 97 | 22,397 | 0.57 | 0.48, 0.66 | Nonsponsored | 0.14 | 0.10, 0.19 | 12.5 |
| Scale (PANSS or BPRS) | 0.18c | 0.07, 0.30 | BPRS | 101 | 22,589 | 0.43 | 0.38, 0.48 | PANSS | 0.15 | 0.11, 0.20 | 6.3 |
| Risk of bias due to missing outcome data | 0.05 | –0.03, 0.12 | Unclear or high risk | 105 | 22,741 | 0.45 | 0.40, 0.50 | Low risk | 0.16 | 0.12, 0.21 | 0 |
| Percentage of academic sites | 0.01 | –0.01, 0.03 | 10% increase | 59 | 9,379 | 0.57 | 0.51, 0.64 | 58% | 0.15 | 0.08, 0.23 | 6.3 |
| Number of arms | 0.00 | –0.04, 0.04 | 1 arm increase | 105 | 22,741 | 0.47 | 0.38, 0.57 | 2 arms | 0.16 | 0.12, 0.21 | 0 |
| Minimum duration of washout phase | 0.03 | –0.01, 0.06 | 10-day increase | 89 | 18,586 | 0.50 | 0.45, 0.55 | 9 days | 0.15 | 0.11, 0.20 | 6.3 |
| Percentage randomized to placebo | 0.01 | –0.05, 0.07 | 10% increase | 105 | 22,741 | 0.47 | 0.42, 0.52 | 28.3% | 0.16 | 0.12, 0.21 | 0 |
| Study duration | 0.10 | –0.10, 0.29 | 10-week increase | 96 | 22,443 | 0.46 | 0.42, 0.51 | 6.5 weeks | 0.16 | 0.11, 0.21 | 0 |
| Blinding | 0.00 | –0.09, 0.09 | Unclear or high risk | 105 | 22,741 | 0.47 | 0.41, 0.53 | Low risk | 0.16 | 0.12, 0.21 | 0 |
| Allocation concealment | 0.01 | –0.08, 0.11 | Unclear risk | 105 | 22,741 | 0.46 | 0.39, 0.53 | Low risk | 0.16 | 0.12, 0.21 | 0 |
| Randomization | –0.03 | –0.13, 0.06 | Unclear risk | 105 | 22,741 | 0.48 | 0.42, 0.55 | Low risk | 0.16 | 0.12, 0.21 | 0 |
| Drug-related factorsd | |||||||||||
| Drug mechanism M2 versus M1 | –0.13 | –0.28, 0.01 | M2 | 101 | 22,315e | 0.60 | 0.48, 0.73 | M1 | 0.16b | 0.12, 0.21 | 0 |
| Drug mechanism M3 versus M1 | –0.26c | –0.43, –0.09 | M3 | 101 | 22,315e | 0.60 | 0.48, 0.73 | M1 | 0.16b | 0.12, 0.21 | 0 |
| Drug mechanism M4 versus M1 | –0.11 | –0.28, 0.05 | M4 | 101 | 22,315e | 0.60 | 0.48, 0.73 | M1 | 0.16b | 0.12, 0.21 | 0 |
| Drug mechanism M5 versus M1 | –0.18 | –0.39, 0.03 | M5 | 101 | 22,315e | 0.60 | 0.48, 0.73 | M1 | 0.16b | 0.12, 0.21 | 0 |
| Fixed or flexible dose | 0.04 | –0.08, 0.17 | Flexible dose | 105 | 22,741 | 0.46 | 0.41, 0.51 | Fixed dose | 0.16b | 0.12, 0.21 | 0 |
| Mean dose | 0.03c | 0.00, 0.05 | 100-CPZ-unit increase | 91 | 19,957 | 0.49 | 0.45, 0.54 | 580.6 CPZ units | 0.15 | 0.11, 0.20 | 6.3 |
| Patient-related factors | |||||||||||
| Operationalized criteria or not | 0.22c | 0.04, 0.40 | No operationalized criteria | 103 | 22,151 | 0.45 | 0.41, 0.50 | Operationalized criteria | 0.16 | 0.11, 0.20 | 0 |
| Placebo response (mean PANSS change score in placebo arm) | –0.15c | –0.21, –0.09 | 10-unit PANSS increase | 99 | 22,520 | 0.48 | 0.44, 0.52 | 6.24 units | 0.13 | 0.08, 0.18 | 18.8 |
| Drug response (mean change score in drug arm) | 0.05 | –0.02, 0.12 | 10-unit PANSS increase | 100 | 22,564 | 0.46 | 0.42, 0.51 | 17.45 | 0.16 | 0.11, 0.21 | 0 |
| Average age | –0.08 | –0.20, 0.03 | 10-year increase | 100 | 22,567 | 0.47 | 0.42, 0.51 | 38 | 0.16 | 0.11, 0.20 | 0 |
| Baseline severity score | 0.10 | –0.01, 0.20 | 10-unit PANSS increase | 85 | 21,259 | 0.45 | 0.41, 0.50 | 94.6 units | 0.16 | 0.11, 0.21 | 0 |
| Duration of illness | –0.07 | –0.23, 0.08 | 10-year increase | 60 | 14,278 | 0.47 | 0.42, 0.53 | 14 years | 0.15 | 0.09, 0.21 | 6.3 |
| Percentage of men | –0.01 | –0.04, 0.02 | 10% increase | 91 | 21,119 | 0.46 | 0.41, 0.51 | 66.3% | 0.16 | 0.12, 0.21 | 0 |
| Country | 0.02 | –0.07, 0.12 | Non-U.S. or mixed study | 105 | 22,741 | 0.45 | 0.38, 0.53 | U.S. | 0.16 | 0.12, 0.21 | 0 |
| First episodef | |||||||||||
| Duration of current episodef | |||||||||||
| In- or outpatients at study startf | |||||||||||

Moderators of Antipsychotic Efficacy: Multivariable Analysis
| Multivariable Meta-Regression | |||||
|---|---|---|---|---|---|
| Moderator | Coefficient | 95% CrI | Coefficient Corresponds to | Interpretation | Probability (%)b |
| Placebo response | –0.13c | –0.20, –0.06 | 10-unit increase | 10-point higher mean PANSS change score in placebo arm would reduce SMD on average by 0.13 unit | 80.6 |
| Industry sponsored or not | –0.16c | –0.28, –0.04 | Industry sponsored | SMD for studies including at least one sponsored drug would be on average 0.16 unit smaller than nonsponsored studies | 82.8 |
| Publication year | –0.02 | –0.09, 0.05 | 10-year increase | Study published 10 years later would have on average 0.02-unit smaller SMD | 25.0 |
| Sample size | 0.01 | –0.02, 0.04 | 100-participant increase | Study with 100 more participants would have on average 0.01-unit larger SMD | 3.3 |
| Mean dose | 0.01 | –0.03, 0.04 | 100-CPZ-unit increase | Mean dose 100 CPZ units higher would increase SMD on average by 0.01 unit | 3.3 |
| Baseline severity minimum score | 0.05 | –0.13, 0.21 | Baseline severity minimum score | SMD for studies having minimum baseline severity entry score would be on average 0.05 unit larger than that for studies without minimum baseline severity score | 48.4 |
Publication Bias

Sensitivity Analyses
Discussion
Overall Efficacy
Negative Symptoms and Depression
Side Effects
Outcomes Related to Social Integration
Meta-Regression of Response Predictors Including Industry Sponsorship
Differences From Previous Analyses
Limitations
Conclusions
Acknowledgments
Footnote
Supplementary Material
- View/Download
- 2.72 MB
References
Information & Authors
Information
Published In
History
Keywords
Authors
Competing Interests
Funding Information
Metrics & Citations
Metrics
Citations
Export Citations
If you have the appropriate software installed, you can download article citation data to the citation manager of your choice. Simply select your manager software from the list below and click Download.
For more information or tips please see 'Downloading to a citation manager' in the Help menu.
View Options
View options
PDF/EPUB
View PDF/EPUBLogin options
Already a subscriber? Access your subscription through your login credentials or your institution for full access to this article.
Personal login Institutional Login Open Athens loginNot a subscriber?
PsychiatryOnline subscription options offer access to the DSM-5-TR® library, books, journals, CME, and patient resources. This all-in-one virtual library provides psychiatrists and mental health professionals with key resources for diagnosis, treatment, research, and professional development.
Need more help? PsychiatryOnline Customer Service may be reached by emailing [email protected] or by calling 800-368-5777 (in the U.S.) or 703-907-7322 (outside the U.S.).

