The dose-response relationships of antipsychotic drugs for the acute treatment of schizophrenia are not well understood, but further defining them would be important for many reasons. Clinicians need to know the minimum effective doses and the maximum effective doses when they prescribe antipsychotics, and guidelines attempt to provide such information.
Discussion
We used dose-response meta-analysis to identify the near-maximum effective doses of 20 antipsychotics to explore whether the licensed doses for some drugs may be higher or lower than the maximum effective doses and whether it may be worthwhile examining higher doses for some drugs. We also derived dose equivalencies, which are presented with results of other methods in an Excel spreadsheet, available at our web site, that maybe used in practice.
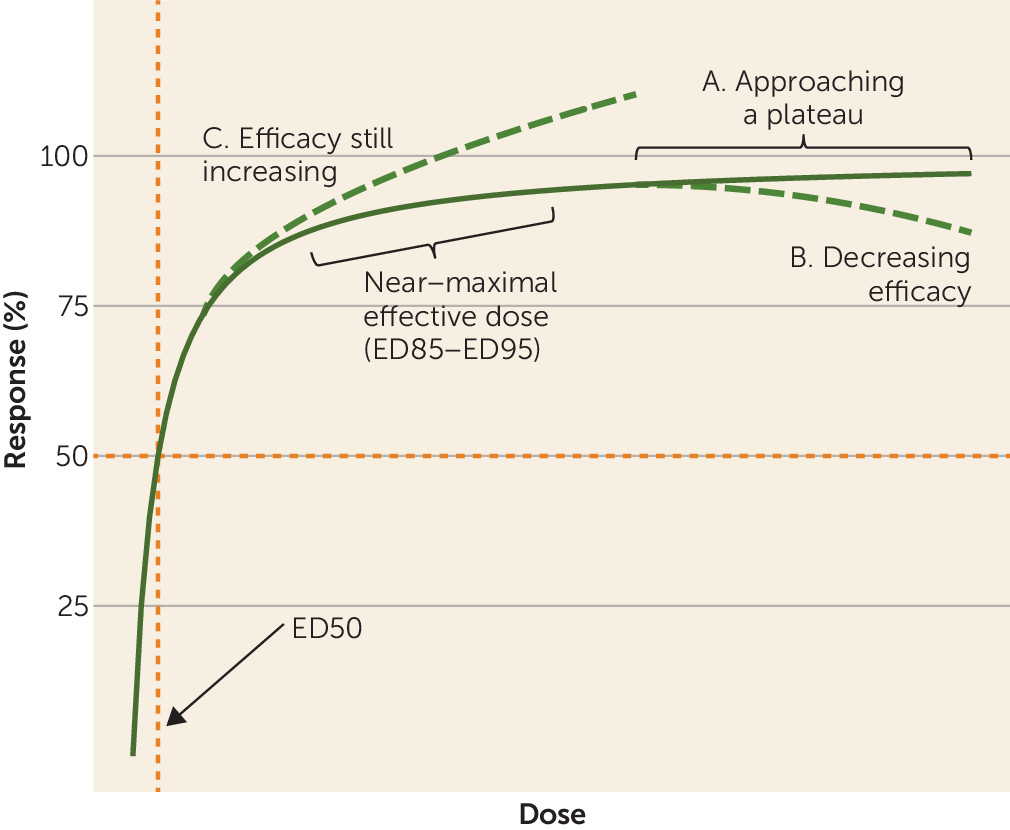
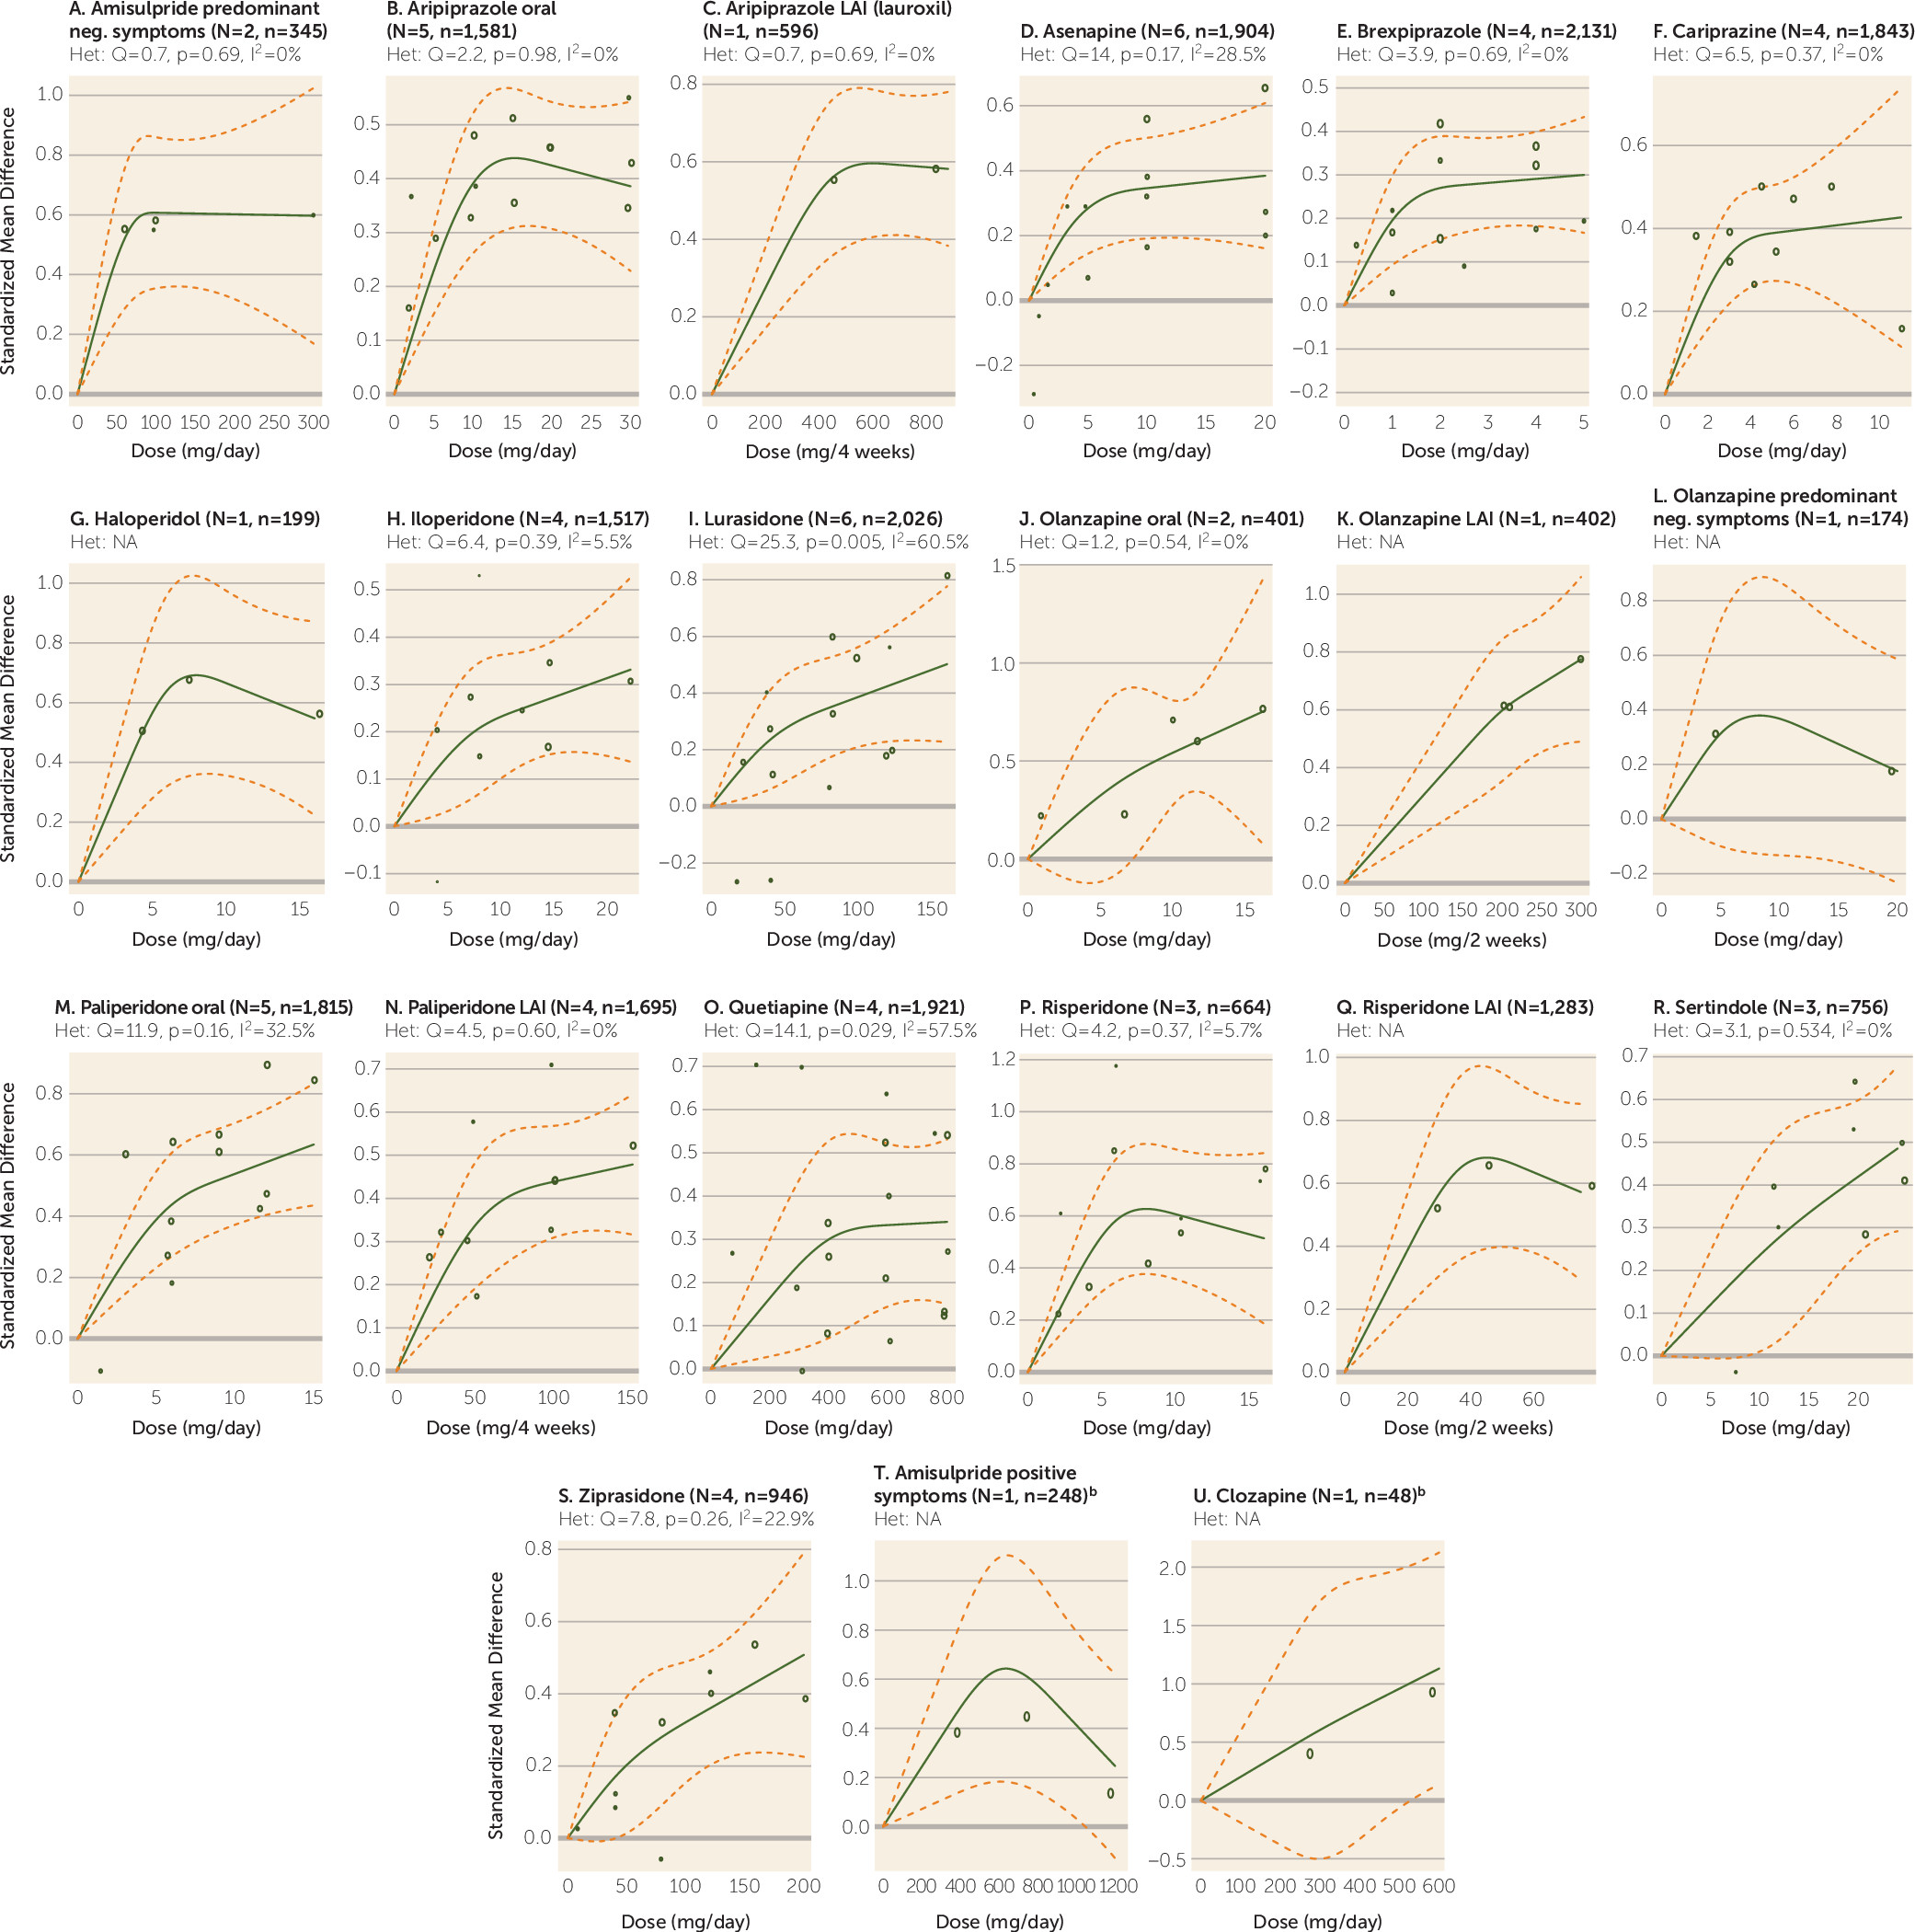
This dose-response analysis provides information that is important for clinicians. For example, risperidone 2 mg/day was associated with an effect size of approximately 0.25, while 6 mg/day led to an effect size of 0.6, more than twice as high. The method is based on empirical data rather than the licensed dose ranges, which are influenced by the initial estimates from animal studies and as a result can be too high or too low. But these early studies influence the choice of licensed doses. Indeed, for some drugs, the upper limits of licensed doses were higher than the maximum effective doses. The clearest examples are drugs with bell-shaped dose-response curves. For example, the maximum licensed doses of aripiprazole (30 mg/day) and risperidone (16 mg/day) far exceeded the ED95s for these drugs (11.5 mg/day and 6.3 mg/day, respectively). With the limitation that only one dose-finding trial was available for haloperidol, for the average patient doses greater than approximately 6.5 mg/day also may not provide more efficacy. This may also be true for risperidone LAI in doses above 40 mg every 2 weeks. The results for haloperidol are supported by a Cochrane review (
19), and no clear efficacy differences were found between lower and higher doses in several studies conducted in the 1980s that could not be included in our analysis because they were not placebo controlled (Van Putten et al. [
95] [5, 10, and 20 mg/day], Rifkin et al. [
96] [10, 30, and 80 mg/day], and McEvoy et al. [
97] [“neuroleptic threshold doses,” average 3.4 mg/day, compared with doses 2–10 times higher, average 11.6 mg/day]). For antipsychotics with bell-shaped curves, a likely reason for the curve shape is that although efficacy plateaus beyond a certain dose, the frequency of extrapyramidal side effects continues to increase. These extrapyramidal side effects may mimic negative symptoms, which may contribute to higher PANSS scores. Extrapyramidal symptoms can also lead to earlier and higher rates of discontinuation, such that the antipsychotic has less time to act on symptoms (
98).
In contrast, for the drugs with clearly increasing dose-response curves, higher-than-licensed doses could be more efficacious. Only a few studies have explored whether higher-than-licensed doses may be more efficacious. In one study, olanzapine at 40 mg/day was more efficacious than at lower doses (10 mg/day and 20 mg/day), corresponding with our increasing dose-response curve, but only in a severely ill subgroup (
99). One safety study compared aripiprazole 30, 45, 60, 75, and 90 mg/day in patients with stable symptoms and found no differences in efficacy (
100,
101). Two studies revealed no superiority for quetiapine at 1200 mg/day compared with 600 mg/day (
102) or 800 mg/day (
103). In another study, Goff et al. (
104) found no difference between ziprasidone 320 mg/day and 160 mg/day in patients who did not respond to 160 mg/day. In our analysis, a plateau was not yet attained for paliperidone at a dose of 12 mg/day, which is the maximum licensed dose. A dose of 15 mg/day has not been licensed, possibly because it produced more side effects than lower doses (
105).
Indeed, toxicity findings, for example from animal studies, can limit attempts to trial higher doses. We did not examine side effects because given the enormous problem of nonresponse in schizophrenia (
106), we believe that knowledge of the near-maximum efficacious doses is important irrespective of side effects. That being said, the importance of the multiple side effects of antipsychotics (extrapyramidal side effects, weight gain, increase in prolactin levels, QTc prolongation, etc.) in clinical decision making cannot be sufficiently emphasized. For example, the increasing dose-response efficacy curve of olanzapine must be counterbalanced by the dose-related weight gain associated with the drug (
107). Metabolic side effects are an important factor for physical comorbidities and likely excess mortality (
108). Clinicians therefore must be alert to side effects such as weight gain produced by antipsychotics such as olanzapine and quetiapine, and whenever possible they should use low doses.
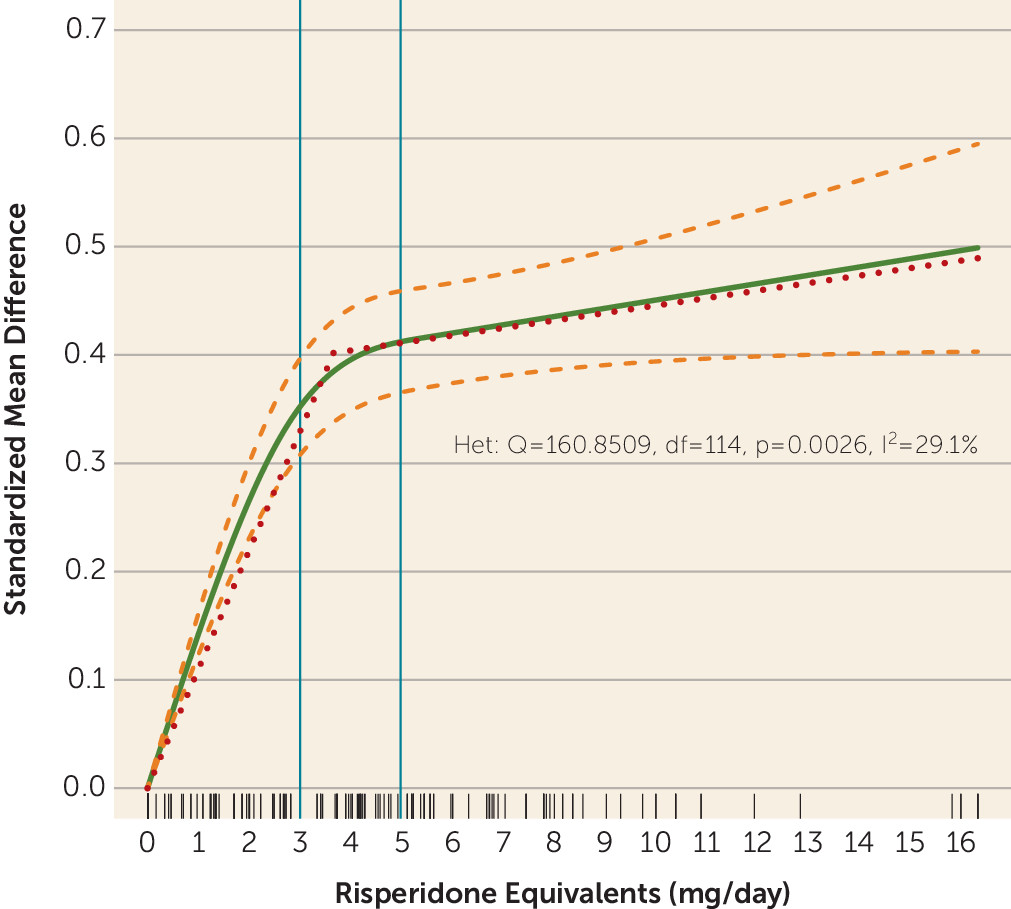
The single purpose of plotting the dose-response curve combining all drugs was to explore the concept that overall antipsychotic dose-response shows a hyperbolic pattern with a plateau. The estimated ED95 of 13.06 mg/day risperidone equivalents was high. As shown in
Figure 3, data were available for only a few very high doses, which may have artificially led to a slightly increasing slope at the right end of the curve. Moreover, the curve clearly started to flatten between 3–5 mg/day risperidone equivalents, with relatively little efficacy gain achieved by higher doses. Nevertheless, our purpose in this analysis was of a theoretical rather than a clinical nature.
Dose-response meta-analysis avoids several limitations of other dose equivalence methods. The minimum effective dose method is based on the lowest dose of each antipsychotic that was statistically significantly more efficacious than placebo (
7,
8,
26). Whether a dose is significantly better than placebo, however, depends in part on sample size. Indeed, some minimum effective doses found in previous publications (
7,
8,
26) were almost fully efficacious (e.g., aripiprazole 10 mg/day) in contrast to some others (e.g., risperidone 2 mg/day). Thus, doses on different parts of the dose-response curves were compared, which distorts the relationships. The classical mean dose method estimates chlorpromazine equivalents by calculating the ratio of the mean doses of each antipsychotic in flexible-dose trials (
10,
109). But flexible-dose studies usually have predefined dosing ranges, which may not even include the optimum dose (
13,
14). Neither expert consensus methods (
94,
110) nor the daily defined dose (DDD) method (
9) are rigorously evidence-based.
While the approach we used overcomes these problems, it does have limitations. We could only use the aggregated data for a few doses for each drug, and our judgments of the shapes of the curves were based on visual inspection. The 95% confidence intervals of the spline curves were often wide, which reflects substantial uncertainty and variability. While the studies of some drugs included large numbers of patients (e.g., more than 1,000), few patient data were available for other drugs. The most extreme example is clozapine (one randomized controlled trial with 48 patients); its curve is clearly of low validity, and it was presented only for the sake of completeness. The results are based on the available doses, but in cases of increasing dose-response curves, the ED95 might actually be higher. The dose-response relationships in specific populations, such as first-episode patients, elderly patients (who need lower doses), and patients with treatment-resistant illness, are likely to be different. The method used here assumes equal efficacy of antipsychotic drugs. A network meta-analysis suggested efficacy differences between some drugs, although we considered them to be small (
111). In contrast, the method should not be affected by the increase in placebo response and the resulting decrease in effect sizes over recent decades (
106,
112). As long as we were able to identify the near-maximum (95%) effective dose of each compound, how large their superiority is compared with placebo is not important. As for all other methods, dose-response meta-analysis assumes linear relationships, but this is not necessarily the case across all examined doses. For example, according to our analysis, 20 mg/day olanzapine corresponds to 8.25 mg/day risperidone, but as risperidone’s dose-response curve is bell-shaped, it would not make clinical sense to switch a patient to 8.25 mg/day. Therefore, clinicians should not simply apply our conversion calculator but should also consider the individual dose-response curves presented in
Figure 2.
Our analysis does not provide evidence regarding the effectiveness of switching antipsychotics. A narrative review of 10 inconclusive trials (
113) and a recent first-episode study (
114) did not find evidence to support switching for nonresponse. According to these data, switching might be most appropriate when problematic side effects are present, except in cases of treatment resistance, where clozapine is a superior drug (
115). Similarly, our analysis in average patients, most of whom will respond to moderate doses, was not designed to identify those who benefit only from higher does. A Cochrane review of 10 relatively small trials did not yield evidence that might support increasing the dose for nonresponse (
116), except for one trial in which patients who had not improved on lurasidone at 80 mg/day within 2 weeks then benefited from an increase to 160 mg/day (
57).
We stress that our results provide some guidance based on “average” patients with chronic illness. Individual dosing decisions should be guided by the properties of each drug (e.g., pharmacodynamic and pharmacokinetic properties, side effects), patient characteristics (e.g., age, illness stage, severity, physical comorbidities, and previously known individual effective doses), and concomitant treatments that could, by interaction, influence drug plasma levels (
117).
