Normalization of Fronto-Parietal Activation by Cognitive-Behavioral Therapy in Unmedicated Pediatric Patients With Anxiety Disorders
Publication: American Journal of Psychiatry
Abstract
Objective:
Anxiety disorders are prevalent among youths and are often highly impairing. Cognitive-behavioral therapy (CBT) is an effective first-line treatment. The authors investigated the brain mechanisms associated with symptom change following CBT.
Methods:
Unmedicated youths diagnosed with an anxiety disorder underwent 12 weeks of CBT as part of two randomized clinical trials testing the efficacy of adjunctive computerized cognitive training. Across both trials, participants completed a threat-processing task during functional MRI before and after treatment. Age-matched healthy comparison youths completed two scans over the same time span. The mean age of the samples was 13.20 years (SD=2.68); 41% were male (youths with anxiety disorders, N=69; healthy comparison youths, N=62). An additional sample including youths at temperamental risk for anxiety (N=87; mean age, 10.51 years [SD=0.43]; 41% male) was utilized to test the stability of anxiety-related neural differences in the absence of treatment. Whole-brain regional activation changes (thresholded at p<0.001) were examined using task-based blood-oxygen-level-dependent response.
Results:
Before treatment, patients with an anxiety disorder exhibited altered activation in fronto-parietal attention networks and limbic regions relative to healthy comparison children across all task conditions. Fronto-parietal hyperactivation normalized over the course of treatment, whereas limbic responses remained elevated after treatment. In the at-risk sample, overlapping clusters emerged between regions showing stable associations with anxiety over time and regions showing treatment-related changes.
Conclusions:
Activation in fronto-parietal networks may normalize after CBT in unmedicated pediatric anxiety patients. Limbic regions may be less amenable to acute CBT effects. Findings from the at-risk sample suggest that treatment-related changes may not be attributed solely to the passage of time.
Pediatric anxiety disorders are prevalent and highly impairing (1, 2). Cognitive-behavioral therapy (CBT) is an effective first-line treatment (3). However, the neural mechanisms associated with CBT-related symptom change remain largely unknown (4, 5). Elucidating changes in brain function following CBT is a first step toward providing mechanistic insights, modifying treatment, and improving clinical outcomes. In this study, we used an established threat-processing task (6) to examine treatment-related changes in regional activation patterns, conducting a whole-brain analysis with functional MRI (fMRI) data collected before and after CBT in a large, unmedicated sample of youths with anxiety disorders.
Neurobiological models posit that pathological anxiety arises from dysregulated cognitive processes and defensive responses (5, 7, 8). Alterations in functional networks mediating this dysfunction include attention, salience, and threat circuitry (5, 9–12), with hyperactivation of the amygdala as well as dorsal and medial prefrontal regions (13–15) and fronto-parietal and ventral attention networks. While identifying psychopathology-related neural dysfunction is an important first step for developing targeted treatments (16), the malleability of these networks within the developing brain over the course of established treatments remains largely unknown.
CBT for anxiety disorders in youths emphasizes the modification of behavioral and cognitive phenomena that maintain avoidance and dysfunctional thinking. The core components of CBT involve graded exposures to fear-provoking stimuli based on principles of extinction (17–19) and cognitive restructuring (20). Despite maturational neural changes in the developing brain, including in circuits underpinning emotion-regulatory functions (21), the efficacy of CBT does not change as a function of age (22), and its efficacy is high in youths. Pathophysiologically, CBT engages executive processes, which are thought to enhance modulatory capacity in relation to limbic structures (23). Interventions at this critical developmental juncture have the potential for long-lasting therapeutic effects, given that circuits may be more malleable (24).
fMRI can be used to examine neural correlates of clinical improvement (4). Only a handful of studies have examined threat-related brain-based indicators in relation to treatment outcome. Baseline variability in amygdala and prefrontal functioning and their connectivity during threat appraisal has been linked to CBT response in youths with pediatric anxiety disorders (13, 25, 26) and in adults with social anxiety disorder (27).
A recent meta-analysis (4) identified only two studies that used fMRI to assess the neural correlates of pre- to posttreatment change in youths with anxiety disorders (28, 29). Both had modest sample sizes, and both included patients on medication, which complicates inferences about therapeutic effects related specifically to CBT. Thus, studies in larger samples of unmedicated patients are needed.
Here, we used task-based fMRI to examine changes in brain activation during threat processing before and after a 12-week course of CBT, in 69 unmedicated pediatric patients with a primary anxiety disorder. We also included a sample of 62 healthy comparison youths who provided fMRI data at matched time points, to benchmark observed changes in activation and assess the reliability of different fMRI task contrasts. In an additional sample of 87 youths at temperamental risk for anxiety, we tested whether anxiety-associated differences remain stable over time in the absence of treatment. We anticipated that before treatment, patients in the anxiety group would show hyperactivation in cortical and subcortical salience and attention control circuitry during the fMRI threat attention task (14). Because CBT primarily targets top-down regulatory processes through graded exposure and cognitive restructuring, we expected these neural networks to normalize after acute CBT treatment. Consistent with a two-system neuroscientific framework of anxiety (5), the effects of CBT on interrelated cortical and subcortical circuits may operate on different time scales; cortical circuits may be more responsive to CBT effects, while subcortical circuits may be less acutely affected, showing more protracted dysfunction.
Methods
Participants
A total of 74 unmedicated treatment-seeking youths with a primary anxiety disorder diagnosis (generalized anxiety, social anxiety, and/or separation anxiety disorder), as established by semistructured clinical interview (the Schedule for Affective Disorders and Schizophrenia for School-Age Children–Present and Lifetime Version) (30, 31), underwent fMRI scanning before and after CBT (mean time between scans, 107.12 days [SD=33.13]). Usable data at both time points were available for 69 participants (mean age, 12.79 years [SD=2.98]; 33% male) (Table 1). Data were collected as part of two randomized controlled trials (13, 32) examining potential augmenting effects of 5–15 minutes of computerized attention training accompanying each CBT session. (See the online supplement for additional information on recruitment, enrollment, and exclusion criteria and on each randomized controlled trial, including previously published data.) An additional sample of 68 healthy control youths completed the same fMRI task twice, at the same interval, and usable data at both time points were available for 62 of them (mean age, 13.66 years [SD=2.23]; 48% male; mean time between scans, 84.1 days, [SD=35.38]).
| Characteristic | Anxiety Group (N=69) | Control Group (N=62) | ||
|---|---|---|---|---|
| | Mean | SD | Mean | SD |
| Age (years) | 12.79 | 2.98 | 13.66 | 2.23 |
| IQ | 114.36 | 13.79 | 111.72 | 12.02 |
| | N | % | N | % |
| Maleb | 23 | 33.33 | 30 | 48.39 |
| Raceb | | | | |
| Asian | 1 | 2 | 3 | 5 |
| American Indian or Alaskan Native | 1 | 2 | 0 | 0 |
| Black or African American | 1 | 2 | 14 | 23 |
| Multiple races | 10 | 14 | 6 | 10 |
| Native Hawaiian or Other Pacific Islander | 1 | 2 | 0 | 0 |
| White | 50 | 73 | 19 | 31 |
| Unknown or undeclared | 5 | 8 | 19 | 31 |
| Ethnicity | | | | |
| Latino or Hispanic | 9 | 13 | 2 | 3 |
| Not Latino or Hispanic | 56 | 81 | 42 | 68 |
| Unknown or undeclared | 4 | 6 | 18 | 29 |
| Combined family income | | | | |
| <$25,000 | 5 | 7 | 3 | 5 |
| $25,000–$39,999 | 1 | 2 | 3 | 5 |
| $40,000–59,999 | 1 | 2 | 4 | 7 |
| $60,000–89,999 | 5 | 7 | 2 | 3 |
| $90,000–$179,999 | 26 | 38 | 18 | 29 |
| ≥$180,000 | 29 | 42 | 11 | 18 |
| Unknown or undeclared | 2 | 2 | 21 | 34 |
| | Mean | SD | | |
| Pretreatment PARS total score | 15.40 | 3.75 | | |
| Posttreatment CGI-I score | 3.12 | 0.88 | | |
| | N | % | | |
| Current anxiety diagnoses | | | | |
| Generalized anxiety | 55 | 78 | | |
| Social anxiety | 43 | 62 | | |
| Separation anxiety | 19 | 28 | | |
| Specific phobia | 20 | 30 | | |
| Panic disorder | 1 | 2 | | |
a
PARS=Pediatric Anxiety Rating Scale; CGI-I=Clinical Global Impressions improvement scale.
b
Children’s sex assigned at birth and race are based on parents’ report. Race categories are based on the U.S. Office of Management and Budget Revisions to the Standards for the Classification of Federal Data on Race and Ethnicity.
A secondary analysis on published data (33) was conducted to test whether anxiety-associated activation differences remain stable over time in the absence of treatment. A separate sample was drawn from a larger longitudinal community cohort of healthy children selected at 4 months of age based on criteria for high and low behavioral inhibition, that is, reactivity to novelty (34), a temperamental risk factor for anxiety (35). The at-risk sample included 87 participants who provided data at either age 10 (N=61; mean age, 10.51 years [SD=0.43]; 59% female) or age 13 (N=64; mean age, 13.04 years [SD=0.65]; 67% female). (For details on the cohort, exclusion criteria, and procedure, see the online supplement .)
Treatment and Measures
Twelve sessions of CBT for anxiety were delivered by a licensed clinical psychologist. All participants received standard CBT, which involved key components of cognitive and exposure-based therapies; the randomized controlled trials employed two different established manuals (36, 37). Early sessions included the introduction of principles of CBT, psychoeducation, and self-monitoring of emotions, thoughts, and behaviors, and later sessions included in vivo exposures, cognitive restructuring exercises, and at-home practice skills. The randomized controlled trials were primarily testing the efficacy of adjunctive computerized cognitive training, and all participants received either active or sham computerized attention bias modification training, which was not further investigated here. The Pediatric Anxiety Rating Scale (PARS) (38) and the Clinical Global Impressions Scale improvement scale (CGI-I) (39) were administered weekly; pre- and post-CBT ratings were used to examine clinical improvement. A PARS total score was created by summing items assessing symptom severity, frequency, distress, avoidance, and interference over the previous week. Patients with CGI-I scores ≤3 after treatment are considered “treatment responders,” and patients with scores >3 are considered “nonresponders.”
Threat Attention Task
The threat attention paradigm used was the dot-probe task (40) (for further details on the task, see the online supplement ). Participants were instructed to respond via button press to indicate the direction of an arrow probe that followed a display of either angry-neutral or neutral-neutral face pairs of the same actor. The task had three conditions: threat-congruent trials, with probes presented in the angry face location of angry-neutral pairs; threat-incongruent trials, with probes presented in the neutral face location of angry-neutral pairs; and neutral trials, with probes presented in either neutral face location of neutral-neutral pairs.
fMRI Data Acquisition and Preprocessing
fMRI data were collected on two 3-T GE MR750 scanners (General Electric, Waukesha, Wisc.) with an eight-channel or 32-channel head coil. Functional image volumes with 41 contiguous interleaved axial slices were collected with a T2*-weighted echo-planar sequence (TR=2300 ms, TE=25 ms, flip angle=50°, FOV=240 mm2, matrix=96×96, slice thickness, 3 mm). For coregistration with the functional data, a high-resolution T1-weighted whole-brain volumetric scan was acquired during each scan session, with a high-resolution magnetization-prepared rapid gradient echo sequence (TE=min full; TI=425 ms; flip angle=7°; FOV=256 mm3; matrix=256×256×256).
Data were analyzed using AFNI, version 18.3.03 (41). Standard preprocessing included despiking, slice-timing correction, alignment of all volumes to a base volume, nonlinear registration to the MNI template, spatial smoothing to 6.5 mm full width at half maximum, masking, and intensity scaling. We used the blur_to_fwhm flag to ensure that a similar smoothness was achieved across scanners and sessions, rather than adding a set blur kernel to acquired images that may vary in initial smoothness.
First-level models used a generalized least-squares time-series fit with restricted maximum likelihood estimation of the temporal autocorrelation structure with regressors for the three conditions (congruent, incongruent, neutral) and error trials per participant, modeled with a gamma hemodynamic response function.
Preprocessing and first-level general linear models controlled for head motion. Six head motion parameters were included as nuisance regressors in the individual-level models. During preprocessing, any pair of successive TRs where the sum head displacement (Euclidean norm of the derivative of the translation and rotation parameters) between those TRs exceeded 1 mm were censored. TRs were also censored if more than 10% of voxels were time-series signal outliers. Participants were excluded if the average motion per TR after censoring was more than 0.25 mm, if more than 15% of TRs were censored for motion/outliers, or if behavioral performance accuracy was <70% (11 participants were excluded based on these thresholds).
Statistical Analysis
Changes in PARS total score over the course of treatment and mean reaction time per condition (congruent, incongruent, neutral) were computed. Age and head coil were included as covariates in all analyses. (Additional analyses controlling for sex assigned at birth are provided in the online supplement .) The primary analysis examined pre- to post-CBT change. Hence, the model of behavioral and imaging data compared change over time between the anxiety and control groups. The model included group (anxiety, control) as a two-level, between-subject factor and two within-subject factors, one for condition with three levels (congruent, incongruent, neutral) and one for time point with two levels (first and second scan [pre- and post-CBT for the anxiety group]) with participant as a random factor. For the imaging data, the analyses were whole-brain voxel-wise linear mixed-effect models (3dLMEr in AFNI) (42). We focused on group differences, particularly the group-by-time-point interaction. This approach is consistent with previous reports showing higher reliability estimates when assessing activation across all task conditions rather than using condition difference scores (e.g., 6).
Associations between pretreatment activation patterns and symptom improvement in youths with anxiety undergoing treatment were explored using whole-brain voxel-wise multivariate models (3dMVM in AFNI) (43). Sixty-one youths with anxiety disorders had complete clinical data and were included in this analysis. Posttreatment PARS total scores were entered as a continuous variable, with task condition (congruent, incongruent, neutral) as the within-subject variable, controlling for baseline anxiety using pretreatment PARS total score as a covariate. A second analysis examined voxel-wise correlations between change in PARS total score and change in activation patterns across the two time points. (Complementary analyses using the CGI-I score are provided in the online supplement .)
We also evaluated the reliability of BOLD activation across the two sessions in healthy control and at-risk youths using voxel-wise Bayesian intraclass correlation coefficients (ICC[3,1]) (44, 45). These analyses were conducted to confirm the most reliable task contrast and can be found in the online supplement alongside analyses assessing associations between reaction time and BOLD response.
Using AFNI’s 3dClustSim, Monte Carlo simulations were performed to correct for multiple comparisons within a whole-brain gray-matter mask (81,839 voxels), where at least 90% of individuals had data across the two time points. A Gaussian plus mono-exponential spatial autocorrelation function was used to estimate the smoothness of the residual time series. Smoothness was estimated for each participant and then averaged, for an effective smoothness of 9.32 (autocorrelation function parameters: a=0.589, b=3.429, c=10.759). For group analyses, two-sided thresholding was used with first nearest neighbor clustering. All results were thresholded at a voxel-wise p threshold of 0.001 and a cluster extent of k=21 for a whole-brain family-wise error correction of p<0.05. Signal change estimates were extracted per participant as an average from each significant cluster for post hoc analyses and visualization.
Lastly, we conducted conjunction analyses between the statistical maps showing changing activation patterns with treatment in the anxiety and control groups and the maps illustrating change and stability of anxiety-associated differences in the at-risk sample from the secondary analysis. (See the online supplement for analyses and results in the at-risk sample and additional region-of-interest analyses of amygdala activation across samples.)
Results
Demographic Characteristics and Treatment Effects
The participants’ demographic characteristics are summarized in Table 1. The anxiety and control groups did not differ significantly by sex and IQ. The mean age of the control group was marginally higher than that of the anxiety group. In addition to head coil, age was included as a covariate in all analyses.
In the anxiety group, posttreatment PARS and CGI-I scores were significantly improved relative to pretreatment scores (change in PARS score: mean=−4.15, SD=4.19; t=−7.79, df=61, p<0.001; d=0.90; 66% had a clinically significant reduction in symptoms, that is, they were classified as “responders” as defined by the CGI-I) (Figure 1A).
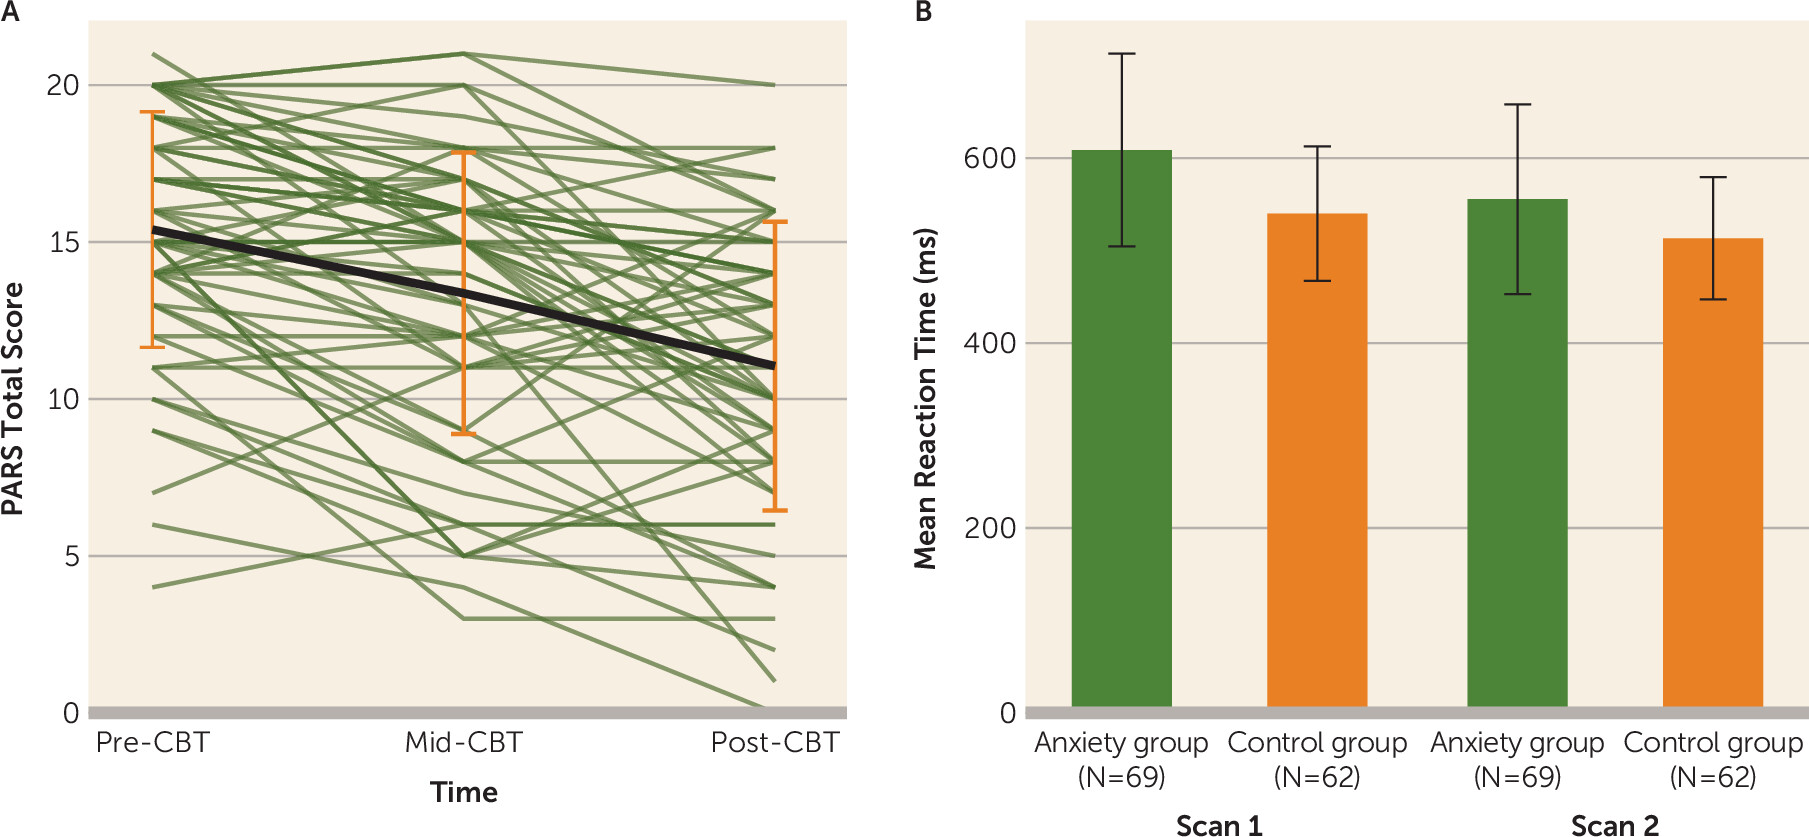
FIGURE 1. PARS total score and mean reaction time among youths with anxiety disorders before and after CBTa
aPanel A shows total score on the Pediatric Anxiety Rating Scale (PARS) before, during, and after cognitive-behavioral therapy (CBT) in youths with an anxiety disorder; individual trajectories and the average trajectory at each time point are shown. Panel B shows mean reaction time across all task conditions before and after CBT in youths with an anxiety disorder benchmarked against a group of healthy control youths who completed the task at a matched time interval. Error bars indicate standard deviation.
Behavioral Effects
A time-point-by-group interaction (F=37.56, df=1,645, p<0.001) was observed for mean task response time; the time-point-by-group-by-condition interaction was not significant. At the pretreatment scan, youths in the anxiety group were significantly slower to respond across conditions relative to those in the control group (∼69 ms; t=4.578, df=129, p<0.001), and the difference was larger compared to the posttreatment scan (∼42 ms; t=2.81, df=129, p=0.03; estimated difference, ∼27 ms, χ2=37.56, df=1, p<0.001) (Figure 1B).
Whole-Brain Analyses
Pre- to posttreatment change.
For a summary of results, including post hoc statistical tests, see Table 2 and Figure 2A,B. No regions showed a significant group-by-condition-by-time-point interaction. Thirty-seven clusters emerged with a significant group-by-time-point interaction. Thirteen of these regions showed activity normalization, that is, the anxiety group showed altered activity compared to the control group before treatment and largely no differences after treatment, while activation in the control group remained comparable at both time points. Regions that normalized with treatment included fronto-parietal network regions (left and right supplementary motor area, middle frontal gyrus, and superior parietal lobule). Specifically, the anxiety group showed elevated activation in these regions before treatment compared to the control group across all task conditions, and these activation patterns declined to levels comparable to or lower than those in the control group after treatment. Post hoc tests for the remaining regions showing a significant group-by-time interaction suggested a potential treatment-induced compensatory mechanism. Specifically, regions in the temporal gyri (superior and inferior), the left and right inferior parietal lobule, and the middle occipital gyrus were characterized by no pretreatment differences between the anxiety and control groups, whereas at the posttreatment scan, the anxiety group showed significantly less activation compared to the control group.
| Region | k | mm3 | CM LR | CM PA | CM IS | Mean | SEM | Anxiety-Control Difference Value | t | p | | | | | | | | | |
|---|---|---|---|---|---|---|---|---|---|---|---|---|---|---|---|---|---|---|---|
| R precentral gyrus | 93 | 1453 | 40.9 | −20.8 | 55.6 | 17.39 | 0.30 | 0.06 | 4.73 | <0.001 | | | | | | | | | |
| L precentral gyrus | 88 | 1375 | −35.1 | −28 | 62.9 | 16.21 | 0.23 | 0.06 | 4.70 | <0.001 | | | | | | | | | |
| R parahippocampal gyrus/amygdala | 76 | 1188 | 23.3 | −11.6 | −18.8 | 16.92 | 0.28 | 0.04 | 6.44 | <0.001 | | | | | | | | | |
| R superior temporal gyrus | 40 | 625 | 56.1 | −9.3 | −10.8 | 18.20 | 0.47 | 0.06 | 4.93 | <0.001 | | | | | | | | | |
| L postcentral gyrus | 30 | 469 | −46 | −18.9 | 50 | 16.53 | 0.42 | 0.05 | 4.74 | <0.001 | | | | | | | | | |
| L middle frontal gyrus | 24 | 375 | −26.8 | 51.4 | 8.6 | 16.18 | 0.41 | 0.03 | 4.64 | <0.001 | | | | | | | | | |
| R inferior frontal gyrus | 22 | 344 | 35.9 | 32.6 | −13.4 | 17.47 | 0.57 | 0.04 | 5.08 | <0.001 | | | | | | | | | |
| R inferior frontal gyrus | 21 | 328 | 45.4 | 19.5 | 26 | 16.26 | 0.37 | 0.05 | 4.44 | <0.001 | | | | | | | | | |
| Region | k | mm3 | CM LR | CM PA | CM IS | Mean | SEM | Anxiety: Time 1–Time 2 | t | p | Control: Time 1–Time 2 | t | p | Anxiety>Control, Time 1 | t | p | Anxiety>Control, Time 2 | t | p |
| R lingual gyrus | 535 | 8359 | 3.6 | −77.8 | 10.2 | 21.42 | 0.30 | −0.03 | −4.07 | <0.001 | 0.04 | 4.95 | <0.001 | −0.02 | −0.98 | 0.76 | 0.06 | 2.53 | 0.06 |
| R middle frontal gyrus | 434 | 6781 | 33.3 | 2.2 | 53.5 | 22.07 | 0.40 | 0.04 | 8.50 | <0.001 | −0.01 | −2.24 | 0.11 | 0.03 | 3.91 | <0.001 | −0.02 | −2.26 | 0.11 |
| R superior parietal lobule | 264 | 4125 | 19.2 | −69.2 | 53.4 | 19.85 | 0.31 | 0.07 | 10.25 | <0.001 | 0.00 | 0.09 | 1.00 | 0.04 | 2.90 | 0.02 | −0.03 | −2.50 | 0.06 |
| R superior temporal gyrus | 256 | 4000 | 55.7 | −41.8 | 20.8 | 22.61 | 0.59 | 0.05 | 10.75 | <0.001 | 0.00 | −0.82 | 0.84 | 0.03 | 3.30 | 0.01 | −0.02 | −2.34 | 0.10 |
| R inferior temporal gyrus | 215 | 3359 | 43.7 | −64.4 | −7.9 | 19.08 | 0.31 | 0.06 | 11.09 | <0.001 | 0.00 | 0.40 | 0.98 | 0.03 | 2.06 | 0.17 | −0.04 | −2.96 | 0.02 |
| L precentral gyrus | 189 | 2953 | −31.5 | −1.4 | 53.9 | 18.96 | 0.35 | 0.04 | 8.76 | <0.001 | −0.01 | −1.26 | 0.59 | 0.02 | 1.88 | 0.24 | −0.03 | −3.49 | 0.00 |
| L inferior parietal lobule | 180 | 2813 | −21.7 | −55.2 | 47.7 | 21.35 | 0.53 | 0.03 | 9.19 | <0.001 | −0.01 | −2.03 | 0.18 | 0.01 | 1.30 | 0.56 | −0.03 | −4.31 | <0.001 |
| L middle occipital gyrus | 171 | 2672 | −46.4 | −70.3 | 2.2 | 19.87 | 0.33 | 0.06 | 10.57 | <0.001 | 0.01 | 1.43 | 0.48 | 0.03 | 2.12 | 0.15 | −0.03 | −1.79 | 0.28 |
| L supplementary motor area | 135 | 2109 | 1.3 | 10.6 | 46 | 18.93 | 0.40 | 0.03 | 5.44 | <0.001 | −0.02 | −3.46 | 0.00 | 0.03 | 2.55 | 0.06 | −0.03 | −2.60 | 0.05 |
| R putamen | 123 | 1922 | 31.1 | 8 | −0.7 | 19.37 | 0.38 | 0.02 | 4.51 | <0.001 | −0.19 | −4.64 | <0.001 | 0.02 | 3.46 | 0.00 | −0.02 | −2.56 | 0.06 |
| L middle occipital gyrus | 98 | 1531 | −28 | −72.2 | 29.1 | 20.71 | 0.62 | 0.04 | 8.30 | <0.001 | 0.00 | −0.11 | 1.00 | 0.01 | 1.01 | 0.74 | −0.03 | −2.48 | 0.07 |
| R caudate nucleus | 89 | 1391 | 15 | −5.1 | 17.5 | 20.84 | 0.55 | 0.02 | 2.78 | 0.03 | −0.04 | −5.71 | <0.001 | 0.05 | 4.69 | <0.001 | −0.01 | −1.11 | 0.68 |
| R middle frontal gyrus | 61 | 953 | 29.6 | 44.3 | 34.3 | 19.40 | 0.57 | 0.01 | 1.89 | 0.23 | −0.04 | −6.23 | <0.001 | 0.03 | 3.67 | 0.00 | −0.02 | −1.76 | 0.30 |
| L middle frontal gyrus | 57 | 891 | −35.8 | 48.8 | 2 | 19.29 | 0.65 | −0.03 | −4.94 | <0.001 | 0.02 | 3.28 | 0.01 | −0.01 | −0.97 | 0.77 | 0.04 | 4.82 | <0.001 |
| L middle cingulate cortex | 54 | 844 | −10.1 | 12.7 | 36.1 | 18.80 | 0.63 | 0.02 | 4.07 | <0.001 | −0.02 | −3.81 | <0.001 | 0.03 | 3.27 | 0.01 | −0.01 | −1.77 | 0.29 |
| R middle occipital gyrus | 53 | 828 | 34.1 | −68.7 | 36.5 | 18.75 | 0.49 | 0.04 | 7.94 | <0.001 | 0.00 | −0.11 | 1.00 | 0.03 | 3.36 | 0.01 | −0.01 | −1.43 | 0.48 |
| R precuneus | 53 | 828 | 6.8 | −44.1 | 53.3 | 19.33 | 0.75 | 0.01 | 2.39 | 0.08 | −0.04 | −5.66 | <0.001 | 0.04 | 3.52 | 0.00 | −0.01 | −0.59 | 0.93 |
| R inferior parietal lobule | 52 | 813 | 31.7 | −54.4 | 47.6 | 16.75 | 0.35 | 0.05 | 9.64 | <0.001 | 0.01 | 2.06 | 0.04 | 0.01 | 1.02 | 0.74 | −0.03 | −2.74 | 0.04 |
| R Rolandic operculum | 49 | 766 | 46.4 | −12.6 | 12.3 | 18.41 | 0.62 | −0.04 | −7.07 | <0.001 | 0.01 | 1.80 | 0.28 | −0.01 | −0.59 | 0.93 | 0.05 | 4.72 | <0.001 |
| L superior parietal lobule | 43 | 672 | −21 | −73 | 45.8 | 20.46 | 0.80 | 0.05 | 7.74 | <0.001 | 0.00 | −0.74 | 0.88 | 0.03 | 1.72 | 0.32 | −0.03 | −1.78 | 0.29 |
| L precuneus | 42 | 656 | −14.4 | −71.4 | 59.1 | 21.68 | 1.15 | 0.08 | 8.44 | <0.001 | −0.01 | −0.65 | 0.92 | 0.02 | 1.10 | 0.69 | −0.06 | −3.14 | 0.01 |
| R thalamus | 40 | 625 | 6.6 | −26.6 | 16.2 | 16.97 | 0.47 | 0.02 | 2.34 | 0.09 | −0.04 | −5.20 | <0.001 | 0.04 | 3.33 | 0.01 | −0.02 | −1.55 | 0.41 |
| R middle occipital gyrus | 40 | 625 | 36.7 | −77.9 | 18.7 | 19.24 | 0.70 | 0.05 | 8.35 | <0.001 | 0.00 | 0.49 | 0.96 | 0.02 | 1.58 | 0.40 | −0.03 | −1.79 | 0.28 |
| R superior frontal gyrus | 38 | 594 | 28.4 | 56.7 | 15.1 | 19.96 | 0.77 | 0.02 | 3.22 | 0.01 | −0.04 | −4.51 | <0.001 | 0.05 | 3.93 | <0.001 | −0.01 | −0.63 | 0.92 |
| L superior temporal gyrus | 37 | 578 | −59.2 | −45.7 | 19.4 | 19.55 | 0.59 | 0.04 | 7.71 | <0.001 | −0.01 | −2.22 | 0.12 | 0.03 | 3.85 | 0.00 | −0.01 | −1.44 | 0.48 |
| Cerebellar lobule VIIIa | 36 | 563 | −1 | −74.9 | −39.8 | 19.81 | 0.79 | 0.04 | 6.55 | <0.001 | −0.02 | −2.17 | 0.13 | 0.04 | 3.25 | 0.01 | −0.02 | −1.83 | 0.27 |
| L inferior occipital gyrus | 34 | 531 | −24 | −95.9 | −6.1 | 21.00 | 1.01 | 0.04 | 4.23 | 0.00 | −0.04 | −4.04 | <0.001 | 0.07 | 2.90 | 0.02 | −0.01 | −0.44 | 0.97 |
| Cerebellar vermis, 4/5 | 31 | 484 | 1.8 | −61.1 | −14.9 | 20.15 | 1.17 | 0.02 | 5.41 | <0.001 | −0.01 | −2.75 | 0.03 | 0.02 | 3.04 | 0.02 | −0.01 | −1.85 | 0.25 |
| R supplementary motor area | 30 | 469 | 11 | 0.4 | 72.4 | 21.00 | 1.11 | 0.06 | 8.20 | <0.001 | 0.00 | −0.41 | 0.98 | 0.04 | 2.76 | 0.03 | −0.02 | −1.31 | 0.56 |
| R superior temporal gyrus | 29 | 453 | 45.1 | −31 | 13.7 | 23.76 | 1.44 | −0.04 | −5.90 | <0.001 | 0.02 | 2.52 | 0.06 | 0.00 | −0.16 | 1.00 | 0.06 | 4.63 | <0.001 |
| R middle cingulate cortex | 29 | 453 | 6.6 | 24.1 | 30.8 | 16.46 | 0.42 | 0.02 | 2.95 | 0.02 | −0.03 | −3.83 | <0.001 | 0.03 | 2.80 | 0.30 | −0.02 | −1.72 | 0.32 |
| R postcentral gyrus | 29 | 453 | 46.4 | −34.9 | 59.8 | 19.21 | 0.77 | 0.07 | 6.66 | <0.001 | −0.01 | −1.17 | 0.65 | 0.06 | 2.77 | 0.03 | −0.02 | −0.99 | 0.76 |
| R hippocampus | 28 | 438 | 24.4 | −32.9 | 6.2 | 20.11 | 0.99 | 0.01 | 4.14 | <0.001 | −0.02 | −4.83 | <0.001 | 0.03 | 5.38 | <0.001 | 0.00 | −0.90 | 0.81 |
| R fusiform gyrus | 27 | 422 | 43.3 | −39.3 | −18.3 | 20.79 | 0.92 | 0.04 | 7.34 | <0.001 | −0.01 | −0.99 | 0.76 | 0.03 | 3.32 | 0.01 | −0.01 | −0.88 | 0.82 |
| L superior temporal gyrus | 26 | 406 | −41.6 | −37.4 | 19.3 | 19.09 | 0.83 | −0.03 | −3.93 | <0.001 | 0.02 | 3.57 | 0.00 | −0.01 | −1.04 | 0.73 | 0.04 | 3.28 | 0.01 |
| L lingual gyrus | 22 | 344 | −8.5 | −67.2 | −3 | 22.03 | 1.64 | −0.05 | −4.12 | <0.001 | 0.03 | 2.82 | 0.03 | −0.04 | −1.47 | 0.46 | 0.04 | 1.38 | 0.51 |
| Cerebellar vermis, 8 | 21 | 328 | −0.9 | −57.8 | −29.2 | 19.98 | 1.29 | −0.03 | −3.85 | <0.001 | 0.03 | 4.24 | <0.001 | −0.04 | −4.37 | <0.001 | 0.02 | 1.89 | 0.24 |
a
Cluster-corrected voxel-wise linear mixed-effects model results are presented, summarizing regions showing a main effect of group and those showing a group-by-time-point interaction. Anatomical locations are based on Eickhoff-Zilles macro labels from N27 (MNI_ANAT space). For t tests, df=127. k=number of voxels in cluster; mm3=cluster volume; CM=center of mass of cluster; LR=left-right (x); PA=posterior-anterior axis (y); IS=inferior-superior axis (z); SEM=standard error of the mean.
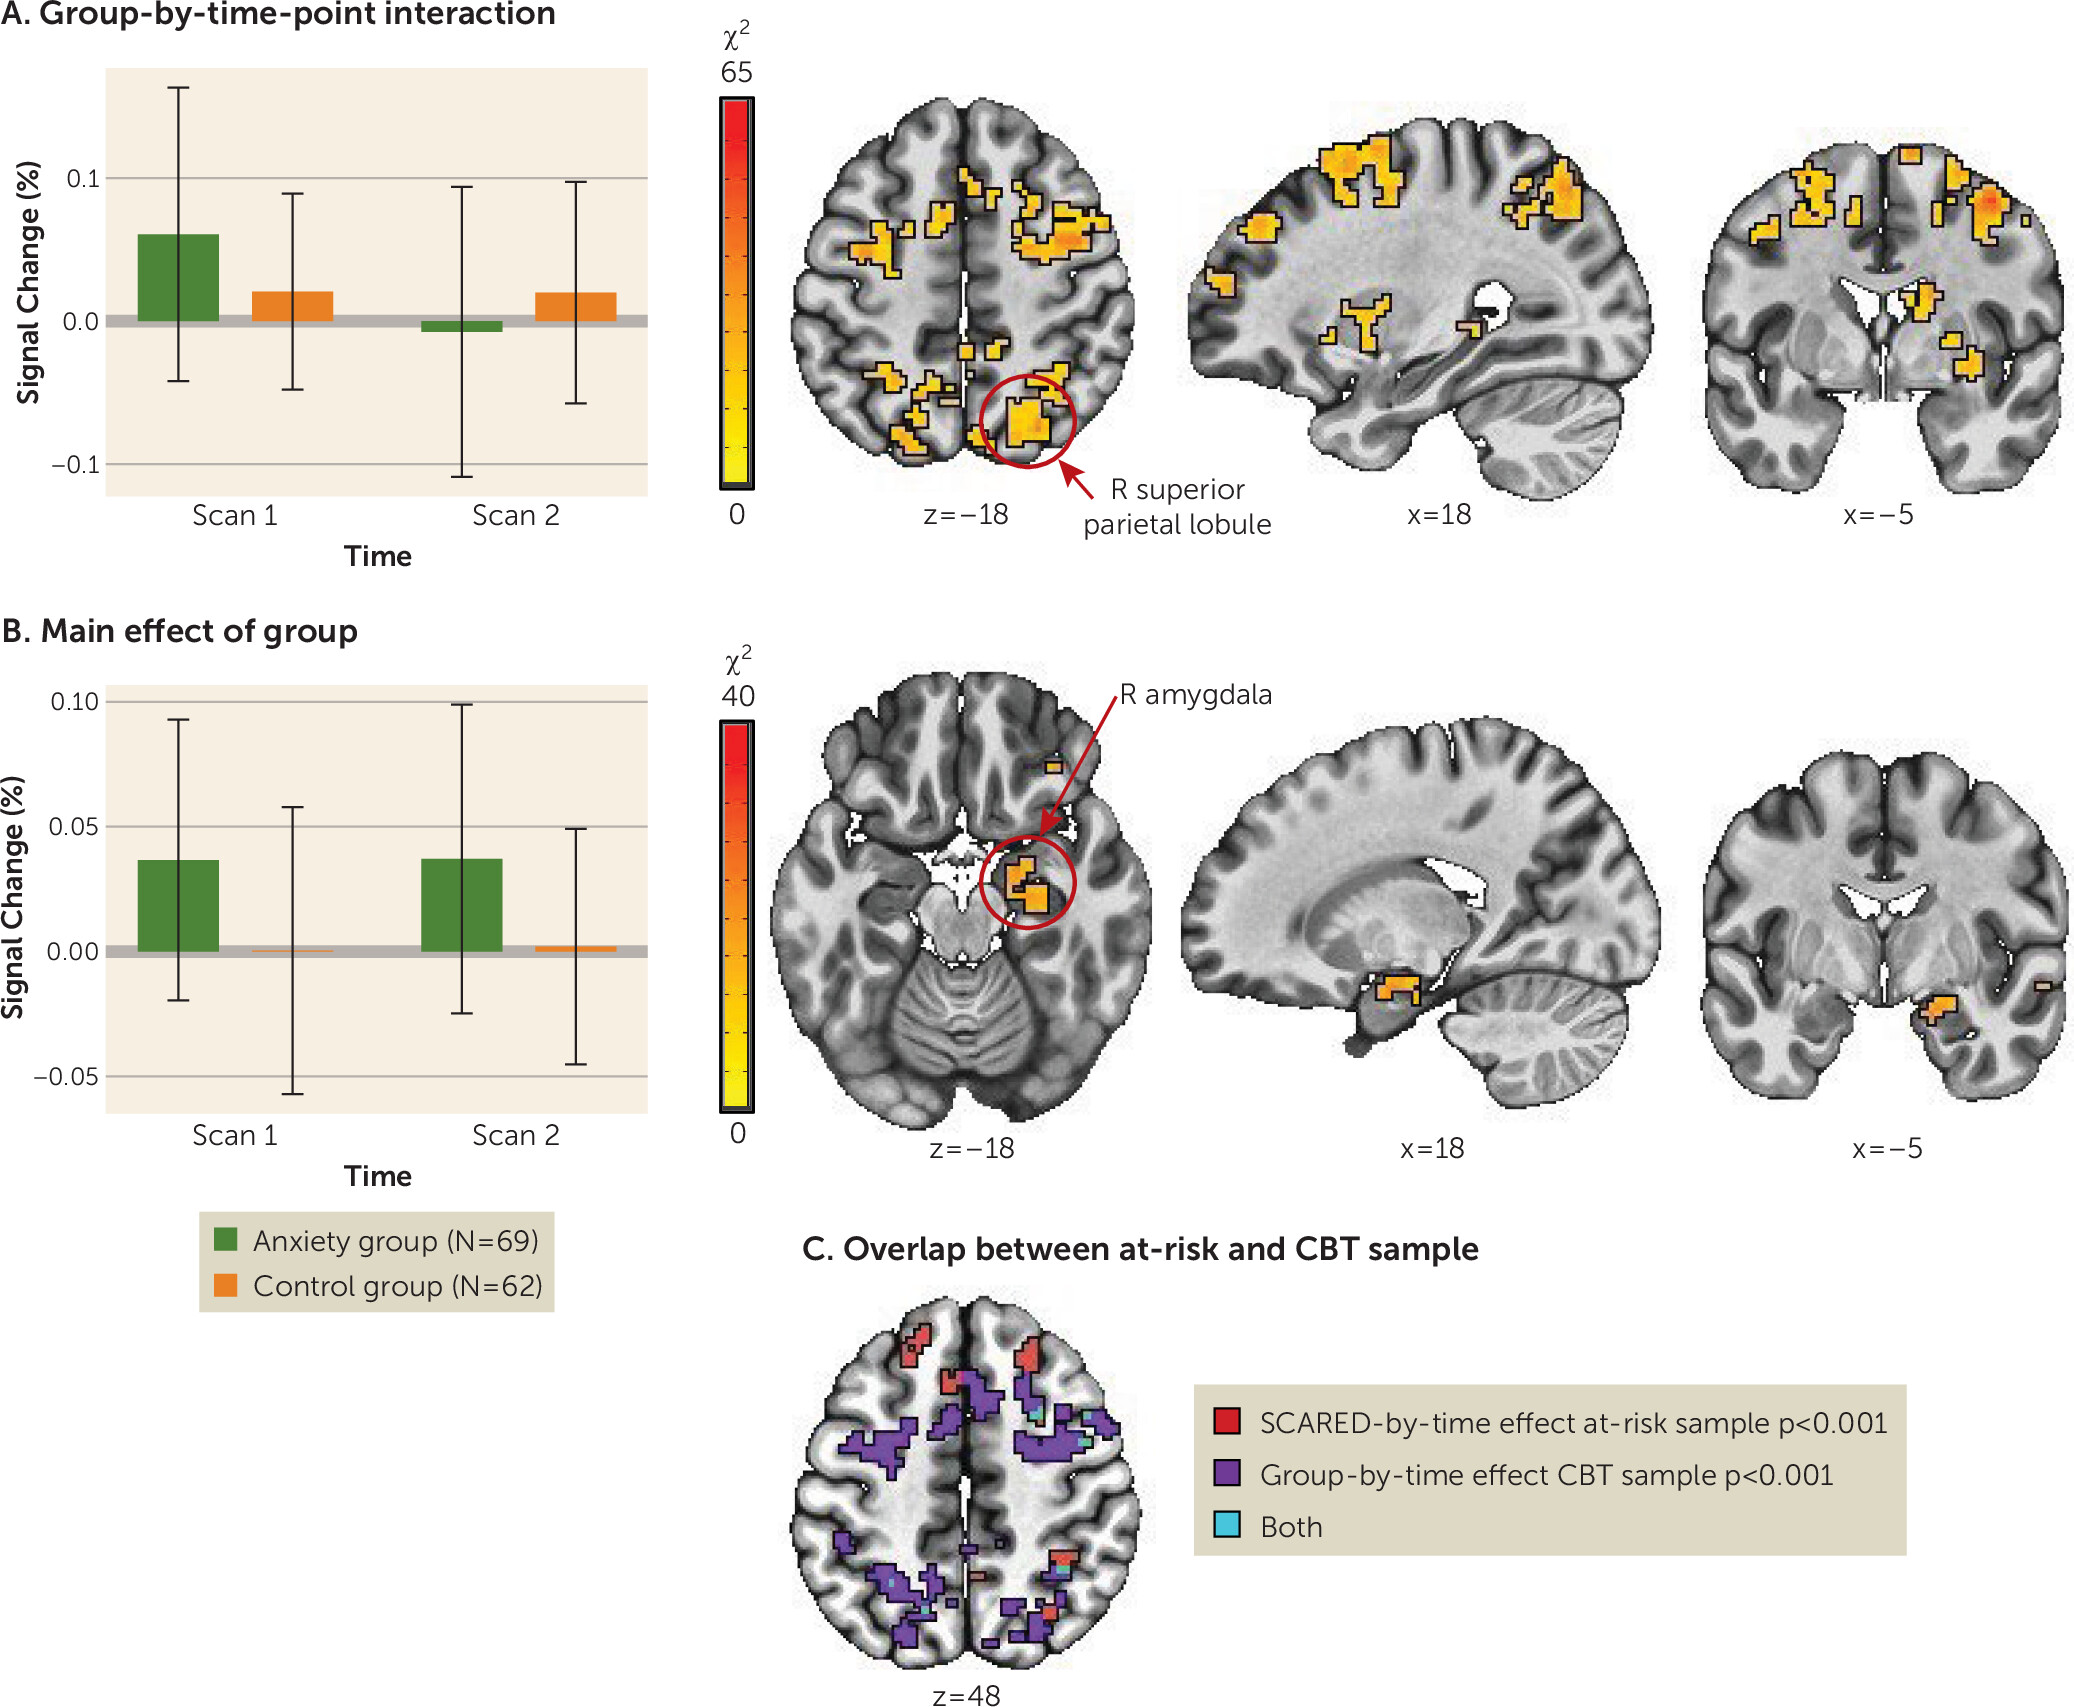
FIGURE 2. Brain activation patterns showing a main effect of group and a group-by-time-point interactiona
aPanel A shows clusters with a significant group-by-time-point interaction alongside mean percent signal change for a cluster in the right superior parietal lobule for each time point and group. Panel B shows a significant main effect of group in the right amygdala alongside mean percent signal change in this cluster for each time point and group. Error bars indicate standard deviation. Panel C shows a conjunction map illustrating the overlap in brain regions that showed increased stable activation with anxiety across the two developmental time points in the absence of treatment (main effect of anxiety, cluster-corrected) and those regions that changed with treatment in the anxiety group (group-by-time-point interaction, cluster-corrected). CBT=cognitive-behavioral therapy; SCARED=Screen for Child Anxiety Related Emotional Disorders.
Eight regions showed a main effect of group across time points, including the left and right motor cortex, the right amygdala/parahippocampal gyrus, and lateral anterior frontal areas. These regions showed hyperactivation in the anxiety group relative to the control group; activation did not change significantly with treatment in the anxiety group.
Lastly, a conjunction analysis between the group-by-time interaction (changing activation patterns with treatment) and the main effect of anxiety in the at-risk sample from the secondary analysis (anxiety-associated differences across two time points in development) revealed some overlapping clusters in the frontal and parietal cortex (Figure 2C). This provides preliminary evidence that changes observed in the main sample are related to treatment. In the at-risk, untreated sample, clusters reflected relations with anxiety that manifested across the two time points.
Associations between pretreatment activation patterns and treatment response.
No significant associations emerged between activation patterns at the pretreatment scan and improvement in PARS total score. Follow-up voxel-wise correlation analysis did not show relations between change in dimensional ratings of anxiety and change in activation patterns.
Discussion
This study has four key findings. First, unmedicated treatment-seeking youths with an anxiety disorder differed from healthy control youths at baseline in both reaction time and brain function. Second, reaction time and fronto-parietal activation normalized with CBT treatment. Third, a number of cortical and subcortical regions, including the right amygdala, remained hyperactive in patients after treatment. Fourth, in a sample including youths at temperamental risk for anxiety, anxiety-associated neural dysfunction remained relatively stable over time.
Baseline Differences in Fronto-Parietal Networks
Prior to treatment, youths with an anxiety disorder showed widespread hyperactivation, including in fronto-parietal regions across all task conditions. This is consistent with previous research in which frontal hyperactivation in pediatric anxiety patients was reported relative to healthy control youths (for a recent meta-analysis, see reference 14). Additionally, network-based approaches examining activation and connectivity have found aberrant fronto-parietal network functioning in anxiety, suggesting cognitive control difficulties (46–48). In this study, hyperactivation emerged in the context of longer reaction times and reactivity in the right amygdala and frontal regions (inferior and middle frontal gyrus, precentral gyrus), indicating atypical functioning in this circuitry. Data from a separate, at-risk sample showed that youths at risk for anxiety also display atypical functioning in this circuitry across all task conditions.
Previous neuroimaging work with the dot-probe task has focused on threat-specific trials or compared threat and neutral trials (13, 49). In contrast, our findings are not specific to a task condition and are consistent with neuroimaging findings in the dot-probe task demonstrating a higher level of test-retest reliability when estimating activation across all trial types (6). Our findings are also consistent with work demonstrating that neutral stimuli may be perceived as threatening by youths with anxiety (50), although a number of studies also report biases specific to threat-relevant stimuli in populations with anxiety (51, 52). Previous work employing non-emotional stimuli further suggests that the dysfunction observed in anxiety disorders may not be specific to threat processing. Instead, global changes in cognitive control and brain network functioning may characterize this population (46, 53). These general changes could either be secondary to a primary deficit in threat processing or may affect systems involved in threat detection and appraisal. It is important to note that, although unlikely, the possibility cannot be ruled out that changes across trial types reflect changes in brain activity during the unmodeled implicit baseline, or some combination of the modeled and unmodeled events.
Fronto-Parietal Networks and Treatment-Related Change
We found that hyperactivation in fronto-parietal regions that characterized youths with anxiety disorders before treatment normalized after CBT, reaching levels comparable to (or lower than) those observed in healthy control youths. Longitudinal data in an independent sample of youths at risk for anxiety showed stability of anxiety-associated differences manifested across 2 years, without the changes seen in the treated patients. Reductions in activation in youths with anxiety may reflect more efficient engagement of cognitive control networks after CBT. Partially consistent with our findings, the two previous studies that examined pre- to posttreatment neural changes (28, 29) found frontal regional changes over the course of treatment, albeit in the opposite direction, with increased activation after treatment. It is important to note, however, that those two studies included medicated patients and had smaller samples.
We also found that some patterns of hyperactivation, including in several frontal regions and the right amygdala, did not change with treatment. This persistent pattern of altered circuit function after CBT may be understood within a two-system neuroscience framework of anxiety elicited by threats (5). The model posits that defensive response circuitry (e.g., amygdala), while directly involved in detecting threat, is only indirectly involved in generating signals that give rise to subjective fear. Subjective experiences of fear are mediated by higher-order association cortical regions, including lateral and medial prefrontal and parietal regions, supporting cognitive functions such as attention. While cognitive components of CBT may first reduce subjective feelings of fear or anxiety, defensive systems may demonstrate more persistent dysfunction. Speculatively, CBT may more effectively and efficiently target cortical circuitry, while subcortical dysfunction may lag in responsivity and/or might require more direct interventions to modulate exaggerated automatic defensive reactions (54). Longer-term follow-up of youths who complete CBT may reveal normalization of amygdala function, with CBT-affected cortical circuits regulating other cortical and subcortical functioning over time. Youths who continue to demonstrate aberrant prefrontal and amygdala functioning may be particularly prone to relapse (55). In fact, many youths undergoing CBT, including those considered responders, maintain persistent symptoms of anxiety (56). Hence, two important avenues for future work are to examine the neural effects of CBT longitudinally, ideally in the context of dismantling designs to more directly link manualized components to changes in neural activation, and to assess the effectiveness of complementary, adjunctive treatments.
Pretreatment Activation Patterns and Treatment Response
We did not find pretreatment activation patterns to be associated with treatment response. A handful of studies have examined threat-related brain-based indicators as predictors of treatment outcome (13, 25, 26). Although these studies did not directly address mechanisms of therapeutic change, they indicate subtypes of potential responders with specific alterations in threat circuit functioning (13). Previous work in youths with anxiety disorders has shown that greater activation in prefrontal regions to angry faces predicts better treatment response across CBT and pharmacological treatment (26). Methodological differences between studies (e.g., explicit vs. implicit emotion processing tasks, medication use) may explain inconsistent results. Given the mixed findings, further work is needed.
Strengths and Limitations
The study results should be interpreted in light of several limitations. First, we were unable to include a patient control arm of medication-free youths with anxiety since our institutions’ review boards will not permit delay of treatment for those youths, on ethical grounds. However, in a separate adolescent sample at temperamental risk for anxiety who were not receiving treatment, we showed that some frontal and parietal hyperactivation is consistently associated with increased anxiety over time. Second, heterogeneity and potential noise in the clinical and fMRI data may have been introduced by collapsing data from participants across two different manualized CBT protocols and across adjunctive attention bias modification training (ABMT). Given the similarity of stimuli employed in the fMRI task and the adjunctive treatment, repeated exposure to these stimuli and practice effects could have an impact on both response time and BOLD response in the treatment-receiving group. Findings on the efficacy of ABMT in youths are mixed, with some studies reporting positive effects in the small (57–60) to medium range (61–63) and the largest randomized controlled trial finding no effect of ABMT on anxiety symptoms (64). Therefore, even if ABMT is efficacious, questions remain about the efficacy of adjunctive ABMT. Our study is well powered to examine symptom and neural changes with CBT, because the effects are likely larger, and the sample size doubled compared to examining adjunctive ABMT subgroups. Third, while we applied established whole-brain procedures to examine task activation patterns, recent advances in network-based analytical techniques mapping connectivity across the brain open up new and important avenues for future work. Techniques such as connectome-based predictive modeling (65) and functional connectome fingerprinting (66) may facilitate additional predictive modeling of treatment response. Finally, although we added a sample of youths characterized by an early-childhood inhibited temperament with a higher risk for developing an anxiety disorder (67), very few of the youths in the enriched group met criteria for an anxiety disorder at the time of the scan. However, previous research on behavioral inhibition (33) suggests that the relations between neural functioning and dimensional measures of anxiety severity remain, even when symptom levels do not reach the threshold of an anxiety disorder.
Despite these limitations, this study provides evidence in a large sample of unmedicated youths with anxiety disorders for the circuitry and potential putative mechanisms of manualized CBT. While CBT is the current gold-standard intervention for pediatric anxiety (3, 22), response rates are variable (68), leaving a large portion of treated youths with significant symptoms following treatment (56). The moderate success rate may be due, in part, to limited understanding of the mechanisms catalyzing immediate and long-term neural changes in CBT. Clinical outcomes may be improved by targeting fronto-parietal attention circuits and complementing CBT with adjunctive interventions that have a direct impact on subcortical structures (54).
Conclusions
CBT is an effective first-line treatment for anxiety disorders (3), which are among the most common psychiatric conditions in youths. However, success rates are limited (1), and relapse rates are high (3, 55). The data from this study reveal neural mechanisms that change following the acute effects of CBT for pediatric anxiety, as well as potential subcortical and cortical targets that remain dysfunctional after 12 weeks of CBT. Future work may benefit from directly targeting subcortical, automatic, and biased processing to enhance CBT treatment response.
Acknowledgments
The authors thank Dr. Daniel S. Pine for insightful discussion and comments on earlier drafts. This work utilized the computational resources of the NIH HPC Biowulf cluster (http://hpc.nih.gov).
Supplementary Material
File (appi.ajp.20220449.ds001.pdf)
- View/Download
- 1.52 MB
References
1.
Walkup JT, Albano AM, Piacentini J, et al: Cognitive behavioral therapy, sertraline, or a combination in childhood anxiety. N Engl J Med 2008; 359:2753–2766
2.
Compton SN, Peris TS, Almirall D, et al: Predictors and moderators of treatment response in childhood anxiety disorders: results from the CAMS trial. J Consult Clin Psychol 2014; 82:212–224
3.
Piacentini J, Bennett S, Compton SN, et al: 24-and 36-week outcomes for the Child/Adolescent Anxiety Multimodal Study (CAMS). J Am Acad Child Adolesc Psychiatry 2014; 53:297–310
4.
La Buissonniere-Ariza V, Fitzgerald K, Meoded A, et al: Neural correlates of cognitive behavioral therapy response in youth with negative valence disorders: a systematic review of the literature. J Affect Disord 2021; 282:1288–1307
5.
LeDoux JE, Pine DS: Using neuroscience to help understand fear and anxiety: a two-system framework. Am J Psychiatry 2016; 173:1083–1093
6.
White LK, Britton JC, Sequeira S, et al: Behavioral and neural stability of attention bias to threat in healthy adolescents. Neuroimage 2016; 136:84–93
7.
Sylvester CM, Pine DS: Pediatric anxiety disorders: insights from basic neuroscience, development, and clinical research. Biol Psychiatry 2021; 89:638–640
8.
Mathews A, Mackintosh B: A cognitive model of selective processing in anxiety. Cognit Ther Res 1998; 22:539–560
9.
Kenwood MM, Kalin NH, Barbas H: The prefrontal cortex, pathological anxiety, and anxiety disorders. Neuropsychopharmacology 2022; 47:260–275
10.
Perino MT, Yu Q, Myers MJ, et al: Attention alterations in pediatric anxiety: evidence from behavior and neuroimaging. Biol Psychiatry 2021; 89:726–734
11.
Fitzgerald KD, Schroder HS, Marsh R: Cognitive control in pediatric obsessive-compulsive and anxiety disorders: brain-behavioral targets for early intervention. Biol Psychiatry 2021; 89:697–706
12.
Sylvester CM, Yu Q, Srivastava AB, et al: Individual-specific functional connectivity of the amygdala: a substrate for precision psychiatry. Proc Natl Acad Sci U S A 2020; 117:3808–3818
13.
White LK, Sequeira S, Britton JC, et al: Complementary features of attention bias modification therapy and cognitive-behavioral therapy in pediatric anxiety disorders. Am J Psychiatry 2017; 174:775–784
14.
Ashworth E, Brooks SJ, Schiöth HB: Neural activation of anxiety and depression in children and young people: a systematic meta-analysis of fMRI studies. Psychiatry Res Neuroimaging 2021; 311:111272
15.
Chavanne AV, Robinson OJ: The overlapping neurobiology of induced and pathological anxiety: a meta-analysis of functional neural activation. Am J Psychiatry 2021; 178:156–164
16.
Lazarov A, Bar-Haim Y: Emerging domain-based treatments for pediatric anxiety disorders. Biol Psychiatry 2021; 89:716–725
17.
Craske MG, Kircanski K, Zelikowsky M, et al: Optimizing inhibitory learning during exposure therapy. Behav Res Ther 2008; 46:5–27
18.
De Silva P, Rachman S: Exposure and fear-reduction. Behav Res Ther 1983; 21:151–152
19.
Foa EB, Kozak MJ: Emotional processing of fear: exposure to corrective information. Psychol Bull 1986; 99:20–35
20.
Beck AT, Emery G, Greenberg RL: Anxiety Disorders and Phobias: A Cognitive Perspective. New York, Basic Books, 2005
21.
Gold AL, Abend R, Britton JC, et al: Age differences in the neural correlates of anxiety disorders: an fMRI study of response to learned threat. Am J Psychiatry 2020; 177:454–463
22.
Kendall PC, Peterman JS: CBT for adolescents with anxiety: mature yet still developing. Am J Psychiatry 2015; 172:519–530
23.
Quirk GJ, Likhtik E, Pelletier JG, et al: Stimulation of medial prefrontal cortex decreases the responsiveness of central amygdala output neurons. J Neurosci 2003; 23:8800–8807
24.
Casey BJ, Glatt CE, Lee FS: Treating the developing versus developed brain: translating preclinical mouse and human studies. Neuron 2015; 86:1358–1368
25.
McClure EB, Adler A, Monk CS, et al: fMRI predictors of treatment outcome in pediatric anxiety disorders. Psychopharmacology (Berl) 2007; 191:97–105
26.
Kujawa A, Swain JE, Hanna GL, et al: Prefrontal reactivity to social signals of threat as a predictor of treatment response in anxious youth. Neuropsychopharmacology 2016; 41:1983–1990
27.
Klumpp H, Keutmann MK, Fitzgerald DA, et al: Resting state amygdala-prefrontal connectivity predicts symptom change after cognitive behavioral therapy in generalized social anxiety disorder. Biol Mood Anxiety Disord 2014; 4:14
28.
Burkhouse KL, Kujawa A, Hosseini B, et al: Anterior cingulate activation to implicit threat before and after treatment for pediatric anxiety disorders. Prog Neuropsychopharmacol Biol Psychiatry 2018; 84:250–256
29.
Maslowsky J, Mogg K, Bradley BP, et al: A preliminary investigation of neural correlates of treatment in adolescents with generalized anxiety disorder. J Child Adolesc Psychopharmacol 2010; 20:105–111
30.
Kaufman J, Birmaher B, Brent D, et al: Schedule for Affective Disorders and Schizophrenia for School-Age Children–Present and Lifetime Version (K-SADS-PL): initial reliability and validity data. J Am Acad Child Adolesc Psychiatry 1997; 36:980–988
31.
Silverman W, Albano A: The Anxiety Disorders Interview Schedule for Children (ADIS-C/P). San Antonio, TX, Psychological Corp, 1996
32.
Linke JO, Jones E, Pagliaccio D, et al: Efficacy and mechanisms underlying a gamified attention bias modification training in anxious youth: protocol for a randomized controlled trial. BMC Psychiatry 2019; 19:246
33.
Abend R, Swetlitz C, White LK, et al: Levels of early-childhood behavioral inhibition predict distinct neurodevelopmental pathways to pediatric anxiety. Psychol Med 2020; 50:96–106
34.
Fox NA, Henderson HA, Rubin KH, et al: Continuity and discontinuity of behavioral inhibition and exuberance: psychophysiological and behavioral influences across the first four years of life. Child Dev 2001; 72:1–21
35.
Degnan KA, Fox NA: Behavioral inhibition and anxiety disorders: multiple levels of a resilience process. Dev Psychopathol 2007; 19:729–746
36.
Silverman WK, Kurtines WM: Anxiety and Phobic Disorders: A Pragmatic Approach. Berlin, Springer Science and Business Media, 1996
37.
Kendall PC, Aschenbrand SG, Hudson JL: Child-focused treatment of anxiety; in Evidence-Based Psychotherapies for Children and Adolescents. Edited by Kazdin AE, Weisz JR. New York, Guilford, 2003, 81–100
38.
The Pediatric Anxiety Rating Scale (PARS): development and psychometric properties. J Am Acad Child Adolesc Psychiatry 2002; 41:1061–1069
39.
Walkup JT, Labellarte MJ, Riddle MA, et al: Fluvoxamine for the treatment of anxiety disorders in children and adolescents. N Engl J Med 2001; 344:1279–1285
40.
Abend R, Pine DS, Bar-Haim Y: The TAU-NIMH Attention Bias Measurement Toolbox. Tel Aviv, Tel Aviv University, School of Psychological Sciences, Laboratory for Research on Anxiety and Trauma, 2014 (https://people.socsci.tau.ac.il/mu/ybh/resources/)
41.
Cox RW: AFNI: software for analysis and visualization of functional magnetic resonance neuroimages. Comput Biomed Res 1996; 29:162–173
42.
Chen G, Saad ZS, Britton JC, et al: Linear mixed-effects modeling approach to fMRI group analysis. Neuroimage 2013; 73:176–190
43.
Chen G, Adleman NE, Saad ZS, et al: Applications of multivariate modeling to neuroimaging group analysis: a comprehensive alternative to univariate general linear model. Neuroimage 2014; 99:571–588
44.
Shrout PE, Fleiss JL: Intraclass correlations: uses in assessing rater reliability. Psychol Bull 1979; 86:420–428
45.
Chen G, Taylor PA, Haller SP, et al: Intraclass correlation: improved modeling approaches and applications for neuroimaging. Hum Brain Mapp 2018; 39:1187–1206
46.
Bishop SJ: Trait anxiety and impoverished prefrontal control of attention. Nat Neurosci 2009; 12:92–98
47.
Bishop SJ, Jenkins R, Lawrence AD: Neural processing of fearful faces: effects of anxiety are gated by perceptual capacity limitations. Cereb Cortex 2007; 17:1595–1603
48.
Basten U, Stelzel C, Fiebach CJ: Trait anxiety modulates the neural efficiency of inhibitory control. J Cogn Neurosci 2011; 23:3132–3145
49.
Price RB, Brown V, Siegle GJ: Computational modeling applied to the dot-probe task yields improved reliability and mechanistic insights. Biol Psychiatry 2019; 85:606–612
50.
Haller SP, Raeder SM, Scerif G, et al: Measuring online interpretations and attributions of social situations: links with adolescent social anxiety. J Behav Ther Exp Psychiatry 2016; 50:250–256
51.
Bar-Haim Y, Lamy D, Pergamin L, et al: Threat-related attentional bias in anxious and nonanxious individuals: a meta-analytic study. Psychol Bull 2007; 133:1–24
52.
Dudeney J, Sharpe L, Hunt C: Attentional bias towards threatening stimuli in children with anxiety: a meta-analysis. Clin Psychol Rev 2015; 40:66–75
53.
Eysenck MW, Derakshan N, Santos R, et al: Anxiety and cognitive performance: attentional control theory. Emotion 2007; 7:336–353
54.
Mohatt J, Bennett SM, Walkup JT: Treatment of separation, generalized, and social anxiety disorders in youths. Am J Psychiatry 2014; 171:741–748
55.
Ginsburg GS, Becker-Haimes EM, Keeton C, et al: Results from the Child/Adolescent Anxiety Multimodal Extended Long-Term Study (CAMELS): primary anxiety outcomes. J Am Acad Child Adolesc Psychiatry 2018; 57:471–480
56.
Ginsburg GS, Kendall PC, Sakolsky D, et al: Remission after acute treatment in children and adolescents with anxiety disorders: findings from the CAMS. J Consult Clin Psychol 2011; 79:806–813
57.
Liu H, Li X, Han B, et al: Effects of cognitive bias modification on social anxiety: a meta-analysis. PLoS One 2017; 12:e0175107
58.
Hallion LS, Ruscio AM: A meta-analysis of the effect of cognitive bias modification on anxiety and depression. Psychol Bull 2011; 137:940–958
59.
Heeren A, Mogoașe C, Philippot P, et al: Attention bias modification for social anxiety: a systematic review and meta-analysis. Clin Psychol Rev 2015; 40:76–90
60.
Mogoașe C, David D, Koster EH: Clinical efficacy of attentional bias modification procedures: an updated meta‐analysis. J Clin Psychol 2014; 70:1133–1157
61.
Linetzky M, Pergamin‐Hight L, Pine DS, et al: Quantitative evaluation of the clinical efficacy of attention bias modification treatment for anxiety disorders. Depress Anxiety 2015; 32:383–391
62.
Beard C, Sawyer AT, Hofmann SG: Efficacy of attention bias modification using threat and appetitive stimuli: a meta-analytic review. Behav Ther 2012; 43:724–740
63.
Cristea IA, Mogoașe C, David D, et al: Practitioner review: Cognitive bias modification for mental health problems in children and adolescents: a meta‐analysis. J Child Psychol Psychiatry 2015; 56:723–734
64.
Salum GA, Petersen CS, Jarros RB, et al: Group cognitive behavioral therapy and attention bias modification for childhood anxiety disorders: a factorial randomized trial of efficacy. J Child Adolesc Psychopharmacol 2018; 28:620–630
65.
Scheinost D, Noble S, Horien C, et al: Ten simple rules for predictive modeling of individual differences in neuroimaging. NeuroImage 2019; 193:35–45
66.
Finn ES, Shen X, Scheinost D, et al: Functional connectome fingerprinting: identifying individuals using patterns of brain connectivity. Nat Neurosci 2015; 18:1664–1671
67.
Chronis-Tuscano A, Degnan KA, Pine DS, et al: Stable early maternal report of behavioral inhibition predicts lifetime social anxiety disorder in adolescence. J Am Acad Child Adolesc Psychiatry 2009; 48:928–935
68.
Cartwright-Hatton S, Roberts C, Chitsabesan P, et al: Systematic review of the efficacy of cognitive behaviour therapies for childhood and adolescent anxiety disorders. Br J Clin Psychol 2004; 43:421–436
Information & Authors
Information
Published In
History
Received: 28 February 2023
Revision received: 25 May 2023
Revision received: 28 July 2023
Accepted: 10 August 2023
Published online: 24 January 2024
Published in print: March 01, 2024
Keywords
Authors
Competing Interests
Dr. Kalin’s disclosures appear in the April 2022 issue of the Journal. All other authors report no financial relationships with commercial interests.
Funding Information
This research was supported by NIMH Intramural Research Program project grants ZIAMH002781 (principal investigator, Dr. Daniel S. Pine) and ZIAMH002969 (principal investigator, Dr. Brotman) and was conducted under Clinical Study Protocol 00-M-0192 (ClinicalTrials.gov identifiers: NCT00018057 and NCT03283930).
Metrics & Citations
Metrics
Citations
Export Citations
If you have the appropriate software installed, you can download article citation data to the citation manager of your choice. Simply select your manager software from the list below and click Download.
For more information or tips please see 'Downloading to a citation manager' in the Help menu.
View Options
View options
PDF/EPUB
View PDF/EPUBFigures
FIGURE 1. PARS total score and mean reaction time among youths with anxiety disorders before and after CBTa
aPanel A shows total score on the Pediatric Anxiety Rating Scale (PARS) before, during, and after cognitive-behavioral therapy (CBT) in youths with an anxiety disorder; individual trajectories and the average trajectory at each time point are shown. Panel B shows mean reaction time across all task conditions before and after CBT in youths with an anxiety disorder benchmarked against a group of healthy control youths who completed the task at a matched time interval. Error bars indicate standard deviation.
FIGURE 2. Brain activation patterns showing a main effect of group and a group-by-time-point interactiona
aPanel A shows clusters with a significant group-by-time-point interaction alongside mean percent signal change for a cluster in the right superior parietal lobule for each time point and group. Panel B shows a significant main effect of group in the right amygdala alongside mean percent signal change in this cluster for each time point and group. Error bars indicate standard deviation. Panel C shows a conjunction map illustrating the overlap in brain regions that showed increased stable activation with anxiety across the two developmental time points in the absence of treatment (main effect of anxiety, cluster-corrected) and those regions that changed with treatment in the anxiety group (group-by-time-point interaction, cluster-corrected). CBT=cognitive-behavioral therapy; SCARED=Screen for Child Anxiety Related Emotional Disorders.
Tables
Media
References
References
1.
Walkup JT, Albano AM, Piacentini J, et al: Cognitive behavioral therapy, sertraline, or a combination in childhood anxiety. N Engl J Med 2008; 359:2753–2766
2.
Compton SN, Peris TS, Almirall D, et al: Predictors and moderators of treatment response in childhood anxiety disorders: results from the CAMS trial. J Consult Clin Psychol 2014; 82:212–224
3.
Piacentini J, Bennett S, Compton SN, et al: 24-and 36-week outcomes for the Child/Adolescent Anxiety Multimodal Study (CAMS). J Am Acad Child Adolesc Psychiatry 2014; 53:297–310
4.
La Buissonniere-Ariza V, Fitzgerald K, Meoded A, et al: Neural correlates of cognitive behavioral therapy response in youth with negative valence disorders: a systematic review of the literature. J Affect Disord 2021; 282:1288–1307
5.
LeDoux JE, Pine DS: Using neuroscience to help understand fear and anxiety: a two-system framework. Am J Psychiatry 2016; 173:1083–1093
6.
White LK, Britton JC, Sequeira S, et al: Behavioral and neural stability of attention bias to threat in healthy adolescents. Neuroimage 2016; 136:84–93
7.
Sylvester CM, Pine DS: Pediatric anxiety disorders: insights from basic neuroscience, development, and clinical research. Biol Psychiatry 2021; 89:638–640
8.
Mathews A, Mackintosh B: A cognitive model of selective processing in anxiety. Cognit Ther Res 1998; 22:539–560
9.
Kenwood MM, Kalin NH, Barbas H: The prefrontal cortex, pathological anxiety, and anxiety disorders. Neuropsychopharmacology 2022; 47:260–275
10.
Perino MT, Yu Q, Myers MJ, et al: Attention alterations in pediatric anxiety: evidence from behavior and neuroimaging. Biol Psychiatry 2021; 89:726–734
11.
Fitzgerald KD, Schroder HS, Marsh R: Cognitive control in pediatric obsessive-compulsive and anxiety disorders: brain-behavioral targets for early intervention. Biol Psychiatry 2021; 89:697–706
12.
Sylvester CM, Yu Q, Srivastava AB, et al: Individual-specific functional connectivity of the amygdala: a substrate for precision psychiatry. Proc Natl Acad Sci U S A 2020; 117:3808–3818
13.
White LK, Sequeira S, Britton JC, et al: Complementary features of attention bias modification therapy and cognitive-behavioral therapy in pediatric anxiety disorders. Am J Psychiatry 2017; 174:775–784
14.
Ashworth E, Brooks SJ, Schiöth HB: Neural activation of anxiety and depression in children and young people: a systematic meta-analysis of fMRI studies. Psychiatry Res Neuroimaging 2021; 311:111272
15.
Chavanne AV, Robinson OJ: The overlapping neurobiology of induced and pathological anxiety: a meta-analysis of functional neural activation. Am J Psychiatry 2021; 178:156–164
16.
Lazarov A, Bar-Haim Y: Emerging domain-based treatments for pediatric anxiety disorders. Biol Psychiatry 2021; 89:716–725
17.
Craske MG, Kircanski K, Zelikowsky M, et al: Optimizing inhibitory learning during exposure therapy. Behav Res Ther 2008; 46:5–27
18.
De Silva P, Rachman S: Exposure and fear-reduction. Behav Res Ther 1983; 21:151–152
19.
Foa EB, Kozak MJ: Emotional processing of fear: exposure to corrective information. Psychol Bull 1986; 99:20–35
20.
Beck AT, Emery G, Greenberg RL: Anxiety Disorders and Phobias: A Cognitive Perspective. New York, Basic Books, 2005
21.
Gold AL, Abend R, Britton JC, et al: Age differences in the neural correlates of anxiety disorders: an fMRI study of response to learned threat. Am J Psychiatry 2020; 177:454–463
22.
Kendall PC, Peterman JS: CBT for adolescents with anxiety: mature yet still developing. Am J Psychiatry 2015; 172:519–530
23.
Quirk GJ, Likhtik E, Pelletier JG, et al: Stimulation of medial prefrontal cortex decreases the responsiveness of central amygdala output neurons. J Neurosci 2003; 23:8800–8807
24.
Casey BJ, Glatt CE, Lee FS: Treating the developing versus developed brain: translating preclinical mouse and human studies. Neuron 2015; 86:1358–1368
25.
McClure EB, Adler A, Monk CS, et al: fMRI predictors of treatment outcome in pediatric anxiety disorders. Psychopharmacology (Berl) 2007; 191:97–105
26.
Kujawa A, Swain JE, Hanna GL, et al: Prefrontal reactivity to social signals of threat as a predictor of treatment response in anxious youth. Neuropsychopharmacology 2016; 41:1983–1990
27.
Klumpp H, Keutmann MK, Fitzgerald DA, et al: Resting state amygdala-prefrontal connectivity predicts symptom change after cognitive behavioral therapy in generalized social anxiety disorder. Biol Mood Anxiety Disord 2014; 4:14
28.
Burkhouse KL, Kujawa A, Hosseini B, et al: Anterior cingulate activation to implicit threat before and after treatment for pediatric anxiety disorders. Prog Neuropsychopharmacol Biol Psychiatry 2018; 84:250–256
29.
Maslowsky J, Mogg K, Bradley BP, et al: A preliminary investigation of neural correlates of treatment in adolescents with generalized anxiety disorder. J Child Adolesc Psychopharmacol 2010; 20:105–111
30.
Kaufman J, Birmaher B, Brent D, et al: Schedule for Affective Disorders and Schizophrenia for School-Age Children–Present and Lifetime Version (K-SADS-PL): initial reliability and validity data. J Am Acad Child Adolesc Psychiatry 1997; 36:980–988
31.
Silverman W, Albano A: The Anxiety Disorders Interview Schedule for Children (ADIS-C/P). San Antonio, TX, Psychological Corp, 1996
32.
Linke JO, Jones E, Pagliaccio D, et al: Efficacy and mechanisms underlying a gamified attention bias modification training in anxious youth: protocol for a randomized controlled trial. BMC Psychiatry 2019; 19:246
33.
Abend R, Swetlitz C, White LK, et al: Levels of early-childhood behavioral inhibition predict distinct neurodevelopmental pathways to pediatric anxiety. Psychol Med 2020; 50:96–106
34.
Fox NA, Henderson HA, Rubin KH, et al: Continuity and discontinuity of behavioral inhibition and exuberance: psychophysiological and behavioral influences across the first four years of life. Child Dev 2001; 72:1–21
35.
Degnan KA, Fox NA: Behavioral inhibition and anxiety disorders: multiple levels of a resilience process. Dev Psychopathol 2007; 19:729–746
36.
Silverman WK, Kurtines WM: Anxiety and Phobic Disorders: A Pragmatic Approach. Berlin, Springer Science and Business Media, 1996
37.
Kendall PC, Aschenbrand SG, Hudson JL: Child-focused treatment of anxiety; in Evidence-Based Psychotherapies for Children and Adolescents. Edited by Kazdin AE, Weisz JR. New York, Guilford, 2003, 81–100
38.
The Pediatric Anxiety Rating Scale (PARS): development and psychometric properties. J Am Acad Child Adolesc Psychiatry 2002; 41:1061–1069
39.
Walkup JT, Labellarte MJ, Riddle MA, et al: Fluvoxamine for the treatment of anxiety disorders in children and adolescents. N Engl J Med 2001; 344:1279–1285
40.
Abend R, Pine DS, Bar-Haim Y: The TAU-NIMH Attention Bias Measurement Toolbox. Tel Aviv, Tel Aviv University, School of Psychological Sciences, Laboratory for Research on Anxiety and Trauma, 2014 (https://people.socsci.tau.ac.il/mu/ybh/resources/)
41.
Cox RW: AFNI: software for analysis and visualization of functional magnetic resonance neuroimages. Comput Biomed Res 1996; 29:162–173
42.
Chen G, Saad ZS, Britton JC, et al: Linear mixed-effects modeling approach to fMRI group analysis. Neuroimage 2013; 73:176–190
43.
Chen G, Adleman NE, Saad ZS, et al: Applications of multivariate modeling to neuroimaging group analysis: a comprehensive alternative to univariate general linear model. Neuroimage 2014; 99:571–588
44.
Shrout PE, Fleiss JL: Intraclass correlations: uses in assessing rater reliability. Psychol Bull 1979; 86:420–428
45.
Chen G, Taylor PA, Haller SP, et al: Intraclass correlation: improved modeling approaches and applications for neuroimaging. Hum Brain Mapp 2018; 39:1187–1206
46.
Bishop SJ: Trait anxiety and impoverished prefrontal control of attention. Nat Neurosci 2009; 12:92–98
47.
Bishop SJ, Jenkins R, Lawrence AD: Neural processing of fearful faces: effects of anxiety are gated by perceptual capacity limitations. Cereb Cortex 2007; 17:1595–1603
48.
Basten U, Stelzel C, Fiebach CJ: Trait anxiety modulates the neural efficiency of inhibitory control. J Cogn Neurosci 2011; 23:3132–3145
49.
Price RB, Brown V, Siegle GJ: Computational modeling applied to the dot-probe task yields improved reliability and mechanistic insights. Biol Psychiatry 2019; 85:606–612
50.
Haller SP, Raeder SM, Scerif G, et al: Measuring online interpretations and attributions of social situations: links with adolescent social anxiety. J Behav Ther Exp Psychiatry 2016; 50:250–256
51.
Bar-Haim Y, Lamy D, Pergamin L, et al: Threat-related attentional bias in anxious and nonanxious individuals: a meta-analytic study. Psychol Bull 2007; 133:1–24
52.
Dudeney J, Sharpe L, Hunt C: Attentional bias towards threatening stimuli in children with anxiety: a meta-analysis. Clin Psychol Rev 2015; 40:66–75
53.
Eysenck MW, Derakshan N, Santos R, et al: Anxiety and cognitive performance: attentional control theory. Emotion 2007; 7:336–353
54.
Mohatt J, Bennett SM, Walkup JT: Treatment of separation, generalized, and social anxiety disorders in youths. Am J Psychiatry 2014; 171:741–748
55.
Ginsburg GS, Becker-Haimes EM, Keeton C, et al: Results from the Child/Adolescent Anxiety Multimodal Extended Long-Term Study (CAMELS): primary anxiety outcomes. J Am Acad Child Adolesc Psychiatry 2018; 57:471–480
56.
Ginsburg GS, Kendall PC, Sakolsky D, et al: Remission after acute treatment in children and adolescents with anxiety disorders: findings from the CAMS. J Consult Clin Psychol 2011; 79:806–813
57.
Liu H, Li X, Han B, et al: Effects of cognitive bias modification on social anxiety: a meta-analysis. PLoS One 2017; 12:e0175107
58.
Hallion LS, Ruscio AM: A meta-analysis of the effect of cognitive bias modification on anxiety and depression. Psychol Bull 2011; 137:940–958
59.
Heeren A, Mogoașe C, Philippot P, et al: Attention bias modification for social anxiety: a systematic review and meta-analysis. Clin Psychol Rev 2015; 40:76–90
60.
Mogoașe C, David D, Koster EH: Clinical efficacy of attentional bias modification procedures: an updated meta‐analysis. J Clin Psychol 2014; 70:1133–1157
61.
Linetzky M, Pergamin‐Hight L, Pine DS, et al: Quantitative evaluation of the clinical efficacy of attention bias modification treatment for anxiety disorders. Depress Anxiety 2015; 32:383–391
62.
Beard C, Sawyer AT, Hofmann SG: Efficacy of attention bias modification using threat and appetitive stimuli: a meta-analytic review. Behav Ther 2012; 43:724–740
63.
Cristea IA, Mogoașe C, David D, et al: Practitioner review: Cognitive bias modification for mental health problems in children and adolescents: a meta‐analysis. J Child Psychol Psychiatry 2015; 56:723–734
64.
Salum GA, Petersen CS, Jarros RB, et al: Group cognitive behavioral therapy and attention bias modification for childhood anxiety disorders: a factorial randomized trial of efficacy. J Child Adolesc Psychopharmacol 2018; 28:620–630
65.
Scheinost D, Noble S, Horien C, et al: Ten simple rules for predictive modeling of individual differences in neuroimaging. NeuroImage 2019; 193:35–45
66.
Finn ES, Shen X, Scheinost D, et al: Functional connectome fingerprinting: identifying individuals using patterns of brain connectivity. Nat Neurosci 2015; 18:1664–1671
67.
Chronis-Tuscano A, Degnan KA, Pine DS, et al: Stable early maternal report of behavioral inhibition predicts lifetime social anxiety disorder in adolescence. J Am Acad Child Adolesc Psychiatry 2009; 48:928–935
68.
Cartwright-Hatton S, Roberts C, Chitsabesan P, et al: Systematic review of the efficacy of cognitive behaviour therapies for childhood and adolescent anxiety disorders. Br J Clin Psychol 2004; 43:421–436