Alzheimer’s disease (AD) is a common neurological disease in elderly persons, and it is characterized by cognitive deficits. Apathy is one of the most frequent symptoms in AD patients, and its manifestations include diminished or complete loss of goal-directed behavior, cognitive activity, and emotion. Apathy is found in 55% of AD patients,
1 and correlates highly with loss of cognitive functioning and increasing caregiver burden.
2In 2009, Diagnostic Criteria of Apathy (DCA) were proposed by the French Association for Biological Psychiatry, the European Psychiatric Association, and the European Alzheimer’s Disease Consortium; this has become a unanimous standard diagnostic tool for apathy (see
Data Supplement 1). As DCA noted, AD patients with apathy present with “loss of emotional responsiveness to positive or negative stimuli and/or events, including observer-reports of unchanging affect and significantly reduced emotional reaction to exciting events and emotionally-stimulating news, such as personal loss and serious illnesses.”
3Along with the more-and-more clinical studies completed, many researchers have tried to demonstrate the mechanism of apathy and propose some possible frameworks, especially for patients suffering from AD and other neurodegenerative diseases. Guimarães et al.
4 proposed in their review the framework an explanation for the neurobiology of apathy in AD. They considered that apathy was related to the prefrontal cortex and/or the prefrontal–subcortical circuits, which were related to main manifestations of apathy.
Recently, brain functional-imaging research has used facial emotional expression as stimulation for various kinds of neuropsychiatric disorders. The fusiform gyrus and amygdala were found to play important roles in explicit emotional processing. Surguladze and colleagues
5 measured neuronal activities by event-related fMRI response to happy and sad facial expressions in 14 healthy individuals and 16 individuals with major depressive disorder. They found that depressed individuals demonstrate linear increase in left amygdala and right fusiform gyrus in response to expressions of increasing sadness. Amelia Versace et al.
6 launched an fMRI study on emotional processing in bipolar disorder (BD) patients under emotional facial stimuli. They showed that BD patients, compared with healthy individuals, showed significantly greater right amygdala-orbitofrontal cortex (OFC) functional connectivity in the “sad” experimental stimulus. However, as far as we know, there are fewer studies on AD patients with apathy. In 2007, Marshall et al.
7 researched apathy/metabolic correlates of apathy in AD by use of positron emission tomography (PET), and found that AD was associated with hypometabolism in the medial frontal regions, as compared with those without apathy. However, no relevant studies focused on the emotional-processing deficits of AD patients with apathy, even as their clinical manifestations have been found as loss of spontaneous emotion and emotional responsiveness.
1In 2002, Adolphs et al.
8 proposed a theory on the role of the bilateral fusiform gyrus in explicit emotional processing. Fusar-Poli et al.
9 reviewed 105 studies of fMRI related to emotional faces processing in a metaanalysis and concluded that happy facial stimulation evokes greater activation of the left amygdala. Dannlowski and collaborators
10 found that right amygdala reactivity masks negative facial emotions in 35 depression subjects. All results above are consistent with Adolph’s theory, in which amygdala and fusiform gyrus are proposed to be the key anatomical structures in explicit emotional-processing under sad and other negative emotional stimulations, especially emotional perception.
Seen in a holistic manner, both Phillips et al.
11 and Adolphs
8 proposed their relevant theories and the relevant anatomical structures. The former indicated that emotional perception included three subsequential steps: 1) the identification of the stimulus; 2) the production of response; and 3) the regulation of affective state. The latter proposed that this processing contains two subsequential steps: 1) emotional perception; and 2) recognition. Unanimously, they thought that emotional perception/identification was the first step of this processing, followed by the step of emotional recognition/regulation; these were related to “ventral system” structures, such as the fusiform gyrus, amygdala; and “dorsal system” structures, such as the hippocampus and basal ganglia, respectively.
In recent years, research through both structural
12 and functional neuroimaging studies
13 has found that the amygdala was affected in AD patients, especially in milder cases.
14 More unambiguous findings were reported in animal pathological, human pathological, and human autopsy studies,
15–17 which revealed that the amygdala was involved in the onset of AD.
Functional magnetic resonance imaging (fMRI), based on the Blood Oxygen Level Dependent (BOLD) effect, can distinguish different activation patterns associated with different emotional perceptions. Facial expressions are widely used as stimulation in fMRI research related to emotional-processing mechanisms because of their simple, natural, user-friendly characteristics, and their capability to induce strong subjective experience and physiological changes. In neuroimaging studies, neurobiologists and psychologists have studied the performance of patients with nerve injury, and found that emotional processing involves a wide range of neuroanatomical structures, including the fusiform gyrus, amygdala, and other structures.
9By comparing the relevant brain activities of AD patients with and without apathy under a range of emotional stimulations, we aimed to reveal the possible mechanisms of apathy in AD. In this study, we selected happy, sad, and neutral facial expressions as stimulation to AD patients, and we acquired fMRI imaging data with a 1.5T Siemens instrument. We observed the explicit emotional processing in AD patients with or without apathy, and investigated the possible mechanisms of abnormal emotional processing in these apathetic AD patients.
Methods
Subjects
We reviewed seven AD patients who met DCA criteria as the patient group, and six AD patients without apathy as the control. (Our plan had been to recruit 8 patients for both groups; however, 1 patient from the former group and 2 patients from the latter group, respectively, dropped out.) All patients were from the Department of Neurology of the Changzheng Hospital of the Second Military Medical University. Patients were recruited from January to March of 2012. They met the NINCDS–ADRDA criteria for AD for the first time, and their severity of dementia ranged from mild to moderate without relevant treatment before.
Participants were excluded from the study if they had one of the following indications: neurological dysfunctions (for example, major head injury, stroke, or epilepsy); major psychiatric diseases (for example, schizophrenic disorders or ongoing depressive episode); current multidrug-abuse or use of psychotropic medications, multisystem diseases, and the usual MRI contraindications. All patients in the study were right-handed and had normal visual acuity, smell, and hearing capacity. Groups matched for age, gender, and level of education. Participation was voluntary for all patients, and informed consent was given by patients’ caregivers.
All subjects were examined by one developmental clinical psychologist and one developmental clinical neurologist, who completed a series of Mini-Mental State Exam (MMSE), Geriatric Depression Screening Scale (GDS), and Neuropsychiatric Inventory. Furthermore, in order to strengthen the credibility of the Apathy categorization of our groups, more apathy-assessment tools were applied. We translated the Apathy Evaluation Scale, Clinical version, AES–C) and the Lille Apathy Rating Scale (LARS); our previous research demonstrated that both of these scales in Chinese had satisfactory validity and reliability for Chinese AD patients.
18 Information was collected from caregivers if necessary. The MMSE is a widely used and objective assessment tool of global cognitive functioning for AD patients. The GDS was developed in 1982 by Brink et al.,
19 specifically for elderly subjects. It has 30 items, and its cutoff score is 10. The NPI was developed by Cummings et al.
20 to assess and quantify neurobehavioral disturbances in dementia patients. It has an Apathy subscale, which consists of a general screening item rated on a Yes/No basis. The overall frequency (1–4) and severity (1–3) are then rated. Scores on the NPI Apathy subscale range from 0 to 12, with higher scores indicating more severe apathy. Its ordinary cutoff score is 40.0. The AES was developed by Marin et al. based on the definition of apathy as “a syndrome of loss of motivation as reflected by acquired changes in affect (mood), behavior, and cognition.”
21 The scale comprises 18 core items that assess and quantify the affective, behavioral, and cognitive domains of apathy. The ordinary cutoff score is 40.5 for clinical purposes (AES–C).
22 LARS, which covers 33 items, divided into 9 domains, was developed by Sockeel and colleagues. It is normally used for PD patients, and the ordinary cutoff score is −16.
23 According to our previous reports,
2 all of these Chinese-version scales were effective (see
Table 1).
For demographic and neuropsychological data analysis, group comparisons were made by two-sample t-test and a nonparametric test. Statistical analysis was performed with SPSS 16.0.
Stimuli and Equipment
Facial stimuli consisted of happy, sad, and neutral expressions, deriving from the “Chinese Facial Affective Picture System” (CFAPS). The onset of each stimulus, either a masked face or a gray cross, was triggered by a pulse from the scanner. The image was projected on a computer screen behind the patient’s head within the imaging chamber. The screen was viewed in a mirror by the patients.
The standardized CFAPS was developed at the National Key Laboratory of Cognitive Neuroscience and Learning, Beijing Normal University. This was done in order to avoid race bias (people are better at recognizing faces from their own race relative to faces from other races). The CFAPS includes 600 pictures of fearful, happy, sad, angry, disgusted, surprised, and neutral faces of Asian female and male subjects. These images were rated by both Chinese college students (gender-matched) with respect to the Valence category (unpleasant-to-pleasant) and Arousal level (low-to-high) of the images, on a 9-point scale. ANOVAs revealed that there were significant differences in the Valence and Arousal levels across seven facial expressions (F[6, 593]=333.18; p <0.001; F[6, 593]=82.26; p <0.001, respectively). The pre-test for this system showed that CFAPS is reliable across individuals in emotional inducement (between-subjects reliability scores were 0.986 for Valence and 0.978 for Arousal).
24Pre-Stimuli Responding
Before patients began their fMRI procedure, they were shown on a computer screen nine different emotional pictures, representing positive, negative, and neutral emotional stimuli as pre-stimuli; they were then asked which emotional meaning the picture contained, and their recognition accuracies were checked. Among those nine pictures, each kind of emotional pictures contained three faces. CFAPS provided, along with each picture, its degree of recognition (ranging from 60% to 100%) and emotional intensity (ranging from 1 to 10). We chose the pictures of each kind characterized by mean degree of recognition and emotional intensity to be the pre-stimuli. All the patients showed satisfactory recognition accuracies and ability to respond to the emotions, as well as their intensity. For those pictures we collected as stimuli, as they all have a higher degree of recognition and emotional intensity than mean level, the patients’ perception to the emotional stimuli was guaranteed. The average degree of recognition and emotional intensity of pictures used as pre-stimuli and stimuli are listed in
Data Supplement 2.
Masked Face Paradigm
During fMRI, patients were presented with masked happy (H), masked sad (S), and masked neutral (N) faces, which were organized in a block design. Masked neutral faces were interspersed between masked emotional faces in each block in a pseudo-random order to ensure the unpredictability of emotional faces that were shown to the patients. Each stimulus consisted of a 2.5-second presentation of an emotional face (H, S, or N) followed by a 1.0-second presentation of a neutral face. We designed a total of 9 blocks (3 × H, 3 × S, and 3 × N). Within the happy, sad, and neutral blocks, each patient saw 8 masked emotional faces (H, S, or N) in a predetermined order. The whole paradigm was presented by Shenzhen Sinorad Medical Electronics Inc., and lasted for 300 seconds (see
Data Supplement 2).
Image Acquisition
All image scanning was performed by the GE Signal 1.5T MRI System for Gradient-Recalled Echo-Planar Imaging (GRE-EPI) at the Department of Radiology of Shanghai Changzheng Hospital. T1-weighted images were acquired with a sagittal MP-RAGE three-dimensional sequence (repetition time (TR): 9.56 msec, echo time (TE): 4.3 msec, flip angle: 15°, bandwidth: 17.86 kHz, matrix size: 256 × 192, field of view (FOV): 240 mm × 240 mm), and T2-weighted images were acquired in 5-mm-thick axial slices (TR: 2,500 msec, TE: 35 msec, matrix size: 64 × 64, FOV: 240 × 240 mm). Functional images were collected with an asymmetric spin-echo echo-planar sequence sensitive to BOLD contrast (T2). In each functional run, 3 150 images were collected.
Statistical Analysis
Neuroimaging Data Analysis
We converted imaging data in the nifty format with MRIConvert software (
http://lcni.uoregon.edu/∼jolinda/MRIConvert/). Data processing was performed with SPM8 imaging analysis software (Statistical Parametric Mapping; Wellcome Department of Cognitive Neurology, London;
http://www.fil.ion.ucl.ac.uk/spm) run in Matlab 7.0. Data were first realigned to minimize motion-related artifacts, and smoothed by a Gaussian filter. A mean image was constructed from the realigned image volumes in each run. Image volume was then used to determine the parameters for spatial normalization into the Montreal Neurological Institute (MNI) standardized space, which was used in SPM8. The normalization parameters determined for the mean functional volume were applied to the corresponding functional image volumes for each patient. Finally, the normalized functional images were smoothed with a 6-mm full width at half-maximum Gaussian filter level.
Statistical Tests of Single Individuals, First-Level Analysis
We took convolution following the stimulation mode function by hemodynamic function (hrf) as a design matrix, and estimated the parameters of the time series of functional images by the general linear model (GLM). Then, the statistical parametric maps were obtained through t-test positive/negative/neutral emotional pictures. Statistical differences in single individual activation maps were acquired as unadjusted p value <0.001, and space threshold <10 voxels.
Statistical Tests of Single Individuals, Second-Level Analysis
Based on data from the first-level analysis, statistical parametric maps of both the patient group and the control group were acquired by one-sample t-test. Then, differences in statistical parametric maps between the patient and the control group in response to emotional stimuli were acquired by two-sample t-test. Statistical differences in group activation maps were acquired as unadjusted p value <0.001 and space threshold <10 voxels.
Region of interest (ROI) Analysis
Based on the hypothesis of the role of amygdala activation in emotional processing and its correlation with apathy in AD, predetermined ROIs were focused on the bilateral amygdala and bilateral fusiform gyrus. Based on predetermined ROIs, the magnitude changes in BOLD signals in different groups in response to emotional stimuli were obtained by Marsbar (
marsbar.sourceforge.net/). The percentage changes of BOLD signals in relevant brain regions were calculated with two-sample
t-test, and a threshold p value of 0.001 was used.
Results
Overall Characteristics of Subjects
During the examination, 1 subject from the Patient group and 2 subjects from the Control group quit because of poor endurance of the 300-sec checking time. The Patient group consisted of 3 men and 4 women, and the Control group consisted of 3 men and 3 women. Both groups were matched for age, gender, disease duration, level of education, MMSE, and GDS. There were no significant differences in overall characteristics between the two groups, except in NPI Apathy score (4.85 [SD: 1.06 versus 1.83 [0.40]), Chinese-translated AES–C (−3.85 [6.44] versus −21.66 [4.58]), and Chinese-translated LARS (49.57 [6.99] versus 30.83 [6.70]). Details are shown in
Table 2. There were no significant differences in 12-item NPI between the two groups except on the Apathy subscale.
Regional Brain Activation of all Subjects in Response to Facial-Expression Stimuli
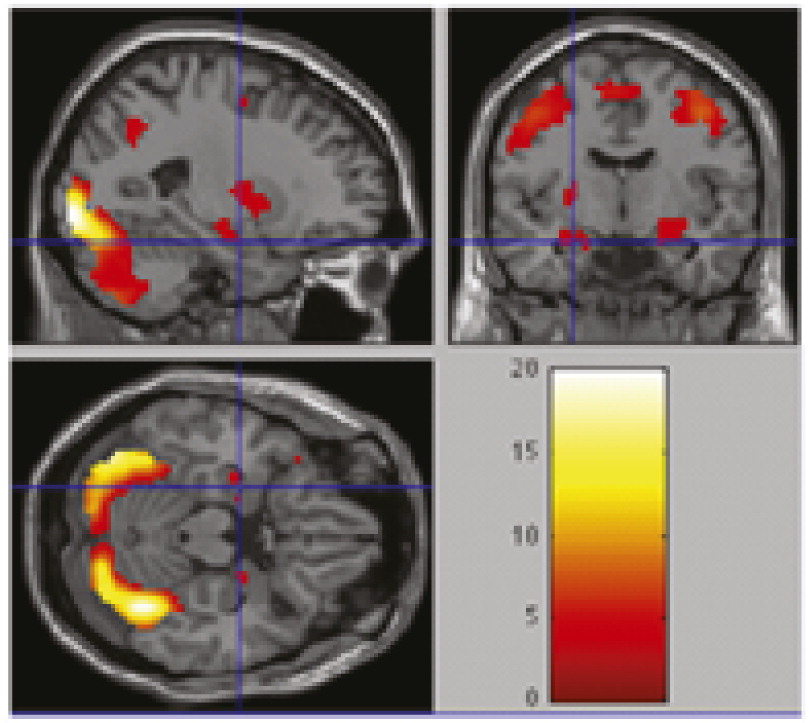
By overlapping magnetic resonance images of all brain activation in response to three kinds of facial expression stimuli (N=13; p=0.001), we obtained the sum of all regions in
Figure 1. Overall regional brain activation of all 13 subjects showed good response to stimulation, with greater levels of response in bilateral amygdala and fusiform gyrus.
Regional Brain Activation of AD Patients Without Apathy in Response to “Sad Versus Neutral” Facial Expression Stimuli
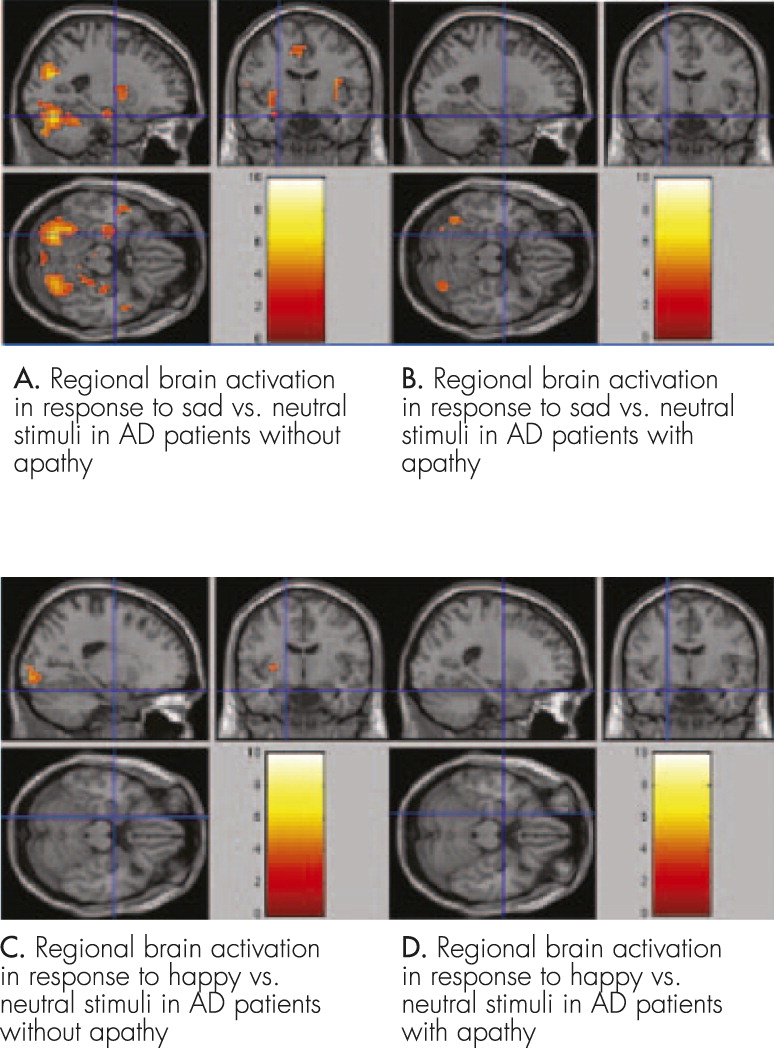
Greater responses were found in left amygdala (
t=3.5641, voxel: 14, coordinates: −30, −7, 4), right amygdala (
t=3.5639, voxel: 10, coordinates: 30, 5, 13), left fusiform gyrus (
t=5.0578, voxel: 26, coordinates: −45, −64, −17), and right fusiform gyrus (
t=4.0889, voxel: 23, coordinates: 42, −76, −14). Details of imaging are shown in
Figure 2 [A].
Regional Brain Activation in AD Patients With Apathy in Response to “Sad Versus Neutral” Facial Expression Stimuli
Greater responses were found in left fusiform gyrus (
t=4.1393, voxel: 1, coordinates: −45, −64, −17), and right fusiform gyrus (
t=4.6656, voxel: 2, coordinates: 42, −76, −14). Details of imaging are shown in
Figure 2 [B].
Regional Brain Activation of All Subjects in Response to “Happy Versus Neutral” Facial Expression Stimuli
There was no significant response in AD patients with or without apathy. Details of imaging are shown in
Figure 2 [C and D]. Our data show that AD patients with apathy have reduced activation in bilateral amygdala compared with patients without apathy.
Discussion
Our study, by using emotional stimuli, found that AD patients with apathy showed a reduced activity in the region of the bilateral amygdala under emotionally negative stimuli, but not positive stimuli, and it demonstrated that amygdalar dysfunction correlated with apathy in AD, which might be helpful to further research on apathy and related mechanisms. This result confirmed Guimarães and his colleagues’ proposed framework of apathy in AD, which showed the basolateral amygdala (BLA) as a key anatomical structure.
4Among all facial emotional stimuli, happy and sad expressions are more commonly used, whereas surprise and disgust are less used because they may cause discriminating bias. In previous studies that used happy and unhappy facial emotional expressions as stimuli, significant results under happy stimuli were usually more difficult to obtain,
5,6,9 especially in those studies taking the amygdala as ROI, although it is easy to understand that goal-oriented behavior commonly links to positive affect. Adolphs
8 pointed that, compared with happy emotions, sad emotion has the same arousal, but much higher valence; this might be the reason. The same observation occurs in our study. Targeting this interesting phenomenon, other researchers have proposed the following possible explanations: 1) Smith et al.
25 proposed that the lower area of the face was informative in recognizing happy expressions, and the upper part of the face was informative in recognizing sad expressions, which means that recognizing happy and sad expressions involves two different mechanisms; 2) Whalen et al.
26 proposed that negative emotional stimulation is more likely correlated with dangers and risks, and thus has higher valence than positive emotional stimulation. The differential amygdala response results from the higher valence of negative emotions than positive emotions; 3) Costafreda et al.
27 and Davis and Whelan
28 proposed that amygdala activation may be related to the degree of ambiguity. Happy stimuli appeared to be less ambiguous than unhappy faces because humans have more experience with happy than with unhappy faces in everyday social interactions and, thus, these seem to be processed faster than negative stimuli.
29 (For MRI comparison of Apathy and Non-Apathy patients under neutral condition, see
Data Supplement 3.)
Apathy and depression were commonly confused with each another in clinical practice because of some symptomatic overlap
30,31 until they were recently found to be distinct in prevalence, treatment, prognosis, and relationship with cognitive functioning. However, few studies apply radiological methods to differentiate these two disorders. Our results indicate that, under sad emotional stimulation, AD patients with apathy have reduced bilateral amygdala activation compared with those without apathy. As reviewed above, greater amygdala activation in response to negative stimuli has been evoked in healthy individuals. Furthermore, in patients with depression, amygdala activation was found to be even greater than normal ones.
32 The difference in amygdala function in apathy and depression suggests that these two disorders can be distinguished radiologically in AD patients, which is consistent with the results by Kang and colleagues.
12 For future studies, it will be necessary to compare apathy with depressive disorders in AD entirely in one study, and disclosure the relationship of apathy and depression in AD.
There are some limitations in our study. First, as fMRI examination is difficult for dementia patients and is an economic burden for researchers, we only collected a total of 13 patients. The limited number of subjects and data limited a more detailed analysis, such as the correlation between patients’ different scale scores and their changes in BOLD signals in relevant brain regions. Second, in Guimarães et al.
4 and Adolphs’
8 theories, there are quite a few other ROIs related to emotional processing (e.g., ventral prefrontal cortex/OFC) that were not included in our study. Actually, much research has traditionally emphasized the role of BLA in emotional processing. The BLA is considered a core component of a subcortical pathway for the rapid detection of emotions during visual processing.
33 Furthermore, some original reports stated that ventromedial prefrontal cortical activation to the International Affective Picture System (IAPS) was modulated by the extent of self-association.
34 As a result, we focused on bilateral amygdala exclusively so as to avoid confounding factors. However, more reports are needed to confirm the function of ventral prefrontal cortex and other brain regions in emotional processing. Third, because MRI examination has its own flaws (such as noise, claustrophobia), the facial stimuli could not last long. As a result, we had to choose only three kinds of pictures, which in our opinion, were most expressive ones. We believe that more detailed investigations need to be carried out in the future.
In conclusion, under “sad-versus-neutral” stimulation, AD patients without apathy had increased activities in bilateral amygdala and bilateral fusiform gyrus, whereas patients with apathy only had increased activities in the bilateral fusiform gyrus. Under “happy-versus-neutral” stimulation, neither groups had significant brain activation. These results may serve as a good reference for the etiology, pathology, and treatment of apathy in AD patients.


