There is controversy whether neuroimaging is clinically useful in the diagnosis and management of attention deficit hyperactivity disorder (ADHD) and other psychiatric disorders.
1–3 Single photon emission CT (SPECT) is a well-known method of neuroimaging thought to show functional activity indirectly via measurement of relative perfusion.
4–8 Visualizing cerebral functional activity may allow better diagnosis and more targeted effective treatment of various psychiatric disorders.
9–16Lee and colleagues reported that children with clinical ADHD show reduced orbitofrontal regional cerebral blood flow on SPECT scan. Treatment with methylphenidate provides improvement of clinical symptoms, as well as normalizing the reduced orbitofrontal activity.
17 Functional MRI (fMRI) also shows dysfunction in the prefrontal cortex in children with ADHD, which again shows a trend toward normalization with methylphenidate treatment.
18,19 Other work shows hypoperfusion in the orbitofrontal regions by SPECT scan of both children and adults with clinical ADHD.
9,11,20Here we present a naturalistic retrospective study where we look for the presence of orbitofrontal hypoperfusion on SPECT scans and consider the sensitivity and the specificity of such findings in predicting which patients have a clinical DSM-IV diagnosis of ADHD.
Methods
Brain SPECT scans were offered to patients of community-based psychiatric clinics and offices presenting with a full spectrum of psychiatric and neuropsychiatric disorders and ranging in age from teenage to geriatric. Scans were not offered for straightforward cases, but only where cases were partially or fully refractory in response to treatment or where diagnoses were complex. Otherwise there was no selection of patients. Scans were performed at a Toronto, Canada, tertiary care hospital and followed the guidelines established by the Society of Nuclear Medicine.
21The patient received 10–20 millicuries of Tc99m-hexamethylpropylene-amine oxime or in some cases Tc99m-ethyl cysteinate dimer.
21 There was a radiation exposure of 3–6 mSv to the patient, which is comparable to a year or so of background radiation, which has not been shown to cause harm to humans,
22 although the debate with regard to safety continues because significantly higher radiation exposures are known to cause harm.
23In what is termed here a “baseline” scan, the patient rested quietly in a semidarkened room prior to and for at least 2 minutes after the injection of the radiotracer. In a “concentration” scan, the patient was asked questions that stimulated prefrontal cortical activity prior to and for at least 2 minutes after the injection of the radiotracer. There is evidence that such stimulation in a patient with ADHD may decrease perfusion in the orbitofrontal cortex,
24–26 although other evidence shows that there may be increased activity in the right dorsolateral prefrontal cortex, particularly with response inhibition stimulation.
27 Within 90 seconds after administration of the radiotracer, there is uptake and retention by different regions of the brain, in approximate proportion to the blood flow to the regions. As the technetium-99m decays, these different regions of the brain will thus then emit different rates of gamma decay photons, in proportion to the regional cerebral blood flow (rCBF) at the time of injection. The relationship between rCBF and regional cerebral activity is the basis for perfusion SPECT.
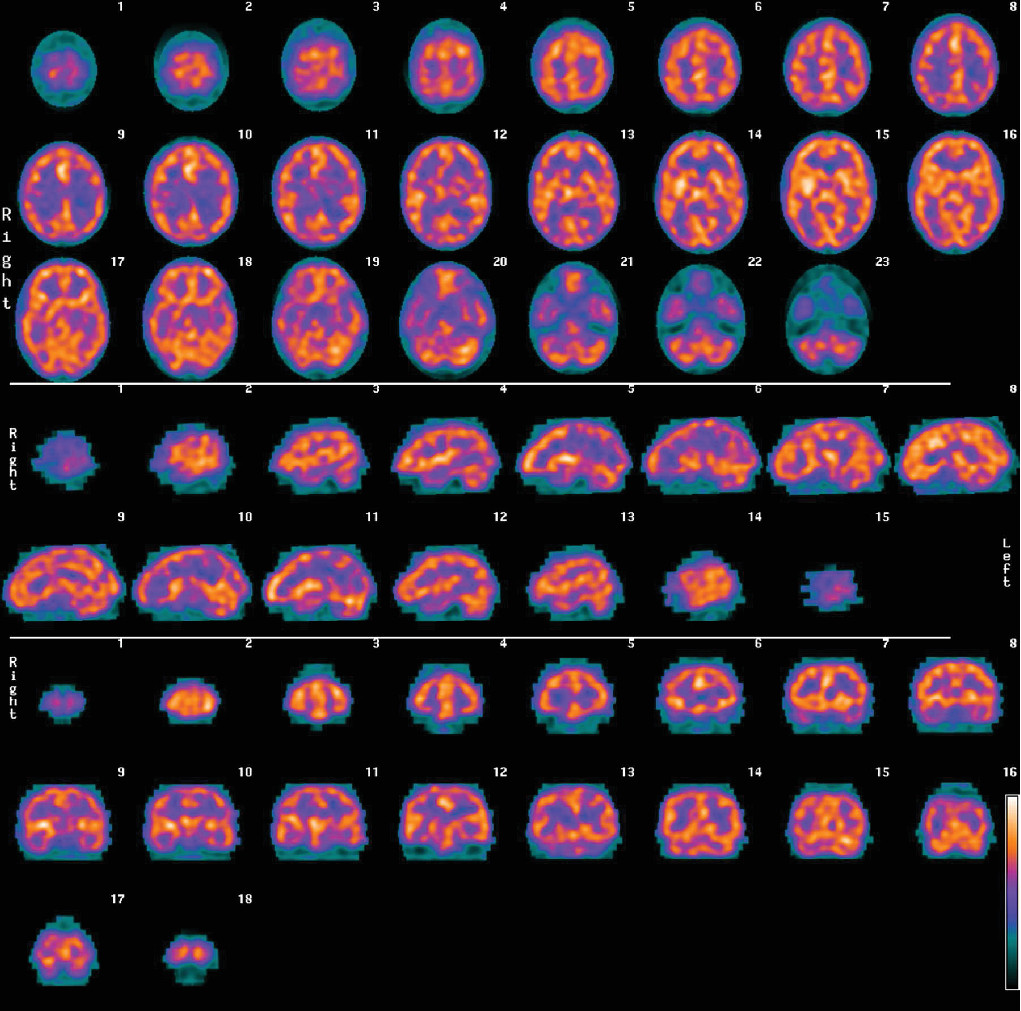
4–7After injection of the radiotracer, there is a waiting period of 30–60 minutes. The patient’s head is then imaged by gamma photon cameras, and a three-dimensional (3D) cloud of pixels representing the gamma radiation from the brain is registered. This cloud of pixels is corrected for attenuation and filtered. It is sliced into orthogonal planes to produce the tomograms of what is termed here a “conventional SPECT” scan. An example of conventional SPECT images (using Tc99m-hexamethylpropylene-amine oxime) of a patient with clinical ADHD is shown in
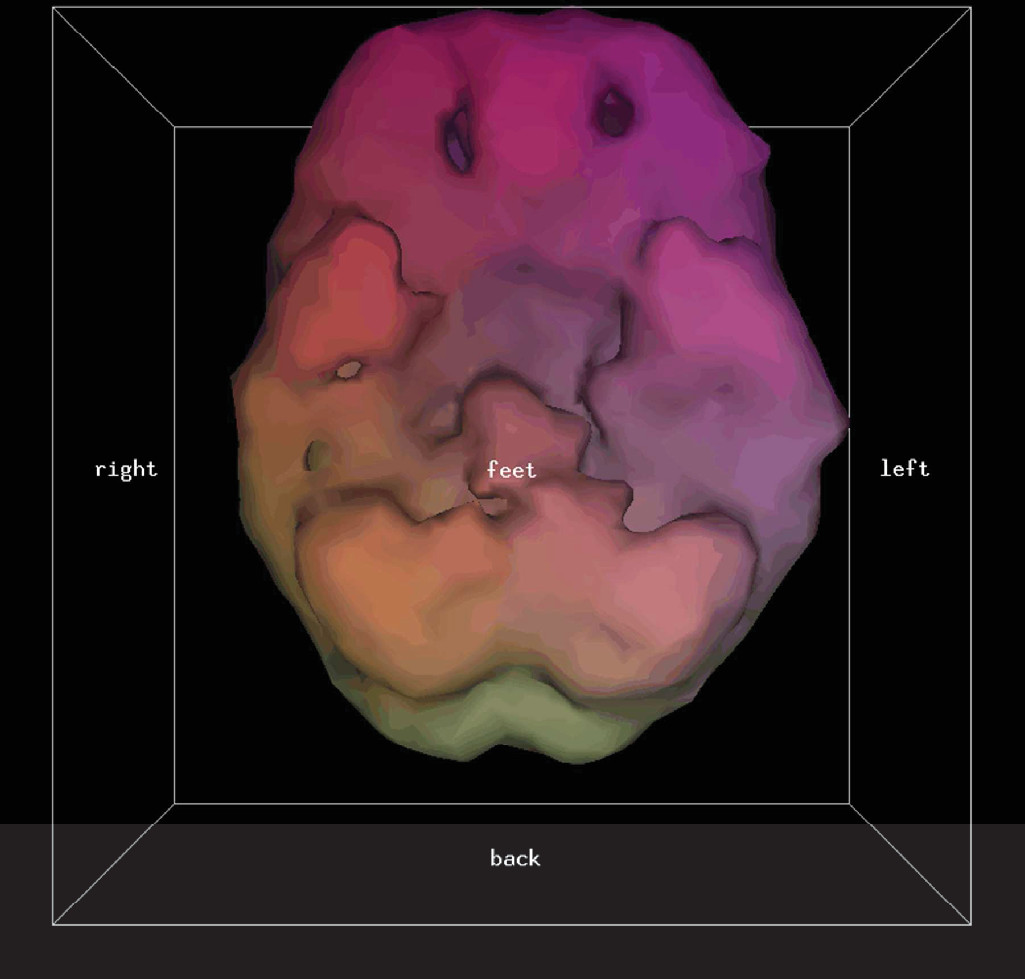
Figure 1. The pixel cloud is then thresholded at a predetermined level (in this study only areas of activity equal to or exceeding 55% of the most active area are kept) and rendered into a solid 3D form of what is termed here a “3D thresholded SPECT” scan. An example of a 3D thresholded SPECT image of the same patient with ADHD corresponding to the conventional tomographic slices of
Figure 1 is shown in
Figure 2. Note that the orbitofrontal perfusion defects (i.e., hypoperfusion) are readily seen in the 3D thresholded image. This is just one view of the 3D image, which can be more fully seen at all angles on a computer workstation.
Scanning Procedures
Most of the scans involved using Tc99m-hexamethylpropylene-amine oxime radiotracer, but due to supply issues, Tc99m-ethyl cysteinate dimer radiotracer was used in 2.6% of patients. There was no relationship to clinical diagnosis or other patient factors with regard to who received which radiotracer. Both radiotracers are approximately equally sensitive for showing prefrontal cortical defects, although the Tc99m-ethyl cysteinate dimer radiotracer tends to be more sensitive for showing temporal lobe defects.
28,29Sixteen percent of patients received concentration scans, i.e., prior to and after injection of the radiotracer, the patient performs mental activities intended to fatigue directed attention capacity. In a concentration scan, the patient was asked to perform progressively harder serial subtractions, as well as spelling words backward and repeating numbers backward until mistakes were being made, and to continue at this level while being interrupted with new subtractions, numbers, and words for 60 seconds prior to the injection of the radiotracer and for at least 2 minutes after injection. Because concentration scans are thought to bring out ADHD features on SPECT scans,
18,24–26 when ADHD or the prefrontal cortical system involvement was suspected in a patient, a concentration scan was often ordered, although this was not done consistently. This variable is handled in the Results section below.
A small intravenous saline line was started prior to administration of the radiotracer, so that the injection of the radiotracer would not be associated with the pain of intravenous insertion. The protocol of either a baseline scan or a concentration scan, as described above, was then followed with regard to injection of the radiotracer. Then the patient waited for an additional 30–60 minutes in the waiting room to allow back diffusion from nonneural structures. The patient’s head was then scanned with a Picker Prism 3000 three-headed camera. The three heads underwent 120 steps, 3° per step, 128 × 128 data matrix, and continuous acquisition. Approximately 22–30 seconds were spent on each step giving a total scan time of approximately 15–20 minutes. A low-energy ultra-high-resolution fan beam collimator was used, and approximately 3–4 million counts in total were obtained. The data then passed through a ramp backprojection filter followed by a 3D Butterworth filter (order, 5.0; cutoff frequency, 0.2–0.3 cycle per pixel based on the mean counts/pixel). Image voxels outside the head/brain region were set to zero by applying a mask to the reconstructed transaxial images. 3D SPECT images were generated via Picker Prism Odyssey Rendering Software.
Image Processing
From the scan data, conventional SPECT images (i.e., the conventional tomographic slices) and 3D thresholded SPECT images (i.e., the thresholded 3D images) were produced for each patient. A 55% setting was used for the threshold; pixels representing areas of activity less than 55% of the highest area were discarded in the production of the 3D image. This threshold reflects the early work of Mena and colleagues
30–32 and has been used by Amen
24 in tens of thousands of SPECT scans.
Statistical parametric mapping is a statistical technique often applied to neuroimaging to statistically show differences in regional cerebral activity.
33 We intended to process all images with statistical parametric mapping but made the active decision not to for the following reasons:
1.
although existing statistical parametric mapping software technically worked with our conventional SPECT image data, it was not technically compatible with the 3D thresholded SPECT image data;
2.
the manual time involved and consequent expense of skilled human labor in applying the statistical parametric mapping software to the image data would not allow the SPECT scans to be justified as a clinical procedure, certainly not a community clinical procedure, in the environment of the local current health care system; and
3.
statistical parametric mapping is theoretically able to delineate areas of decreased perfusion on conventional SPECT scans but proved problematic with our data due to a lack of an adequate normative database matched for age, radiotracer and scanner.
The conventional SPECT scans and the 3D thresholded SPECT scans were then read by the same nuclear medicine physician. Although this physician was not formally blinded to the clinical information, an effort was made to read the images solely on what the scans showed, without influence of the clinical descriptions, and a neuroanatomical rather than a neuropsychiatric report was produced. For every patient, the conventional images were read first, and then the 3D thresholded images were read; in this way, the reading of the 3D thresholded SPECT scan did not influence the reading of the conventional SPECT scan.
Discussion
Within the psychiatric community, there are enthusiastic proponents to clinically use SPECT scanning for psychiatric patients, and there are equally determined opponents.
2,3 In the April-June 2012 issue of the
Journal of Psychoactive Drugs,37 Amen and colleagues write: “SPECT has the potential to add clinically meaningful information to enhance patient care beyond current assessment tools…” However, in the July 2012
Consensus Report of the APA Work Group on Neuroimaging Markers of Psychiatric Disorders,38 the first paragraph of the report states: “…there are currently no brain imaging biomarkers that are currently clinically useful for any diagnostic category in psychiatry.” From the work of the present study, an important reason for the discrepancy between these two viewpoints is the failure to distinguish 3D thresholded SPECT scans from conventional SPECT scans. The bulk of the literature on SPECT imaging, whether the images are read with or without the aid of statistical parametric mapping, does not use thresholding of the image data. The 3D thresholded SPECT scan images are mathematically different than the conventional SPECT images: information has been irreversibly thresholded from the images. The thresholded images actually contain less data than the conventional images, but the experimental results in the present study show that this data transformation allows for a better sensitivity in the diagnosis of ADHD. In the present study in the general psychiatry practice, 3D thresholded SPECT scans gave a sensitivity of 83% in predicting which patients would have a clinical diagnosis of ADHD compared with a sensitivity of 10% for the conventional SPECT scans. A 10% sensitivity hardly makes SPECT scans useful for clinical psychiatric applications, in keeping with the viewpoint of the opponents of this technology, whereas the 83% sensitivity for the 3D thresholded SPECT scans gives a diametrically opposite viewpoint, that with 3D thresholding, SPECT is indeed a useful procedure for certain psychiatric patients.
Although the conventional SPECT scans yielded low sensitivities, they produced high specificities for predicting whether a patient would have a clinical diagnosis of ADHD. As can be seen from
Table 2, for all patients scanned, the conventional SPECT scan gave a specificity of 97%. The conventional SPECT scans were usually read negative for orbitofrontal cortical hypoperfusion. When a positive finding was occasionally found with conventional SPECT, this most likely corresponded to significant clinical prefrontal cortical dysfunction, in which case a clinical diagnosis of ADHD was often present.
From Bayesian probability theory,
39 it is known that medical biomarker tests do not give absolute results, but rather, a test’s performance depends on the prevalence of the value being measured in the population being tested. Looking at
Table 2, significant differences in the positive predictive value of the SPECT scans in predicting which patients will have a DSM-IV diagnosis of ADHD are found among the different psychiatric practices from which patients in this study originate. (No patients originating from the psychotherapy practice had a DSM-IV diagnosis of ADHD, and therefore no separate analysis was made for this practice. However, the true negative and false positive results from this practice do affect overall specificity.) Sensitivities and specificities were also calculated for the 26 patients (6.1% of total patients) who were younger than 18 years old. The 3D thresholded SPECT scan gave a sensitivity of only 42% (95% CI of 23%−64%) for this group. Although many of the patients in this group (as well as other patients in this study) had a clinical diagnosis of ADHD, many had been refractory to treatment and their symptoms such as impulsivity and poor attention may have been due to other comorbid or predominant psychopathologies. An increase in what are scored as false negatives will decrease sensitivity because sensitivity=true positives/(true positives+false negatives).
A major limitation of this study is that the clinical DSM-IV diagnosis was accepted as the reference to which to measure the SPECT scans’ predictions to. Unlike in other areas of medicine where more reliable standards exist (e.g., histopathology can be used as a more reliable reference in a study of the usefulness of SPECT scan predictions with regard to the diagnosis of Alzheimer’s disease
14,40,41), in psychiatry there are few other biomarkers to use. One way to overcome this limitation in future studies is to consider the SPECT scans’ predictions with respect to response to medication and to outcome, in addition to clinical diagnosis.
Another major limitation of this study was the lack of automated interpretation of the SPECT scans. Although cost-effective efficient reading of the 3D thresholded SPECT scans by a human physician bodes well for implementing this technology in the community, from a scientific point of view, it would have been advantageous to have the images scored by machine, for example, statistical parametric mapping software. There is a need to create an adequate normative database matched for age and radiotracer and that can be used with the 3D thresholded-generated data.
An area that requires additional investigation is the protocol used prior to and immediately following injection of the radiotracer. In this study either the patient was told to simply rest in a semidarkened room prior to and immediately after injection of the radiotracer or the patient underwent the concentration scan protocol described above. There is the need to not just replace the concentration scan protocol with a more standardized one for ease of replication but to investigate the effect of a variety of protocols on the sensitivity and specificity of predicting clinical ADHD based on the SPECT scan results. As well, there is the need to evaluate the utility of two different scans a day apart. If the concentration scan is effective in producing changes in the ADHD patient’s prefrontal cortical functioning, then comparing it to the baseline scan may be useful.
9In the present study, there was only a simplistic consideration of orbitofrontal hypoperfusion on the SPECT scan. This study did not take into account other findings on the SPECT scan that could be used to better correlate with particular diagnoses.
34,35 It is known that functional abnormalities occur in ADHD patients in regions away from the prefrontal cortex.
26,35 For example, patients with ADHD often show cerebellar hypoperfusion on SPECT scan.
24,35 Other diagnostic etiologies, e.g., head trauma, schizophrenia, and fibromyalgia, for example, are also associated with prefrontal cortical defects. However, these disorders have patterns on SPECT scan different than what is seen for ADHD.
13,16,42,43 A patient with ADHD and a patient with fibromyalgia may both have orbitofrontal cortical defects, but the fibromyalgia patient will typically have other significant findings.
16,42 Defects (i.e., hypoperfusion) in the orbitofrontal cortex in patients with fibromyalgia (or other conditions) will cause an increase in the scoring of patients as false positives, which, limiting the examination of the SPECT scan to orbitofrontal cortical perfusion as in the present study, will decrease the specificity of the 3D SPECT scan in predicting clinical ADHD.


