Full access
Regular Articles
Published Online: 9 November 2015

Preliminary Investigation of Cerebral Blood Flow and Amyloid Burden in Veterans With and Without Combat-Related Traumatic Brain Injury

Publication: The Journal of Neuropsychiatry and Clinical Neurosciences

Abstract

This study aimed to examine global and regional cerebral blood flow and amyloid burden in combat veterans with and without traumatic brain injury (TBI). Cerebral blood flow (in milliliters per minute per 100 mL) was measured by quantitative [15O]water, and amyloid burden was measured by [11C]PIB imaging. Mean global cerebral blood flow was significantly lower in veterans with TBI compared with non-TBI veterans. There were essentially no differences between groups for globally normalized regional cerebral blood flow. Amyloid burden did not differ between TBI and non-TBI veterans. Veterans who have suffered a TBI have significantly lower cerebral blood flow than non-TBI controls but did not manifest increased levels of amyloid, globally or regionally.
In recent U.S. military conflicts, specifically Operation Iraqi Freedom and Operation Enduring Freedom, traumatic brain injury (TBI) has become the “signature wound,” with an estimated 28% of medical evacuees experiencing this type of injury.1 The pathophysiology of blast-induced TBI has been extensively reviewed,25 and a complete description is beyond the scope of this article. However, by consensus, the pathological changes observed in blast-induced neurotrauma are produced by complex biophysical mechanisms, which include the kinetic energy effects of blast pressure waves and the effects of acceleration and rotational forces resulting from the victim being hit by blunt objects and/or being thrown against the bodywork of a military vehicle or structure. In severe blasts, brain damage may be accentuated by systemic factors such as hypoxia or hypotension.2,3 Current understanding of the neuropathology of blast-induced and combat-related TBI has been derived primarily from in vitro6 and animal models,710 as well as from autopsy findings in Operation Iraqi Freedom/Operation Enduring Freedom veterans who have died from other causes 2–5 years postdeployment.7,11 From these investigations, the most consistent findings have been the presence of multifocal axonal damage, widespread microvascular disease, and chronic CNS inflammation.6,810 In addition, recent [18F]fluorodeoxyglucose positron emission tomography work in Operation Iraqi Freedom veterans with a history of mild TBI and persistent postconcussive symptoms showed regional evidence of cerebral hypometabolism.12
In addition to the above-reported neuropathological changes, there is epidemiological evidence of an association between a history of TBI and the development of dementia later in life.13,14 Amyloid plaques are the hallmark pathology of Alzheimer’s disease, and they are hypothesized to be a possible link between TBI and the enhanced risk for dementia. More than 20 years ago, it was found that approximately 30% of patients dying hours to days after a TBI manifested amyloid plaques,15 even in children as young as 10 years old.16 The pathological cascades associated with the cellular and biochemical processes that result in amyloid accumulation after brain trauma have been reviewed by Johnson et al.17 and Mannix and Whalen.18 Recent work has examined the potential utility of [11C]PIB to image amyloid deposition in humans with an acute TBI (between 1 and 361 days from the event)19 and in chronic neuropsychological impairment after a TBI (5–129 months from the event).20 Increased [11C]PIB distribution volume ratios and standardized uptake value ratios in the cortical gray matter (GM) and striatum were observed in patients after acute TBI compared with controls.19 However, in the chronic TBI series, only three of 12 subjects were amyloid positive with no correlation between [11C]PIB binding potential and “severity of injury; initial CT findings; elapsed time from the injury to examination; or neuropsychological test scores.”20 In both series, the mechanism of injury was attributable to a traffic accident, except for one fall and one assault. None of the human studies to date have addressed the amyloid burden during the chronic stages of blast-related TBI.
The consequences of these multifaceted pathophysiological processes underlying combat-related TBI have the potential to manifest in alterations in cerebrovascular function.4,6,21 Therefore, we hypothesized that veterans with TBI would exhibit differences in global cerebral blood flow (gCBF) and/or regional CBF (rCBF) and amyloid burden compared with veterans with similar combat experiences but without a history of TBI. The purpose of this research was to 1) examine rCBF and gCBF in response to emotionally evocative videos depicting real-life situations using [15O]water positron emission tomography imaging and 2) evaluate the amyloid burden using [11C]PIB in Operation Iraqi Freedom/Operation Enduring Freedom veterans with and without TBI.

Methods

TBI Definition

The Department of Veterans Affairs and the Department of Defense define TBI as a traumatically induced structural injury and/or physiological disruption of brain function that is associated with one of the following: any period of loss of or a decreased level of consciousness, any loss of memory for events immediately before or after the injury, any alteration in mental state at the time of the injury, neurological deficits that may or may not be transient, or an intracranial lesion.22
For this study, a more conservative definition of TBI was used such that in order to be considered a TBI case, a veteran would have had a TBI plus either loss of consciousness and/or posttraumatic amnesia >30 minutes. Exclusion criteria included a penetrating brain injury and associated spinal cord injury, as well as evidence of a neurological condition other than TBI or the presence of a neuroimmunological disorder, schizophrenia, schizoaffective disorder, or severe coexisting medical illnesses.

Subjects

The subject group consisted of a sample of 21 Operation Iraqi Freedom/Operation Enduring Freedom male combat veterans recruited from consecutive referrals to the Polytrauma Services at the Iowa City Veterans Administration Medical Center. Ten of these patients had experienced a TBI during their deployment. Two subjects with TBI were excluded: one subject was excluded because he was unable to undergo magnetic resonance imaging, and the other was excluded because he did not undergo the [11C]PIB component of the study and did not have quantitative CBF data because of a failure to secure an arterial line during the [15O]water part of the study. One TBI subject had [11C]PIB data only. Four TBI subjects had a history of multiple blast exposures. After reviewing all sources of information related to the traumatic episodes and estimating the length of posttraumatic amnesia, we classified five of these patients as having had a mild TBI and three patients as having had a TBI within the moderate to severe range. The remaining veterans (N=11) did not have a history of combat-related TBI during deployment. Three non-TBI subjects had [11C]PIB data only. None of the remaining 19 subjects (N=7 TBI and N=8 non-TBI with quantitative CBF data; and N=8 TBI and N=11 non-TBI with [11C]PIB data) had clinically identifiable lesions on anatomical T1 and T2 magnetic resonance imaging scans. All subjects gave written informed consent in accordance with policies of the University of Iowa and the Iowa City Veterans Administration Medical Center institutional review boards as well as the University of Iowa Medical Radiation Protection Committee. The purpose and rationale for genetic testing and the nondisclosure were explicitly addressed in the consent, and the subject had the option of declining this testing.

Psychiatric Assessment and Apolipoprotein E Status

All subjects underwent a psychiatric assessment before imaging, consisting of measures from the following instruments: the Clinician-Administered PTSD Scale,23 the Hamilton Depression Rating Scale,24 and the Alcohol Use Identification Test.25 In addition, apolipoprotein E4 status was available for seven of 11 non-TBI controls and seven of eight TBI subjects. None of the subjects were receiving medications with potential vasoactive effects (e.g., antihypertensive medications, beta-blockers, or calcium channel blockers). Subjects who were receiving psychotropic medications (generally antidepressants) had been receiving a stable dose for at least 4 weeks. Medications were withheld the day before the imaging procedures and were then resumed immediately after study completion.

[15O]Water Imaging and Analysis

CBF was measured using previously described quantitative [15O]water (1665 MBq/injection) imaging methods.26 Subjects underwent imaging dynamically (20×5 seconds/frame=100 seconds) using an ECAT EXACT HR+ (Siemens Medical Solutions USA, Inc., Knoxville, Tenn.) while watching videos designed to induce increasing levels of emotional stress (H2O1, relaxing; H2O2, noncombat, low stress [city driving]; and H2O3 and H2O4, combat stress [improvised explosive device]). Activity images were created by summing the first 40 seconds postbolus transit and then iteratively reconstructing the summed data (two iterations/eight subsets, zoom=2.57, Gaussian filter, full width at half maximum=5.0 mm, brain mode=on, axial filtering=on, and scatter correction=on). Parametric (i.e., flow) images were created using the pixel-wise modeling module of PMOD Biomedical Image Quantification software (PXMOD version 3.5; PMOD Technologies Ltd., Zurich, Switzerland) from the summed activity image and the associated arterial input function.27 Flow images were coregistered to individual structural magnetic resonance imaging from which cortical and subcortical regions had been determined using FreeSurfer and BRAINS228 software. We determined gray matter (GM), white matter (WM), gCBF, and rCBF (in milliliters per minute per 100 mL) for each condition. In addition, coregistered magnetic resonance imaging and flow images were analyzed using the PMOD Neuro Tool (version 3.5). This tool provides for brain parcellation based on T1-weighted magnetic resonance imaging segmentation and the assignment of brain volumes of interest (N=78) based on this segmentation, using a maximum probability atlas.29 In addition, this tool derives partial volume–corrected concentrations for the volumes of interest based on the geometric transfer matrix described by Rousset et al.30

[11C]PIB Imaging and Analysis

[11C]PIB was prepared according to the methods in and met all specifications detailed in the CMC section of the University of Iowa’s Investigational New Drug Application (no. 109,386, principal investigator Dr. Michael M. Graham). To determine amyloid burden, subjects underwent dynamic imaging with [11C]PIB (15 mCi±10%) for 90 minutes, commencing at injection.31,32 Similar to the procedures described above for [15O]water, imaging was performed on an ECAT EXACT HR+ device with transmission performed before the tracer injection. The dynamic emission images were coregistered to structural magnetic resonance imaging for region definition. The distribution volume ratio was calculated for each region using the simplified reference tissue method 2 as implemented by the PMOD Kinetic Modeling Tool (PKIN, version 3.5) and the bilateral cerebellar GM as the reference tissue. In addition, the dynamic frames acquired from 50 to 70 minutes postadministration were summed to create a static image. This static image was converted to standardized uptake values and was then normalized by the standardized uptake value in the cerebellar GM to create a standardized uptake value ratio image. The global amyloid burden was determined by calculating a cortical retention ratio, defined as the volume-weighted mean of either the standardized uptake value ratio or the distribution volume ratio values for the frontal, parietal, lateral, temporal, and cingulate regions.

Statistical Analyses

Univariate comparisons between the groups were performed using the Wilcoxon rank sum test for continuous variables and the Fisher’s exact test for categorical variables. Means and standard deviations are reported for continuous measures. A nonparametric measure of effect size that characterizes the degree of separation of the distributions of the two groups compared (theta33) is reported, along with 95% confidence intervals.34 A theta value equal to 0.5 denotes no difference between the groups. For more details about the interpretation of this effect size measure, see Newcombe.33
The quantitative [15O]water data were analyzed using a repeated-measures linear model to predict gCBF. The following factors were considered: group (TBI cases versus non-TBI controls), condition (scans), and interaction between group and condition. The lack of independence between the conditions was accounted for by using the condition as a repeated-measures factor and a compound symmetric structure for the variance covariance matrix for the conditions. After suitable models were fit, the levels of factors showing statistical significance were compared using post hoc contrasts implementing a Tukey adjustment for multiple comparisons.
A similar analytic strategy was used to assess hemispheric cortical and WM [11C]PIB uptake between the groups. In this case, the brain side (right versus left) was considered as a repeated measure within each subject. After suitable models were fit, the levels of factors showing statistical significance were compared using post hoc contrasts implementing a Tukey adjustment for multiple comparisons.
To compare regional [15O]water or [11C]PIB uptake data, a massive nonparametric univariate comparison approach controlled by the false discovery rate35 was used.

Results

Background Characteristics and Psychiatric Assessment

Demographic, cardiovascular, and psychiatric measures are described in Table 1. The groups did not significantly differ with regard to age, education, time since trauma or return from deployment, severity of posttraumatic stress disorder (Clinician-Administered PTSD Scale total score) or depressive symptoms (Hamilton Depression Rating Scale score), or effects of alcohol use (Alcohol Use Identification Test score). Furthermore, there was no evidence that the groups differed cognitively, because there were no significant differences in any of the neuropsychological tests assessing attention, processing speed, working memory, verbal and visual learning, or executive functions. None of the subjects had significant medical comorbidities, except for one TBI subject with recently diagnosed and appropriately controlled type 2 diabetes. Only three subjects (one non-TBI control and two TBI subjects) had a single apolipoprotein E ε4 allele; therefore, this factor was not included in any analyses.
TABLE 1. Subject Characteristics by Group (Non-TBI Controls Versus TBI Cases)a
CharacteristicNon-TBI Controls (N=11)TBI Cases (N=8)
Demographic information  
 Age (years)30.4 (5.2)34.6 (7.8)
 Education (years)13.6 (1.6)14.5 (2.4)
 Time since trauma or return from deployment (months)37.5 (30.2)39.0 (11.9)
Neuropsychological information  
 Clinician-Administered PTSD Scale total score54.1 (26.6)48.4 (29.7)
 Hamilton Depression Rating Scale score17.0 (8.7)16.1 (8.9)
 Alcohol Use Identification Test score7.9 (4.6)7.3 (5.7)
Cardiovascular risk information  
 Smoking (%)27.366.7
 Diabetes (%)012.5
 Hypercholesterolemia (%)9.10
 Systolic blood pressure (mm Hg)123.9 (10.3)119.0 (6.6)
 Body mass index (kg/m2)27.2 (5.4)25.6 (3.2)
TBI information  
 Clinical severitybMild (N=5); moderate to severe (N=3)
a
Data are presented as means (standard deviations) or percentages. IED, improvised explosive device; PTA, posttraumatic amnesia; TBI, traumatic brain injury.
b
TBI subject history is as follows. Mild indicates a duration of PTA >30 minutes but <24 hours. Cases 4–8 had blast-related mild TBI resulting from exposure to IEDs and mortar bombs. The number of blast exposures was 5, 15, 1, 2, and 1 for cases 4–8, respectively. Moderate to severe indicates a duration of PTA >24 hours and <3 weeks. Case 1 was a veteran who was injured in a rollover of his vehicle. Case 2 was a veteran who was injured when his helicopter was shot down by a rocket-propelled grenade. Case 3 was a veteran who was injured when his vehicle was impacted by an IED.

gCBF

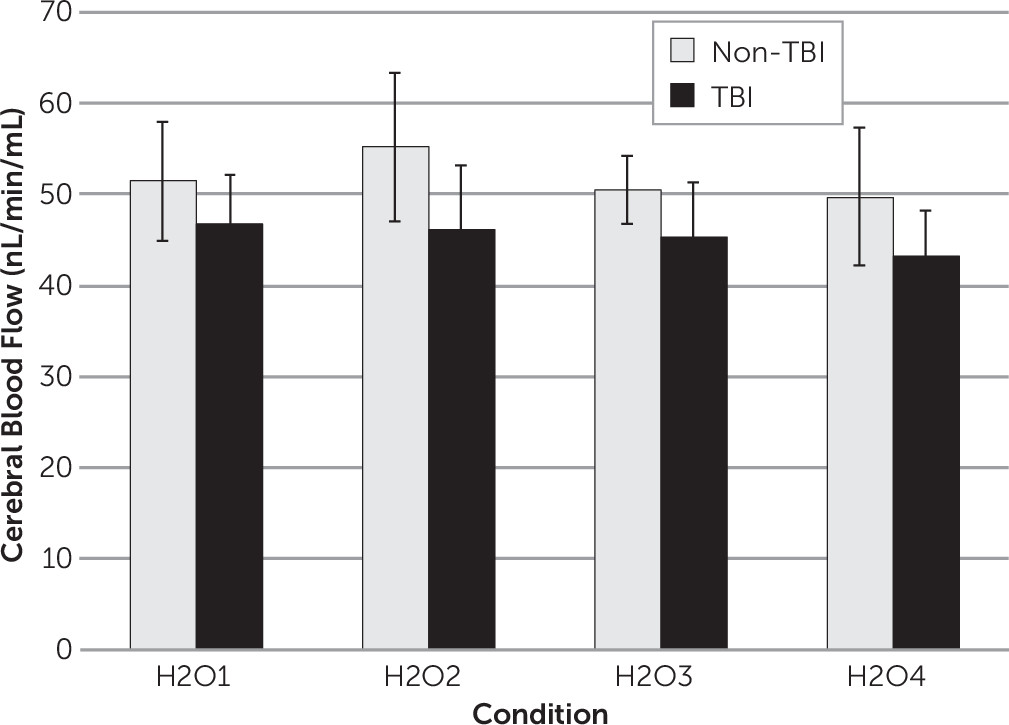
gCBF differed significantly between the TBI and non-TBI subjects. After adjusting for the interaction between the groups (i.e., TBI versus non-TBI) and the conditions (F(3,37)=0.93, p=0.44), the TBI group had lower gCBF than the non-TBI group on average over the four scans (mean gCBF=45.4 [SD=4.5] versus 51.7 [SD=5.8] mL/min per 100 mL, theta=0.16, 95% confidence interval=0.05–0.46, F(1,13)=5.36, p=0.04). In addition, the gCBF differed between conditions (F(3,37)=3.13, p=0.04). On average, over the two groups, the low-stress condition H2O2 had higher gCBF than the high-stress (i.e., combat) condition H2O4 (t(37)=2.93, Tukey-adjusted p=0.03; Figure 1). gCBF values determined using the alternative methodology (PMOD Neuro Tool) were in complete agreement with those determined from FreeSurfer and Brains2 software (intraclass correlation=0.981, mean difference=0.5%) and resulted in similar findings with respect to the group comparisons. For partial volume–corrected values, after adjusting for the interaction between the groups and the conditions (F(3,37)=0.89, p=0.46), the TBI group had lower gCBF than the non-TBI group on average over the four scans (mean gCBF=57.4 [SD=6.4] versus 65.0 [SD=5.9], theta=0.27, 95% confidence interval=0.10–0.57, F(1,13)=5.61, p=0.03). In addition, the gCBF differed between conditions (F(3,37)=3.34, p=0.03). On average, over the two groups, the low-stress condition H2O2 had higher gCBF than the high-stress (i.e., combat) condition H2O4 (t(37)=2.91, Tukey-adjusted p=0.03).
FIGURE 1. Mean Global Cerebral Blood Flow by Condition as Described for Subjects With and Without a Traumatic Brain Injurya
aTBI, traumatic brain injury.
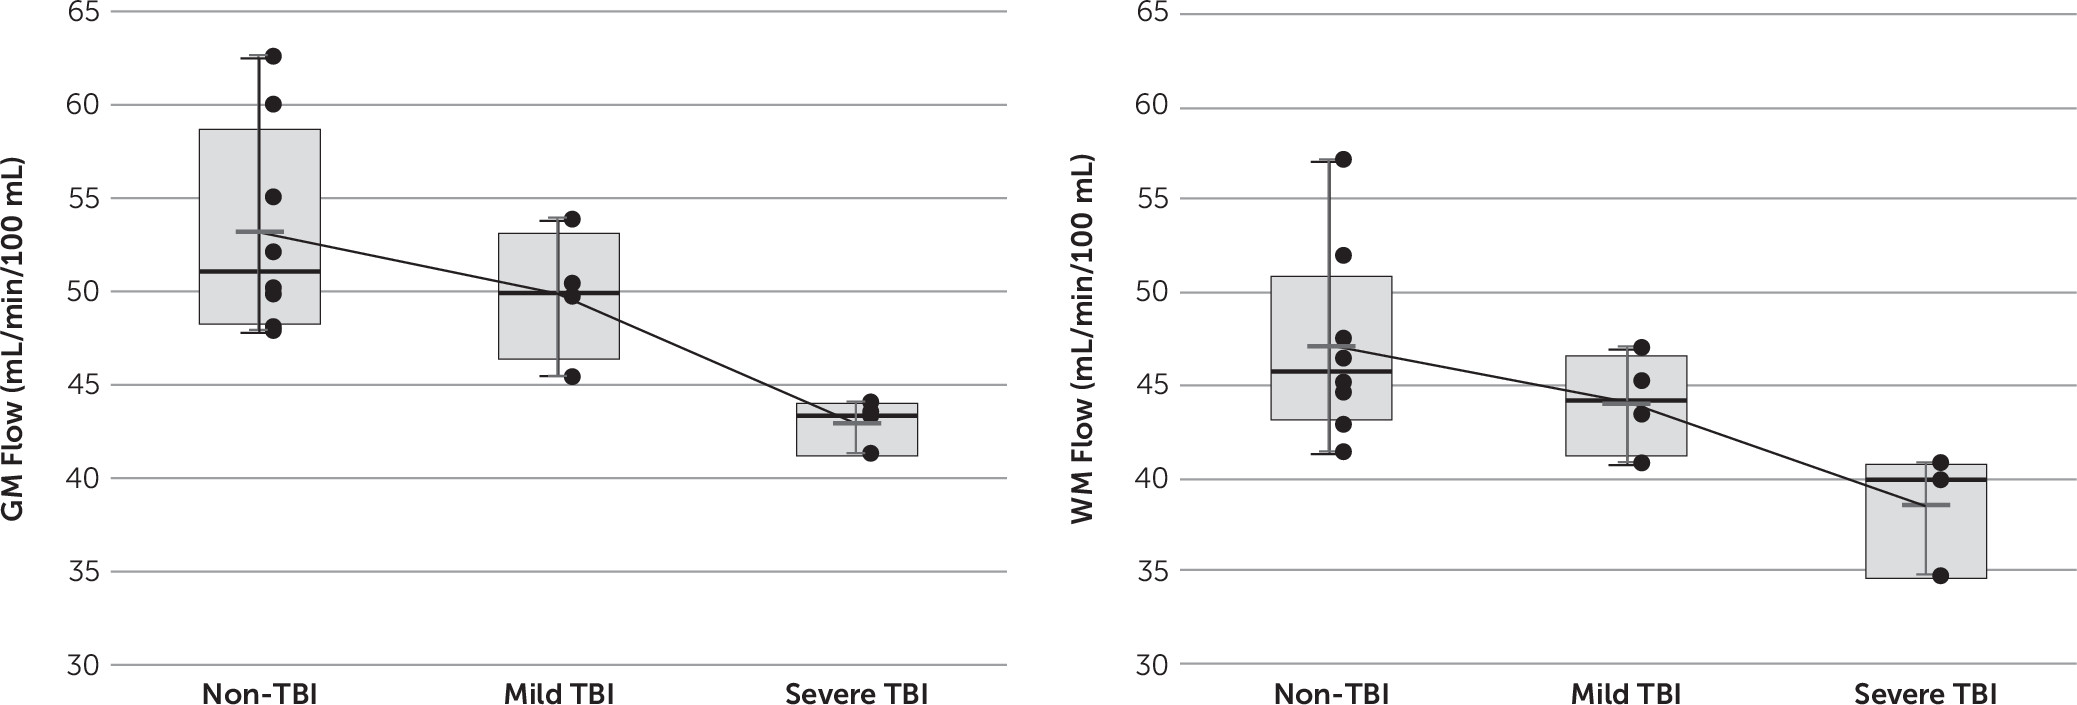
The same gCBF pattern (i.e., lower flow in TBI subjects) was exhibited by the WM and GM as was observed for the brain as a whole (gCBF). After adjusting for the interaction between the groups and the conditions (F(3,37)=0.85, p=0.47), the TBI group had lower WM CBF than the non-TBI group on average over the four scans (WM CBF: mean=41.8 [SD=4.0] versus mean=47.3 [SD=5.1] mL/min per 100 mL, theta=0.20, 95% confidence interval=0.06–0.50, F(1,13)=5.36, p=0.04) and lower GM CBF than the non-TBI group (GM CBF: mean=47.0 [SD=4.5] versus mean=53.3 [SD=5.5] mL/min per 100 mL, theta=0.20, 95% confidence interval=0.06–0.50, F(1,13)=5.67, p=0.03). The more severely affected the subject, the lower the CBF for both GM and WM (Figure 2).
FIGURE 2. Box Plots of the Mean Blood Flow for Global Gray Matter (Left) and Global White Matter (Right)a
a Box plots are shown in milliliters per minute per 100 mL for non-TBI subjects and mildly and moderate to severely affected subjects with TBI, as detailed in Table 1. The moderate to severely affected subjects were significantly different from the non-TBI controls (p=0.02, Wilcoxon) for both gray matter and white matter, with a trend toward significance for the comparisons between mildly affected TBI subjects and non-TBI controls (p=0.05 and p=0.11, Wilcoxon, respectively). GM, gray matter; TBI, traumatic brain injury; WM, white matter.
Given the small sample size, this study was underpowered to detect an interaction between the groups and the conditions. However, post hoc contrasts adjusted for multiple comparisons showed that for the non-TBI controls, the gCBF for H2O2 (i.e., city driving) was significantly higher than the gCBF for H2O4 (i.e., second viewing of the combat scenario) (t(37)=2.71, Tukey-adjusted p=0.05). For the TBI cases, there were no significant differences between the conditions.

rCBF

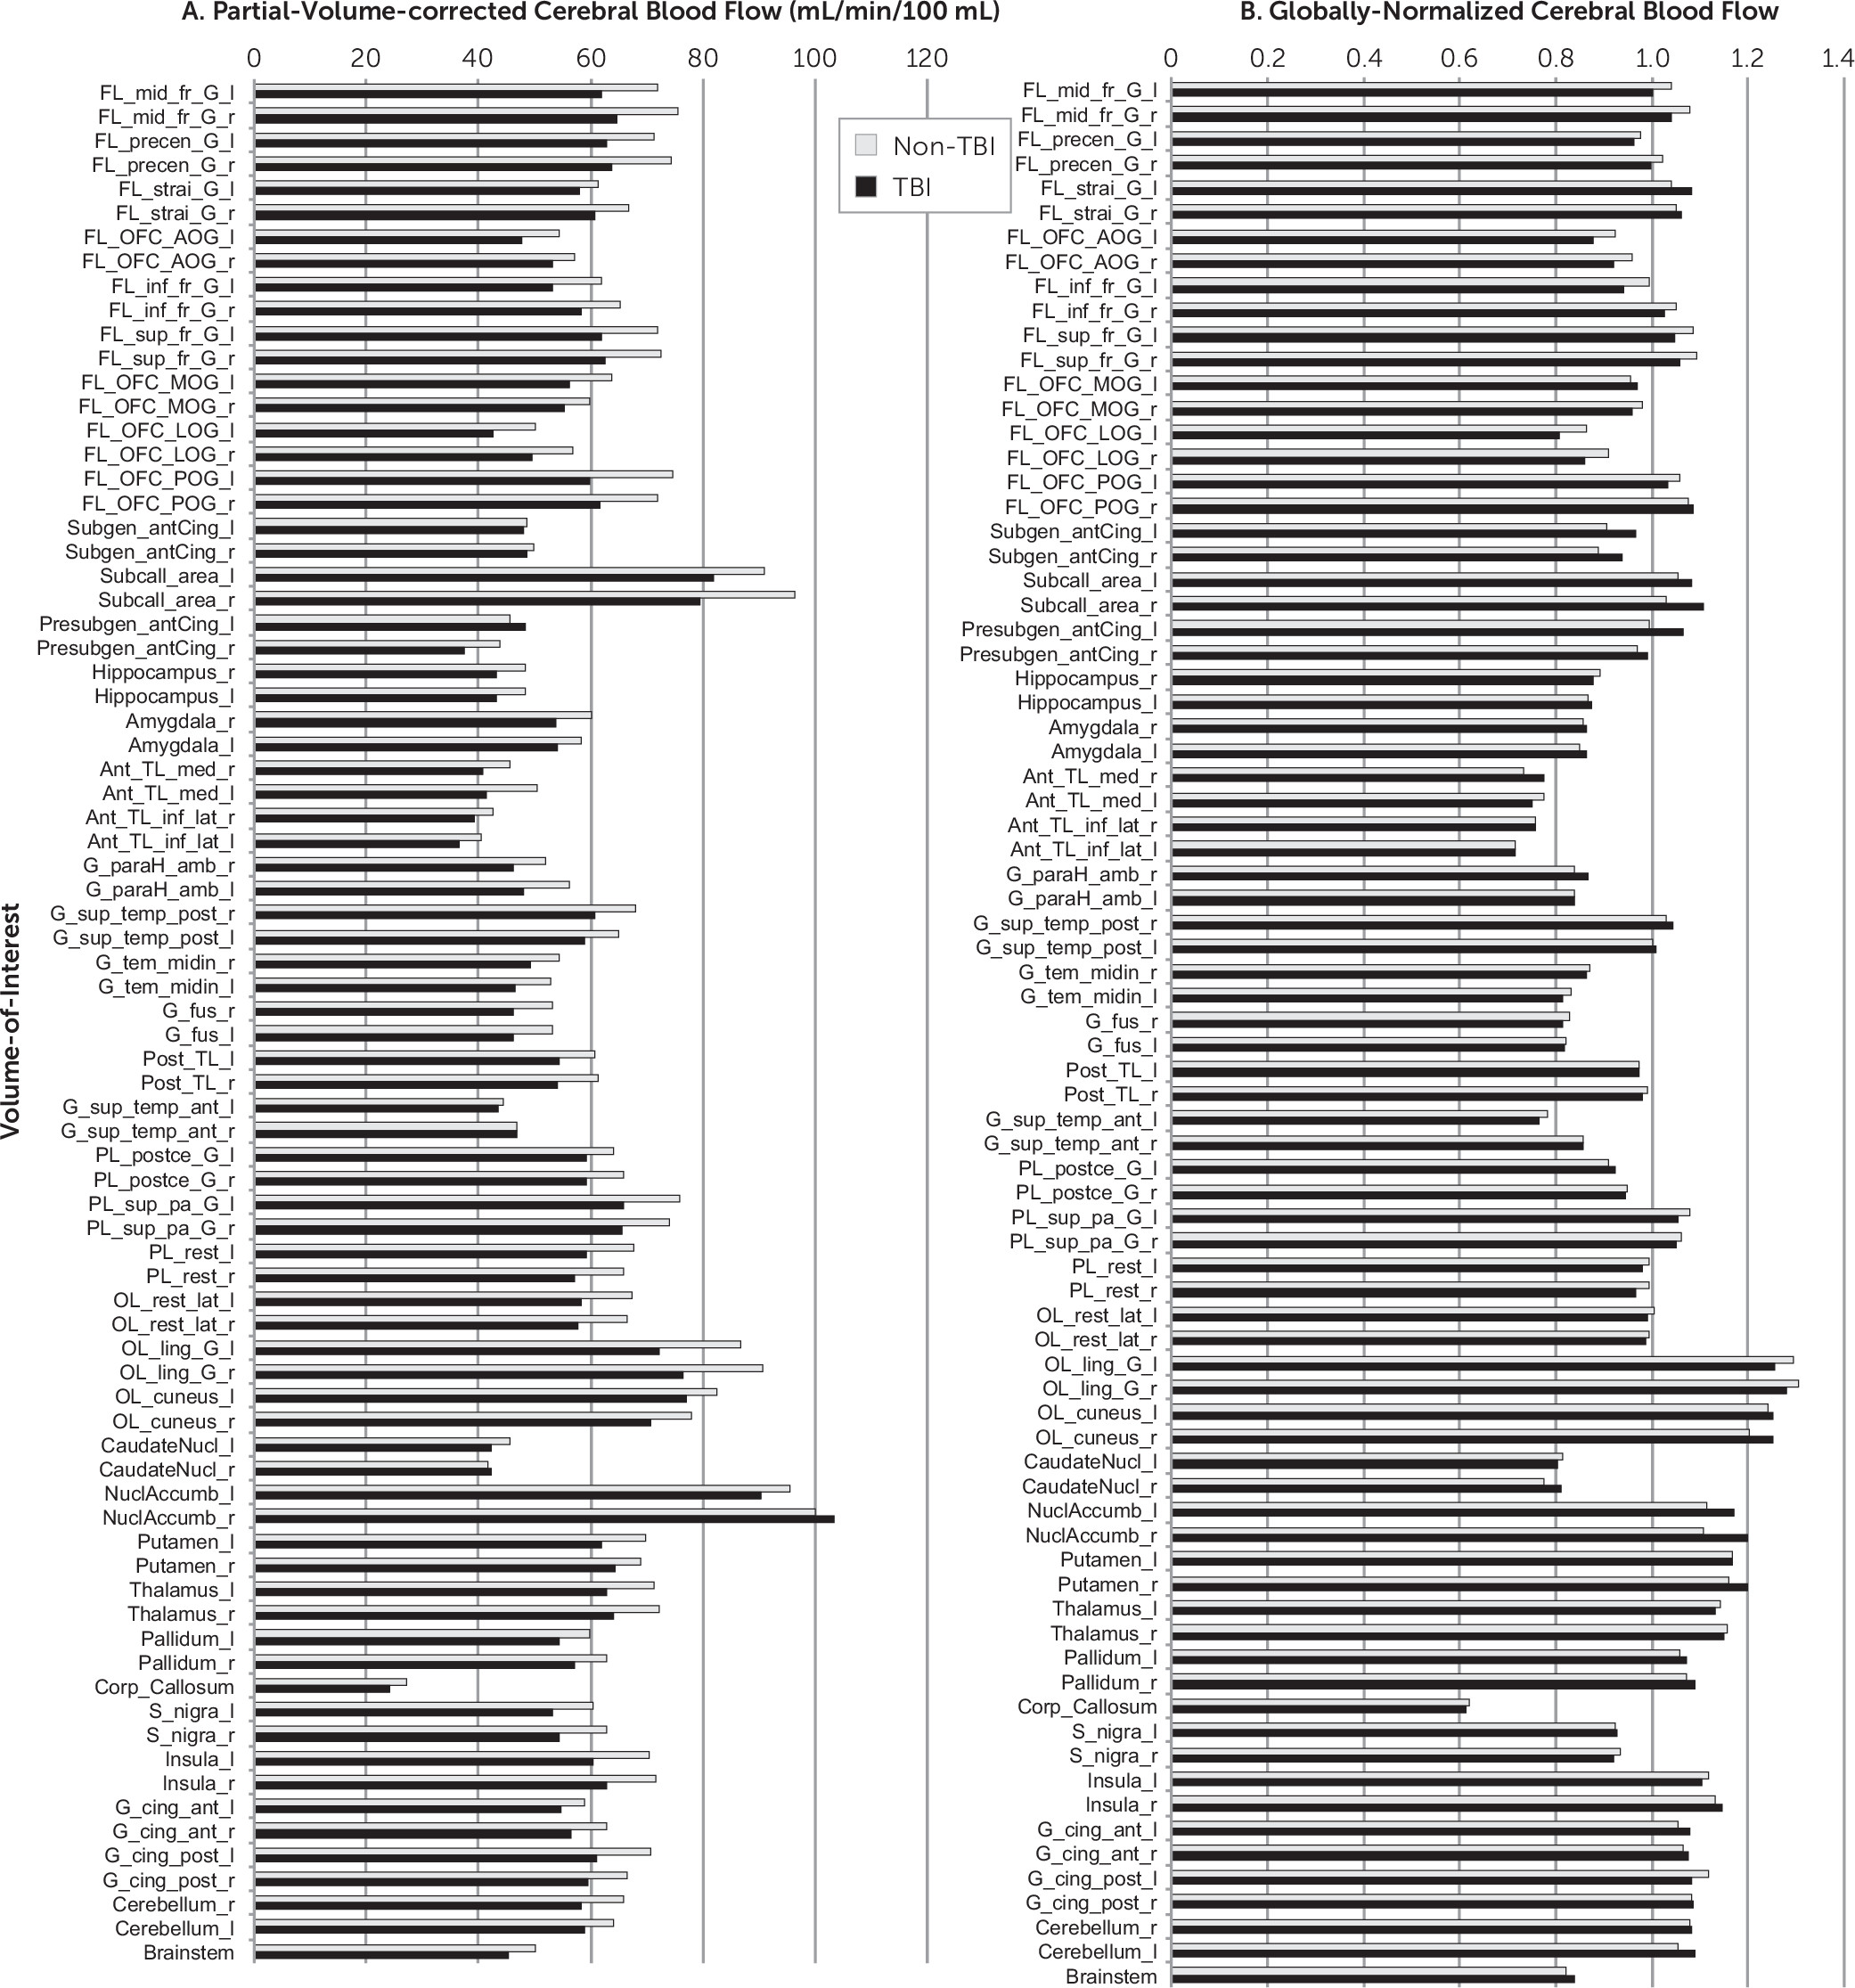
No significant quantitative volumetric differences existed between the TBI and non-TBI groups. Consistent with the findings from the anatomical magnetic resonance images, visual inspection of the [15O]water images did not yield any obvious lesions in any of the subjects. The pattern of blood flow, however, differed in magnitude between the TBI and non-TBI groups across all analyzed regions when the rCBF was expressed in terms of absolute CBF (in milliliters per minute per 100 mL), whether partial volume corrected or not. Specific regions that differed between the TBI and non-TBI groups for both mean rCBF and partial volume–corrected rCBF were the left medial anterior temporal lobe, left superior parietal lobe, bilateral inferolateral parietal lobe, bilateral lateral occipital lobe, and bilateral lingual gyrus. However, although global differences were significant, none of these individual regional differences between the groups was maintained after controlling for the false discovery rate. By contrast, when the rCBF values were globally normalized (relative CBF expressed as a fraction of the global flow), the two groups had essentially an identical distribution of blood flow, except for possible subtle differences in rCBF for specific regions under specific activation conditions. Regional findings related to the response to the specific activations (e.g., watching a combat scenario versus city driving) will be explored in a separate article. See Figure 3 for absolute and relative (i.e., normalized) partial volume–corrected regional values expressed as the mean for non-TBI and TBI subjects, calculated as the average across all injections.
FIGURE 3. Absolute and Globally-Normalized, Partial-Volume-Corrected Cerebral Blood Flow (mL/min/100 mL) for Non-TBI and TBI Subjectsa
a The left panel shows the mean regional partial volume-corrected cerebral blood flow (rCBF) in absolute units (milliliters per minute per 100 mL) across maximum probability regions, defined as described in the text (left indicates left hemisphere, whereas right indicates right hemisphere) for non-TBI subjects (white) and TBI subjects (black). Note the similar pattern but different magnitude across regions with the white bars (non-TBI), which are consistently higher (i.e., higher rCBF) than the black bars (TBI subjects) with only a few exceptions. The right panel shows the normalized regional partial volume-corrected cerebral blood flow (rCBF/gCBF) in relative units across brain regions for non-TBI subjects (white) and TBI subjects (black). Note the similar pattern and essentially identical relative magnitude across regions, with only subtle, nonsignificant differences. Regions are shown in the following respective order: frontal, middle gyrus, left and right; frontal, precentral gyrus, left and right; frontal, straight gyrus, left and right; frontal, anterior orbital gyrus, left and right; frontal, inferior frontal gyrus, left and right; frontal, superior gyrus, left and right; frontal, medial orbital gyrus, left and right; frontal, lateral orbital gyrus, left and right; frontal, posterior orbital gyrus, left and right; anterior cingulate, subgenual, left and right; subcallosal area, left and right; anterior cingulate, presubgenual, left and right; hippocampus, right and left; amygdala, right and left; temporal lobe, anterior, medial, right and left; temporal lobe, anterior, inferior-lateral, right and left; parahippocampal, ambient gyri, right and left; temporal lobe, superior gyrus, posterior, right and left; temporal lobe, middle and inferior gyrus, right and left; fusiform gyrus, right and left; temporal lobe, posterior, left and right; temporal lobe, superior gyrus, anterior, left and right; parietal lobe, postcentral gyrus, left and right; parietal lobe, superior gyrus, left and right; parietal lobe, inferolateral, left and right; occipital lobe, lateral, left and right; occipital lobe, lingual gyrus, left and right; occipital lobe, cuneus, left and right; caudate nucleus, left and right; nucleus accumbens, left and right; putamen, left and right; thalamus, left and right; pallidum, left and right; corpus callosum; substantia nigra, left and right; insula, left and right; anterior cingulate, left and right; posterior cingulate, left and right; cerebellum, right and left; and brainstem. gCBF, global cerebral blood flow; rCBF, regional cerebral blood flow; TBI, traumatic brain injury.

Amyloid Burden

The cortical retention ratios whether determined from the standardized uptake value ratio calculated from 50 to 70 minutes postinjection (non-TBI versus TBI: mean=1.14 [SD=0.05] versus mean=1.12 [SD=0.05], theta=0.64, 95% confidence interval=0.38–0.83, p=0.34) or from the distribution volume ratio (non-TBI versus TBI: mean=1.03 [SD=0.05] versus mean=1.03 [SD=0.06], theta=0.57, 95% confidence interval=0.32–0.78, p=0.65) determined from dynamic data collected from 0 to 90 minutes analyzed by the simplified reference tissue method 2 did not differ significantly between the two groups. None of the subjects were in the pathological range of the cortical retention ratio, with a maximum distribution volume ratio of 1.14 (a TBI subject) and a maximum standardized uptake value ratio of 1.21 (a non-TBI subject). Cerebellar uptake (whole in standardized uptake value units), an important consideration due to the role of the cerebellum as the reference tissue, also did not differ between the groups (mean non-TBI versus TBI=0.62 [SD=0.07] versus 0.56 [SD=0.09], theta=0.68, 95% confidence interval=0.42–0.86, p=0.20). Consistent with the global and cerebellar measures, none of the regions parameterized as distribution volume ratios differed between the groups, except for the left caudate. When regional values were examined in standardized uptake value ratios, values were marginally higher in the left caudate and thalamus. In standardized uptake value units (not normalized by the cerebellar uptake), values were marginally higher in the non-TBI compared with the TBI subjects in the left caudate nucleus, bilateral thalami, left globus pallidus, right anterior cingulate, and corpus callosum. None of these differences were maintained after controlling for the false discovery rate. In addition, the uptake of [11C]PIB into the WM did not differ between the groups or between hemispheres (standardized uptake value ratio for non-TBI versus TBI: WM-left: mean=1.53 [SD=0.17] versus 1.44 [SD=0.19], theta=0.64, 95% confidence interval=0.37–0.83, p=0.34; WM-right: mean=1.55 [SD=0.17] versus 1.44 [SD=0.19], theta=0.61, 95% confidence interval=0.35–0.82, p=0.27).

Discussion

CBF, to the brain tissue as a whole and GM and WM separately, was reduced globally in veterans who had suffered a combat-related TBI, as defined above, compared with veterans who had not experienced a TBI. However, there was no evidence of systematic regional differences between the groups averaged across all injections after accounting for global flow or evidence of systematic volumetric differences. Partial volume correction of the image data did not alter the global or regional results, which indicates that the reduced flow was not explainable simply by alterations in cortical dimensions resulting in enhanced partial volume effects. The finding of a lack of regional differences was in contrast with the results reported by Kim et al.,36 in which relative hypoperfusion was found in the bilateral thalami and bilateral posterior cingulate with relative hyperperfusion in the right temporal gyri and right insula. Technical differences between the studies (specifically, the use of arterial spin labeling versus [15O]water blood flow imaging) and differences between the subject populations (specifically the preponderance of focal lesions in the study by Kim et al.36) may explain these inconsistencies.
The pattern of vascular responsivity observed in the non-TBI subjects (i.e., an increase in gCBF between low-stress conditions [H2O2] and resting [H2O1] and a subsequent decrease in gCBF during the high-stress conditions [H2O3 and H2O4]) is consistent with the inverted “U” response to anxiety that has been reported for CBF and cerebral glucose metabolism.37 However, the gCBF remained essentially unchanged across conditions for the subjects who had experienced a TBI, which suggests possible impaired vascular responsivity. A larger sample of TBI subjects and/or alternative metrics, such as cerebral vascular reserve measures, would be needed to address this pathophysiological question.
Although the small sample size precludes definitive findings, the lack of amyloid burden in this sample of combat-related TBI subjects studied 20–60 months postevent was consistent with the report of Kawai et al.,20 who studied patients with chronic posttraumatic neuropsychological impairment. In this report, nine of 12 [11C]PIB-negative patients had an average binding potential of 0.14 (SD=0.04) (equivalent to distribution volume ratio=1.14) comparable to the binding potential seen in healthy controls (0.11 [SD=0.12]; equivalent to distribution volume ratio=1.11) and to the highest distribution volume ratio in the current sample. Kawai et al.20 concluded that “the absence of Aβ deposition determined by [11C]PIB PET in many long-term survivors with neuropsychological impairment after moderate-to-severe TBI does not support the premise that Aβ pathology progresses over time in the traumatized brain.” Chen et al.38 examined brain tissue at autopsy and found virtually no amyloid plaques (in only one of 18 patients 18–76 years old) in long-term survivors (27 days to 3 years), despite observing plaques in three of five short-term survivors (27–144 hours). The authors hypothesized that the long-term regression of amyloid plaques potentially formed acutely may reflect a change in the balance of amyloid anabolism and catabolism. Although there is human evidence of the formation of amyloid plaques acutely after TBI, these studies have not involved subjects who have experienced blast-related TBI. De Gasperi et al.39 examined the brains of rodents after an experimental blast injury. Rather than acute increases in brain amyloid, decreases in Aβ 40 and Aβ 42 were observed. Therefore, the lack of amyloid burden (whether based on standardized uptake value ratios, distribution volume ratios, or standardized uptake values) in combat-related TBI subjects in our study may be the result of either regression of plaques acutely formed after the traumatic event or, because of the predominance of blast-related TBI, may be attributable to a failure of the blast to elicit increased levels of amyloid. Early and serial imaging of patients with blast-related TBI will be necessary to elucidate the underlying amyloid-related pathologies associated with this type of TBI.
The use of a quantitative rather than a relative approach to the evaluation of CBF was critical to identifying the effects of TBI on CBF. Imaging analysis techniques that use global normalization may mask pathology that is broadly distributed across the brain. The global impairment in magnitude and, possibly, variability of blood flow with TBI observed is consistent with the hypothesized effects of a blast wave and/or acceleration/deceleration and rotational forces that damage tissues and vasculature throughout the entire brain. Whether the observed globally reduced flow was the result of vascular pathology that reduced the supply of blood to the tissues, tissue damage that reduced the demand for blood, or a combination of both processes cannot be discerned. However, there is evidence of significant long-term functional sequelae of the combat-associated neurotrauma that appears to be independent of amyloid-related pathology. The enhanced risk for the development of dementia in patients with a history of TBI may potentially be mediated by changes in CBF or tau, rather than early amyloid deposition. However, verification of this possible theory would require the study of a larger group of combat TBI subjects at multiple time points and, ideally, in conjunction with both serial amyloid and tau imaging.

Conclusions

Chronic TBI in these subjects (3–8 years after injury) is a global phenomenon manifested by alterations in gCBF. Veterans who have suffered a TBI have significantly lower CBF than non-TBI controls without increased amyloid levels. This finding is consistent with global vascular damage (reduced supply) or global reduction in metabolism (reduced demand) secondary to the TBI.

Acknowledgments

The authors acknowledge the efforts of the research staff (Stephanie Rosazza and Kyla Kennedy), the PET Center staff (John Richmond, Dean Clermont, Julie Riggert, Christine Mundt, Kelli Schlarbaum, Garrett Stratton, Kathy Thede-Reynolds, Lea Weldon, and Lauren Woiwode), and the veterans who were willing to give their time for making this research a reality.

References

1.
Warden D: Military TBI during the Iraq and Afghanistan wars. J Head Trauma Rehabil 2006; 21:398–402
2.
Cernak I, Noble-Haeusslein LJ: Traumatic brain injury: an overview of pathobiology with emphasis on military populations. J Cereb Blood Flow Metab 2010; 30:255–266
3.
DeWitt DS, Prough DS: Blast-induced brain injury and posttraumatic hypotension and hypoxemia. J Neurotrauma 2009; 26:877–887
4.
Duckworth JL, Grimes J, Ling GS: Pathophysiology of battlefield associated traumatic brain injury. Pathophysiology 2013; 20:23–30
5.
Chen Y, Huang W: Non-impact, blast-induced mild TBI and PTSD: concepts and caveats. Brain Inj 2011; 25:641–650
6.
Alford PW, Dabiri BE, Goss JA, et al: Blast-induced phenotypic switching in cerebral vasospasm. Proc Natl Acad Sci USA 2011; 108:12705–12710
7.
Goldstein LE, Fisher AM, Tagge CA, et al: Chronic traumatic encephalopathy in blast-exposed military veterans and a blast neurotrauma mouse model. Sci Transl Med 2012; 4:134ra60
8.
Readnower RD, Chavko M, Adeeb S, et al: Increase in blood-brain barrier permeability, oxidative stress, and activated microglia in a rat model of blast-induced traumatic brain injury. J Neurosci Res 2010; 88:3530–3539
9.
Garman RH, Jenkins LW, Switzer RC 3rd, et al: Blast exposure in rats with body shielding is characterized primarily by diffuse axonal injury. J Neurotrauma 2011; 28:947–959
10.
Cernak I, Merkle AC, Koliatsos VE, et al: The pathobiology of blast injuries and blast-induced neurotrauma as identified using a new experimental model of injury in mice. Neurobiol Dis 2011; 41:538–551
11.
Omalu B, Hammers JL, Bailes J, et al: Chronic traumatic encephalopathy in an Iraqi war veteran with posttraumatic stress disorder who committed suicide. Neurosurg Focus 2011; 31:E3
12.
Peskind ER, Petrie EC, Cross DJ, et al: Cerebrocerebellar hypometabolism associated with repetitive blast exposure mild traumatic brain injury in 12 Iraq war Veterans with persistent post-concussive symptoms. NeuroImage 2011; 54(suppl 1):S76–S82
13.
Lye TC, Shores EA: Traumatic brain injury as a risk factor for Alzheimer’s disease: a review. Neuropsychol Rev 2000; 10:115–129
14.
Shively S, Scher AI, Perl DP, et al: Dementia resulting from traumatic brain injury: what is the pathology? Arch Neurol 2012; 69:1245–1251
15.
Roberts GW, Gentleman SM, Lynch A, et al: β A4 amyloid protein deposition in brain after head trauma. Lancet 1991; 338:1422–1423
16.
Roberts GW, Gentleman SM, Lynch A, et al: β amyloid protein deposition in the brain after severe head injury: implications for the pathogenesis of Alzheimer’s disease. J Neurol Neurosurg Psychiatry 1994; 57:419–425
17.
Johnson VE, Stewart W, Smith DH: Traumatic brain injury and amyloid-β pathology: a link to Alzheimer’s disease? Nat Rev Neurosci 2010; 11:361–370
18.
Mannix RC, Whalen MJ: Traumatic brain injury, microglia, and beta amyloid. Int J Alzheimers Dis 2012; 2012;2012:608732
19.
Hong YT, Veenith T, Dewar D, et al: Amyloid imaging with carbon 11-labeled Pittsburgh compound B for traumatic brain injury. JAMA Neurol 2014; 71:23–31
20.
Kawai N, Kawanishi M, Kudomi N, et al: Detection of brain amyloid β deposition in patients with neuropsychological impairment after traumatic brain injury: PET evaluation using Pittsburgh Compound-B. Brain Inj 2013; 27:1026–1031
21.
Golding EM: Sequelae following traumatic brain injury. The cerebrovascular perspective. Brain Res Brain Res Rev 2002; 38:377–388
22.
Department of Veterans Affairs, Department of Defense: Clinical Practice Guideline: Management of Concussion/Mild Traumatic Brain Injury. Washington, DC, Department of Veterans Affairs, Department of Defense, 2009
23.
Blake DD, Weathers FW, Nagy LM, et al: The development of a Clinician-Administered PTSD Scale. J Trauma Stress 1995; 8:75–90
24.
Hamilton M: The assessment of anxiety states by rating. Br J Med Psychol 1959; 32:50–55
25.
Babor TF, Higgins-Biddle JC, Saunders JB, et al: AUDIT: The Alcohol Use Disorders Identification Test: Guidelines for Use in Primary Care, 2nd ed. Geneva, Switzerland, World Health Organization, 2001
26.
Hichwa RD, Ponto LLB, Watkins GL: Clinical blood flow measurements with [15O]water and positron emission tomography, in Chemists’ Views of Imaging Centers. Edited by Emran AM. New York, Plenum Press, 1995, pp 401–417
27.
Wollenweber SD, Hichwa RD, Ponto LLB: A simple on-line arterial time-activity curve detector for [O-15] water PET studies. IEEE Trans Nucl Sci 1997; 44:1613–1617
28.
Magnotta VA, Harris G, Andreasen NC, et al: Structural MR image processing using the BRAINS2 toolbox. Comput Med Imaging Graph 2002; 26:251–264
29.
Hammers A, Allom R, Koepp MJ, et al: Three-dimensional maximum probability atlas of the human brain, with particular reference to the temporal lobe. Hum Brain Mapp 2003; 19:224–247
30.
Rousset OG, Ma Y, Evans AC: Correction for partial volume effects in PET: principle and validation. J Nucl Med 1998; 39:904–911
31.
Price JC, Klunk WE, Lopresti BJ, et al: Kinetic modeling of amyloid binding in humans using PET imaging and Pittsburgh Compound-B. J Cereb Blood Flow Metab 2005; 25:1528–1547
32.
Lopresti BJ, Klunk WE, Mathis CA, et al: Simplified quantification of Pittsburgh Compound B amyloid imaging PET studies: a comparative analysis. J Nucl Med 2005; 46:1959–1972
33.
Newcombe RG: Confidence intervals for an effect size measure based on the Mann-Whitney statistic. Part 1: general issues and tail-area-based methods. Stat Med 2006; 25:543–557
34.
Newcombe RG: Confidence intervals for an effect size measure based on the Mann-Whitney statistic. Part 2: asymptotic methods and evaluation. Stat Med 2006; 25:559–573
35.
Benjamini Y, Hochberg Y: Controlling the false discovery rate: a practical and powerful approach to multiple testing. J R Stat Soc B 1995; 57:289–300
36.
Kim J, Whyte J, Patel S, et al: Resting cerebral blood flow alterations in chronic traumatic brain injury: an arterial spin labeling perfusion FMRI study. J Neurotrauma 2010; 27:1399–1411
37.
Gur RC, Gur RE, Resnick SM, et al: The effect of anxiety on cortical cerebral blood flow and metabolism. J Cereb Blood Flow Metab 1987; 7:173–177
38.
Chen XH, Johnson VE, Uryu K, et al: A lack of amyloid β plaques despite persistent accumulation of amyloid β in axons of long-term survivors of traumatic brain injury. Brain Pathol 2009; 19:214–223
39.
De Gasperi R, Gama Sosa MA, Kim SH, et al: Acute blast injury reduces brain abeta in two rodent species. Front Neurol 2012; 3:177

Information & Authors

Information

Published In

Go to The Journal of Neuropsychiatry and Clinical Neurosciences
The Journal of Neuropsychiatry and Clinical Neurosciences
Pages: 89 - 96
PubMed: 26548655

History

Received: 8 May 2015
Revision received: 22 July 2015
Accepted: 31 July 2015
Published online: 9 November 2015
Published in print: Spring 2016

Authors

Details

Laura L. Boles Ponto, Ph.D.
From the Depts. of Radiology (LLBP, YM, GLW, JJS) and Psychiatry (TMB-K, JAK), Roy J. and Lucille A. Carver College of Medicine, and the Dept. of Biostatistics, College of Public Health (LA), University of Iowa, Iowa City, IA; the Iowa City Veterans Administration Medical Center (TMB-K), Iowa City, IA; Brain Image Analysis, LLC, Iowa City, IA (RKP); the Iowa Consortium for Substance Abuse Research and Evaluation, Iowa City, IA (LA); and the Michael E. DeBakey Veterans Affairs Medical Center, Houston, TX (REJ).
Thomas M. Brashers-Krug, M.D., Ph.D.
From the Depts. of Radiology (LLBP, YM, GLW, JJS) and Psychiatry (TMB-K, JAK), Roy J. and Lucille A. Carver College of Medicine, and the Dept. of Biostatistics, College of Public Health (LA), University of Iowa, Iowa City, IA; the Iowa City Veterans Administration Medical Center (TMB-K), Iowa City, IA; Brain Image Analysis, LLC, Iowa City, IA (RKP); the Iowa Consortium for Substance Abuse Research and Evaluation, Iowa City, IA (LA); and the Michael E. DeBakey Veterans Affairs Medical Center, Houston, TX (REJ).
Ronald K. Pierson, M.S.
From the Depts. of Radiology (LLBP, YM, GLW, JJS) and Psychiatry (TMB-K, JAK), Roy J. and Lucille A. Carver College of Medicine, and the Dept. of Biostatistics, College of Public Health (LA), University of Iowa, Iowa City, IA; the Iowa City Veterans Administration Medical Center (TMB-K), Iowa City, IA; Brain Image Analysis, LLC, Iowa City, IA (RKP); the Iowa Consortium for Substance Abuse Research and Evaluation, Iowa City, IA (LA); and the Michael E. DeBakey Veterans Affairs Medical Center, Houston, TX (REJ).
Yusuf Menda, M.D.
From the Depts. of Radiology (LLBP, YM, GLW, JJS) and Psychiatry (TMB-K, JAK), Roy J. and Lucille A. Carver College of Medicine, and the Dept. of Biostatistics, College of Public Health (LA), University of Iowa, Iowa City, IA; the Iowa City Veterans Administration Medical Center (TMB-K), Iowa City, IA; Brain Image Analysis, LLC, Iowa City, IA (RKP); the Iowa Consortium for Substance Abuse Research and Evaluation, Iowa City, IA (LA); and the Michael E. DeBakey Veterans Affairs Medical Center, Houston, TX (REJ).
Laura Acion, Ph.D., M.P.H.
From the Depts. of Radiology (LLBP, YM, GLW, JJS) and Psychiatry (TMB-K, JAK), Roy J. and Lucille A. Carver College of Medicine, and the Dept. of Biostatistics, College of Public Health (LA), University of Iowa, Iowa City, IA; the Iowa City Veterans Administration Medical Center (TMB-K), Iowa City, IA; Brain Image Analysis, LLC, Iowa City, IA (RKP); the Iowa Consortium for Substance Abuse Research and Evaluation, Iowa City, IA (LA); and the Michael E. DeBakey Veterans Affairs Medical Center, Houston, TX (REJ).
G. Leonard Watkins, Ph.D.
From the Depts. of Radiology (LLBP, YM, GLW, JJS) and Psychiatry (TMB-K, JAK), Roy J. and Lucille A. Carver College of Medicine, and the Dept. of Biostatistics, College of Public Health (LA), University of Iowa, Iowa City, IA; the Iowa City Veterans Administration Medical Center (TMB-K), Iowa City, IA; Brain Image Analysis, LLC, Iowa City, IA (RKP); the Iowa Consortium for Substance Abuse Research and Evaluation, Iowa City, IA (LA); and the Michael E. DeBakey Veterans Affairs Medical Center, Houston, TX (REJ).
John J. Sunderland, Ph.D.
From the Depts. of Radiology (LLBP, YM, GLW, JJS) and Psychiatry (TMB-K, JAK), Roy J. and Lucille A. Carver College of Medicine, and the Dept. of Biostatistics, College of Public Health (LA), University of Iowa, Iowa City, IA; the Iowa City Veterans Administration Medical Center (TMB-K), Iowa City, IA; Brain Image Analysis, LLC, Iowa City, IA (RKP); the Iowa Consortium for Substance Abuse Research and Evaluation, Iowa City, IA (LA); and the Michael E. DeBakey Veterans Affairs Medical Center, Houston, TX (REJ).
Julie A. Koeppel, B.S.
From the Depts. of Radiology (LLBP, YM, GLW, JJS) and Psychiatry (TMB-K, JAK), Roy J. and Lucille A. Carver College of Medicine, and the Dept. of Biostatistics, College of Public Health (LA), University of Iowa, Iowa City, IA; the Iowa City Veterans Administration Medical Center (TMB-K), Iowa City, IA; Brain Image Analysis, LLC, Iowa City, IA (RKP); the Iowa Consortium for Substance Abuse Research and Evaluation, Iowa City, IA (LA); and the Michael E. DeBakey Veterans Affairs Medical Center, Houston, TX (REJ).
Ricardo E. Jorge, M.D.
From the Depts. of Radiology (LLBP, YM, GLW, JJS) and Psychiatry (TMB-K, JAK), Roy J. and Lucille A. Carver College of Medicine, and the Dept. of Biostatistics, College of Public Health (LA), University of Iowa, Iowa City, IA; the Iowa City Veterans Administration Medical Center (TMB-K), Iowa City, IA; Brain Image Analysis, LLC, Iowa City, IA (RKP); the Iowa Consortium for Substance Abuse Research and Evaluation, Iowa City, IA (LA); and the Michael E. DeBakey Veterans Affairs Medical Center, Houston, TX (REJ).

Notes

Send correspondence to Dr. Ponto; e-mail: [email protected]
This work was presented in part as a poster at the Annual Meeting of the Society of Nuclear Medicine, Miami, June 9–13, 2012.

Competing Interests

The authors report no competing interests.

Funding Information

U.S. Department of Veterans Affairs10.13039/100000738: RR&D Merit Award D7201I
This work was funded in part by Veterans Administration RR&D Merit Award D7201I to Dr. Jorge.

Metrics & Citations

Metrics

Citations

Export Citations

If you have the appropriate software installed, you can download article citation data to the citation manager of your choice. Simply select your manager software from the list below and click Download.

For more information or tips please see 'Downloading to a citation manager' in the Help menu.

Format
Citation style
Style
Copy to clipboard

View Options

View options

PDF/EPUB

View PDF/EPUB

Login options

Already a subscriber? Access your subscription through your login credentials or your institution for full access to this article.

Personal login Institutional Login Open Athens login
Purchase Options

Purchase this article to access the full text.

PPV Articles - Journal of Neuropsychiatry and Clinical Neurosciences

PPV Articles - Journal of Neuropsychiatry and Clinical Neurosciences

Not a subscriber?

Subscribe Now / Learn More

PsychiatryOnline subscription options offer access to the DSM-5-TR® library, books, journals, CME, and patient resources. This all-in-one virtual library provides psychiatrists and mental health professionals with key resources for diagnosis, treatment, research, and professional development.

Need more help? PsychiatryOnline Customer Service may be reached by emailing [email protected] or by calling 800-368-5777 (in the U.S.) or 703-907-7322 (outside the U.S.).
Media

Figures

Other

Tables

Share

Share

Share article link

Share