Abstract

Objective:

Subtle and gradual changes occur in the brain years before cognitive impairment due to age-related neurodegenerative disorders. The authors examined the utility of hippocampal texture analysis and volumetric features extracted from brain magnetic resonance (MR) data to differentiate between three cognitive groups (cognitively normal individuals, individuals with mild cognitive impairment, and individuals with Alzheimer’s disease) and neuropsychological scores on the Clinical Dementia Rating (CDR) scale.

Methods:

Data from 173 unique patients with 3-T T1-weighted MR images from the Alzheimer’s Disease Neuroimaging Initiative database were analyzed. A variety of texture and volumetric features were extracted from bilateral hippocampal regions and were used to perform binary classification of cognitive groups and CDR scores. The authors used diagonal quadratic discriminant analysis in a leave-one-out cross-validation scheme. Sensitivity, specificity, and area under the receiver operating characteristic curve were used to assess the performance of models.

Results:

The results show promise for hippocampal texture analysis to distinguish between no impairment and early stages of impairment. Volumetric features were more successful at differentiating between no impairment and advanced stages of impairment.

Conclusions:

MR radiomics may be a promising tool to classify various cognitive groups.
The global dementia epidemic carries a widespread emotional and financial burden on patient families, caregivers, and society (1). Currently, dementia of the Alzheimer’s type is the sixth leading cause of death in the United States, yet it is the only disease among the top 10 causes of death that cannot be prevented or cured (2). To date, clinical trials for Alzheimer’s disease therapeutics have been universally disappointing.
One significant factor for the slow progress is the lack of powerful early detection methods of cognitive impairment. Alzheimer’s disease is characterized by the deposition of beta amyloid (Aβ) and hyperphosphorylated tau, resulting in plaques and neurofibrillary tangles, respectively. One hypothetical biomarker model describes the temporal order of disease stages as follows: Aβ plaque accumulation; neuronal injury; brain structure atrophy; memory loss; and general cognitive decline (3). Clinical trials may fail because these neuropathological changes precede cognitive deficit manifestations by several decades (48). Consequently, irreversible brain damage may have already occurred. Thus, identifying quantifiable biomarkers for early cognitive impairment is of profound public health importance. Early detection may allow earlier pharmacological interventions when patients may be more responsive to treatments. In addition, early detection would allow patients to make conscious decisions about their situation (personal and property) if their underlying diseases lead to progression to dementia. However, as of now, early detection of cognitive impairment is challenging.
Multiple studies have used structural magnetic resonance (MR) imaging to predict Alzheimer’s disease (913). Several studies found that local hippocampal and total brain volume are significantly reduced in Alzheimer’s disease and mild cognitive impairment compared with healthy elderly individuals (1423). The hippocampus is affected early, and generally severely, in the Alzheimer’s disease pathological process (24). Hippocampal volume is the most studied structural biomarker of Alzheimer’s disease and is used in the criteria for its diagnosis (25). In addition, prediction of conversion from mild cognitive impairment to Alzheimer’s disease has been correlated with the rate and amount of hippocampal, medial temporal lobe, and total brain atrophy (2631).
Biomedical texture analysis aims to quantitatively describe pixel/voxel intensity distributions and the interrelations of pixel intensities across multiple spatial scales. Texture analysis has been used previously in the context of Alzheimer’s disease (14, 28, 3235). Radiomics is an emerging approach to image analysis and refers to high-throughput extraction of quantitative features from radiological images in order to convert images into structured and mineable data (3638). Radiomics pipelines often employ a variety of texture analysis methods to provide a holistic representation of texture-based information of the image or regions of interest in the image. Radiomics-based models have revealed predictive and prognostic associations between images and clinical outcomes (3638). These models offer the potential of capturing often overlooked or hidden information on underlying disease dynamics. Our group has developed a radiomics texture analysis platform that has been used to characterize gene expression patterns of brain cancer (39, 40), to aid in the diagnosis of head and neck cancers (41, 42) and breast cancer (43).
The aim of the present study was to differentiate between three cognitive groups (cognitively normal individuals, individuals with mild cognitive impairment, and individuals with Alzheimer’s disease) and scores on the Clinical Dementia Rating (CDR) scale using MRI-based texture and volume measurements from the hippocampus. We hypothesize that changes in neuropsychological function related to cognitive impairment have a radiological counterpart, detectable via structural MRI. We also hypothesize that texture analysis will be sensitive enough to identify early MRI structural hippocampal changes related to the early Alzheimer’s disease pathophysiologic process, which will be correlated with cognitive groups and CDR scores. Specifically, our objectives are twofold: to use MR radiomics features to differentiate between cognitive groups (cognitively normal, mild cognitive impairment, Alzheimer’s disease) and to predict neuropsychological performance, quantified via CDR scores. The contributions of this study are: identification of MR-derived features that could be used in detecting early cognitive impairment; assessing the use of a granular measure of cognition assessment (such as CDR scores) compared with generic grouping for predictive modeling; and comparing the utilities of volume and texture features in this task.

Methods

ADNI Data Set

Data used in the preparation of this article were obtained from the Alzheimer’s Disease Neuroimaging Initiative (ADNI) database (adni.loni.usc.edu). The ADNI was launched in 2003 as a public–private partnership with the primary goal of testing whether serial MRI, positron emission tomography (PET), other biological markers, and clinical and neuropsychological assessment can be combined to measure the progression of mild cognitive impairment and early Alzheimer’s disease. We selected cases from the shared image collection ADNI-1, a 5-year study with a cohort of 200 cognitively normal individuals, 200 individuals with mild cognitive impairment, and 400 individuals with Alzheimer’s disease (44). The participants were divided into the assigned cognitively normal, mild cognitive impairment, and Alzheimer’s disease groups and underwent 3-T imaging at the following time points: baseline, 6, 12, 18 (mild cognitive impairment only), and 24 months. We categorized participants into three cognitive groups as assigned by ADNI-1: cognitively normal, mild cognitive impairment, and Alzheimer’s disease. Group specific inclusion criteria are available on ADNI’s website under the General Procedures Manual or under Study Design, Background and Rationale (45, 46). Briefly, cognitively normal participants have Mini-Mental State Exam (MMSE) scores between 24 and 30 (inclusive) and a CDR of 0, and are non-depressed, without mild cognitive impairment, and non-demented (45). Participants with mild cognitive impairment have MMSE scores between 24 and 30 (inclusive), a memory complaint, objective memory loss measured by education-adjusted scores on Wechsler Memory Scale Logical Memory II, a CDR of 0.5, absence of significant levels of impairment in other cognitive domains, essentially persevered activities of daily living, and an absence of dementia (45). Alzheimer’s disease participants have MMSE scores between 20 and 26 (inclusive), CDR of 0.5–2, abnormal memory function documented by scoring below the education-adjusted cutoff on the Logical Memory II subscale (Delayed Paragraph Recall) from the Wechsler Memory Scale, and meet the NINCDS/ADRDA criteria for probable Alzheimer’s disease (45).

Cognitive Measures

The CDR score is obtained through semi-structured interviews with patients and informants to evaluate six domains: memory, orientation, judgment and problem solving, community affairs, home and hobbies, and personal care (47). Patients are then classified on the following ordinal scales: 0 (no impairment), 0.5 (questionable impairment), 1 (mild dementia), 2 (moderate dementia), or 3 (severe dementia). Typically, a score of 0.5 is given to individuals with a diagnosis of mild cognitive impairment (48, 49).

Study Participants

The initial participant selection criteria were as follows: available CDR score associated with the time of image acquisition and available 3-T T1 scanning protocol to ensure maximum resolution for the image analysis.
We found 204 unique participants in ADNI-1 with available 3-T T1 MR images. Image data were available for all participants at different time points ranging from baseline to month 24. Because we were interested in predicting static cognition levels (CDR scores, cognitive groups), the time point was irrelevant. We selected one time point per participant to ensure unique participants across groups. To maximize group sizes, we first selected participants with a CDR score of 2, who were in the minority. These participants were excluded from all the other groups. Next, participants with CDR scores of 1 and 0.5 were selected. All the remaining participants not assigned to any groups were placed in the CDR 0 group. Individuals with a CDR score of 3 were excluded due to our small sample size. Then, we proceeded to find the 3-T MR scan time points associated with the assigned group labels for participants. The image data acquired at the selected time points were used for analysis. Thirty-one participants in total were excluded. The exclusions were due either to a mismatch between imaging and CDR score acquisition date (N=21) or image unavailability (N=10). This led to a final sample size of 173 individuals: with 67 classified as non-impaired (CDR 0), 48 with questionable cognitive impairment (CDR 0.5), 39 with mild cognitive impairment (CDR 1), and 19 with moderate cognitive impairment (CDR 2).
Demographic and clinical characteristics of the included study participants are presented in Table 1 and Table 2. It is noteworthy that to receive a diagnosis of mild cognitive impairment or Alzheimer’s disease, in addition to clinician judgment, intra-individual decline must be obtained with serial cognitive measurements (multiple CDR scores over time) or by a history of change from previously attained levels (50). Thus, the numbers of participants between cognitive grouping and CDR scores differs.
TABLE 1. Demographic and clinical characteristics of the cognitive groupsa
CharacteristicCognitively normal (N=62)Mild cognitive impairment (N=70)Alzheimer’s disease (N=41)
 MeanSDMeanSDMeanSD
Age (years)75.24.776.08.476.18.7
 N%N%N%
Sex, male2641.94361.4b1639.0
a
Percent indicates percentage of the specific group.
b
A significantly higher proportion of males were in the mild cognitive impairment group (Pearson’s χ2=5.2120, df=2, p=0.02).
TABLE 2. Demographic and clinical characteristics by Clinical Dementia Rating (CDR) scale scoresa
CharacteristicCDR 0 (N=67)CDR 0.5 (N=48)CDR 1 (N=39)CDR 2 (N=19)
 MeanSDMeanSDMeanSDMeanSD
Age (years)74.95.375.87.374.38.981.37.6b
 N%N%N%N%
Sex, male2943.32552.12256.4947.4
a
Participants with a CDR score of 0 were classified as having no impairment, those with a score of 0.5 were classified as having questionable cognitive impairment or mild cognitive impairment, those with a score of 1were classified as having mild dementia or impairment, and those with a score of 2were classified as having moderate dementia or impairment. Percent indicates percentage of the specific group.
b
A significantly higher age (years) was observed in the CDR 2 group (p<0.0001, Student’s t-test).

Image Preprocessing

MR images can have large intensity variations when acquired from different scanners or under different acquisition parameters. ADNI performs several preprocessing steps on magnetization-prepared rapid gradient-echo (MP-RAGE) sequence images. This includes gradwarp geometry distortion correction and B1 and N3 intensity non-uniformity corrections (51) to ensure comparability of images across devices and protocols. To ascertain the comparability of images across patients, we normalized all images to have a common mean and variance in CSF (52). Texture and volume analyses were performed using the normalized images.

Texture Analysis

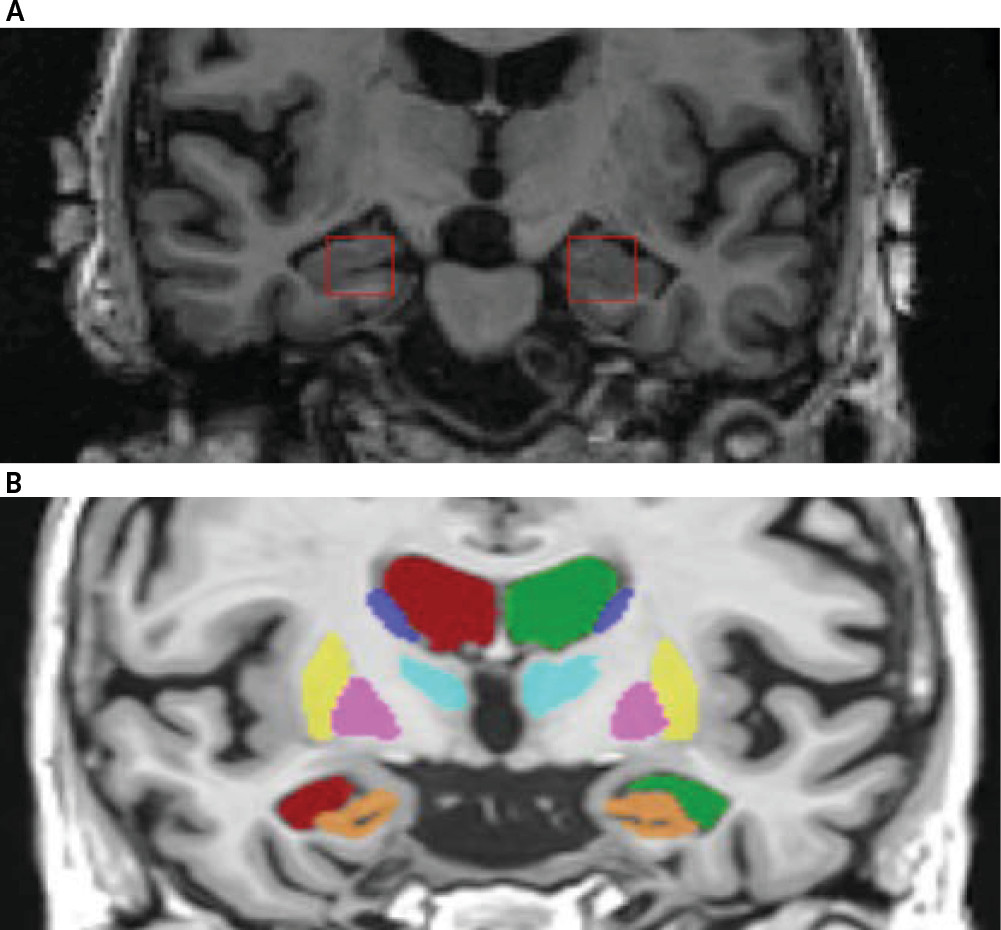
The imaging data were imported into the MIPAV (Medical Image Processing, Analysis, and Visualization) application version 7.2.0 (53). To avoid resampling the images, we limited the segmentation of the hippocampus to the coronal view since it provided a common pixel spacing of (1.02, 1.02) mm across all patients. Experts identified three slices with the largest possible view of the bilateral hippocampi and manually placed rectangular regions of interest (ROIs) (16×16 pixels) on the area of the hippocampi, while avoiding inclusion of areas outside the hippocampus (Figure 1A) as much as possible. This segmentation process resulted in six ROIs (3 slices×2 hippocampi) per patient. This segmentation is considered greater than two dimensional and less than three dimensional (often referred to as 2.5D), and it improves the reliability of the sampling process. The ROIs were cropped out of the images and set aside for texture analysis. The individuals who manually placed ROIs on the hippocampi were blinded to the diagnosis; another blinded individual performed quality control checks to ensure ROIs were centrally placed.
FIGURE 1. Segmentation of the hippocampus in texture and volume analysisa
a Panel A shows the texture analysis regions of interest (ROIs): the left and right hippocampal areas were manually marked using 16×16 pixel squares (red); this process was repeated on three coronal slices with the largest cross-sectional view of the hippocampus area. Panel B shows the volume analysis ROI: volBrain pipeline segments of subcortical brain tissues and volumetric measurements; the image shows overlay of volBrain segmentation results; hippocampal areas, the region of interest, are also shown (orange).
Next, we acquired mean, standard deviation, and range of voxel intensities across the ROIs. (subsequently referred to as raw intensity features). We then mapped the dynamic ranges of intensities inside the ROIs to 0–255 as a preprocessing step for characterization of texture. Several statistical and spectral texture analysis methods are included in our radiomics pipeline. Textural features describing patterns or spatial distribution of voxel intensities were calculated from second-order statistical gray level co-occurrence matrices (GLCM) (54), Laplacian of Gaussian Histogram (LoGHist) (55), rotationally invariant Discrete Orthonormal Stockwell Transform (DOST) (56), Gabor filter banks (GFB) (57), and local binary patterns (LBP) (58). These methods were implemented in Python programming language using custom-written code and open-source libraries (59, 60). In total, we extracted 119 features per ROI: three raw intensity, 26 GLCM, 10 DOST, 36 LoGHist, 12 LBP, and 32 GFB features. Extensive details on these features can be found in Ranjbar et al., Patel et al., and Ramkumar et al. (42, 43, 61) To account for sampling variability, we averaged the features over slice without losing the laterality information, leading to a total of 238 texture features (119 per hippocampus) per patient.

Volumetric Features

We used the volbrain system for computation of hippocampal volumetric measurements. Given a stack of MR images, volBrain (62, 63) automatically segments parenchyma, brain tissues, macrostructure and subcortical structures (shown in Figure 1B) and reports volumetric measurements of the structures. For this study, we used two volumetric features for the hippocampus area including relative volume (%) and asymmetry index (%). Relative volume represents the sum of the hippocampi volumes in relation to the volume of the intracranial cavity. The asymmetry index is the difference between right and left volumes divided by their mean.

Statistical Analysis and Machine Learning

Age and sex differences between groups were tested using Student’s t-test and Pearson’s chi-square test, respectively. Statistical significance was defined as a p value <0.05. We performed univariate analysis to compare the difference in texture and volume feature values for both CDR groups and cognitive groups. The p values were adjusted for multiple comparisons using the Benjamini and Hochberg false discovery rate method (64).
We applied principal component analysis (PCA) to reduce dimensionality of texture features (65). To maintain interpretability of the principal components, PCA was applied to features stemming from a common texture analysis method. Several comparative datasets were generated with PCA to find the optimal level of variance. The final set of PCs represented 90% of the variance in the original features. Texture PCs combined with volume features were used in supervised classification of two label variables: cognitive groups (cognitively normal, mild cognitive impairment, Alzheimer’s disease) and CDR scores.
Machine learning was conducted using the open-source Python-based package scikit-learn (66) and custom-written scripts. We used a leave-one-out cross-validation (LOOCV) scheme to predict the labels (65) and to select features for training. LOOCV iteratively uses all samples except one for model training. In each round, the left-out sample serves as the test case to assess the generalizability of the trained model on an unseen case. In each round, a trained model was generated using features selected by Sequential Forward Feature Selection (SFFS) (65) and an internal cross-validation (CV). Starting from an empty set, SFFS sequentially added features as long as their addition resulted in CV accuracy improvement of 5%. We used diagonal quadratic discriminant analysis (DQDA) as the classification method (65). DQDA is a naïve Bayes classifier that allows for diagonal class covariance matrices and has shown to be successful in classification tasks of high-dimensional data with small sample sizes (67). Several studies have shown that DQDA has comparable or better performance than support vector machine in classification of high-dimensional data (68, 69).
Our data, by its nature, contained class imbalance, in which dominance of the majority class can hinder the classifier’s ability to learn the inherent properties of each class. To ensure generalizability of the result in experiments with substantial class imbalance, we used an ensemble down-sampling approach coupled with the above-mentioned learning scheme. In each CV round the training samples were divided into majority and minority groups. The majority group was then randomly divided into subsets roughly the same size as the minority group. Each of the subsets was merged with the minority group and served as the training set. The average probability across models for the test sample was used as the probability for that sample. This iterative process allowed every sample in the data set to serve as the left-out sample once.
The area under the receiver operating characteristic curve, sensitivity, and specificity were used to assess classification performance using the open-source software packages R (2.7) (70) and Scipy (0.15.1, Python 2.7) (71). The method of DeLong et al. and the pRoc package (72) were used to estimate the receiver operating characteristic (ROC) curve significance, p values, and 95% confidence intervals (73). The significance level (p<0.05) is the probability that the observed sample area under the ROC curve is significantly different from the null hypothesis (area=0.5) and is evidence that the model does have an ability to distinguish between the two groups.

Results

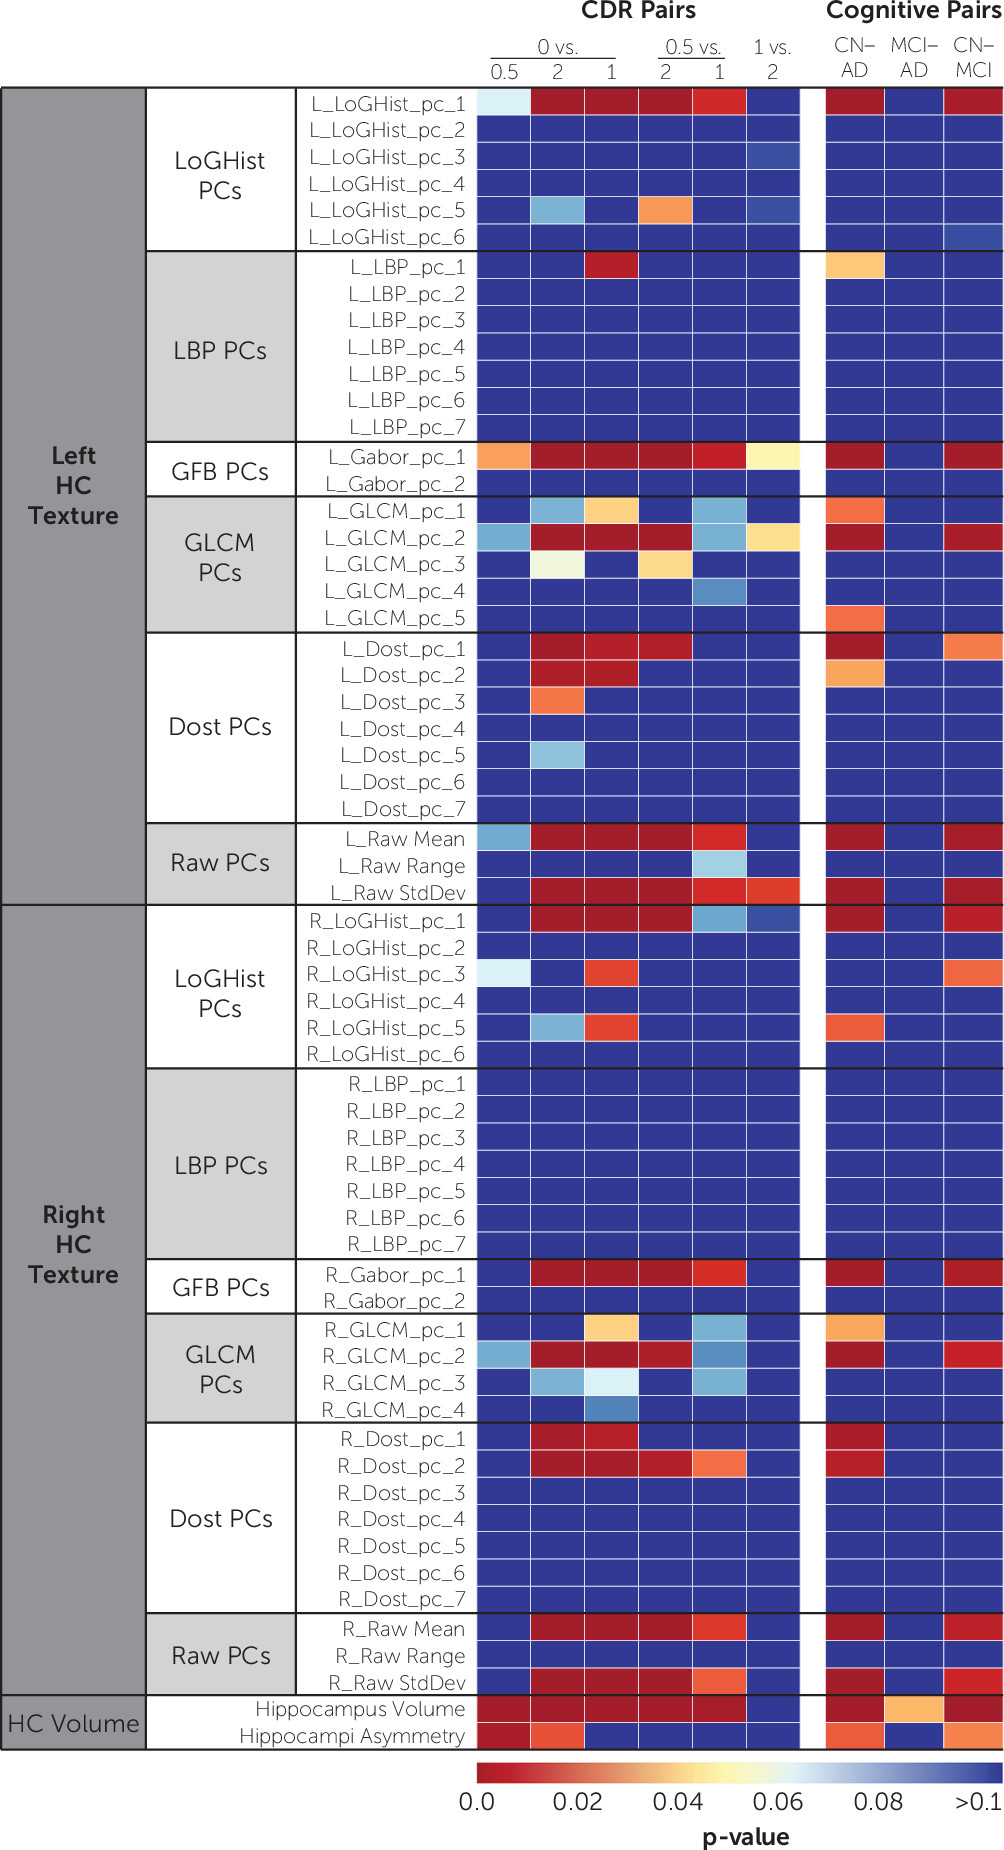
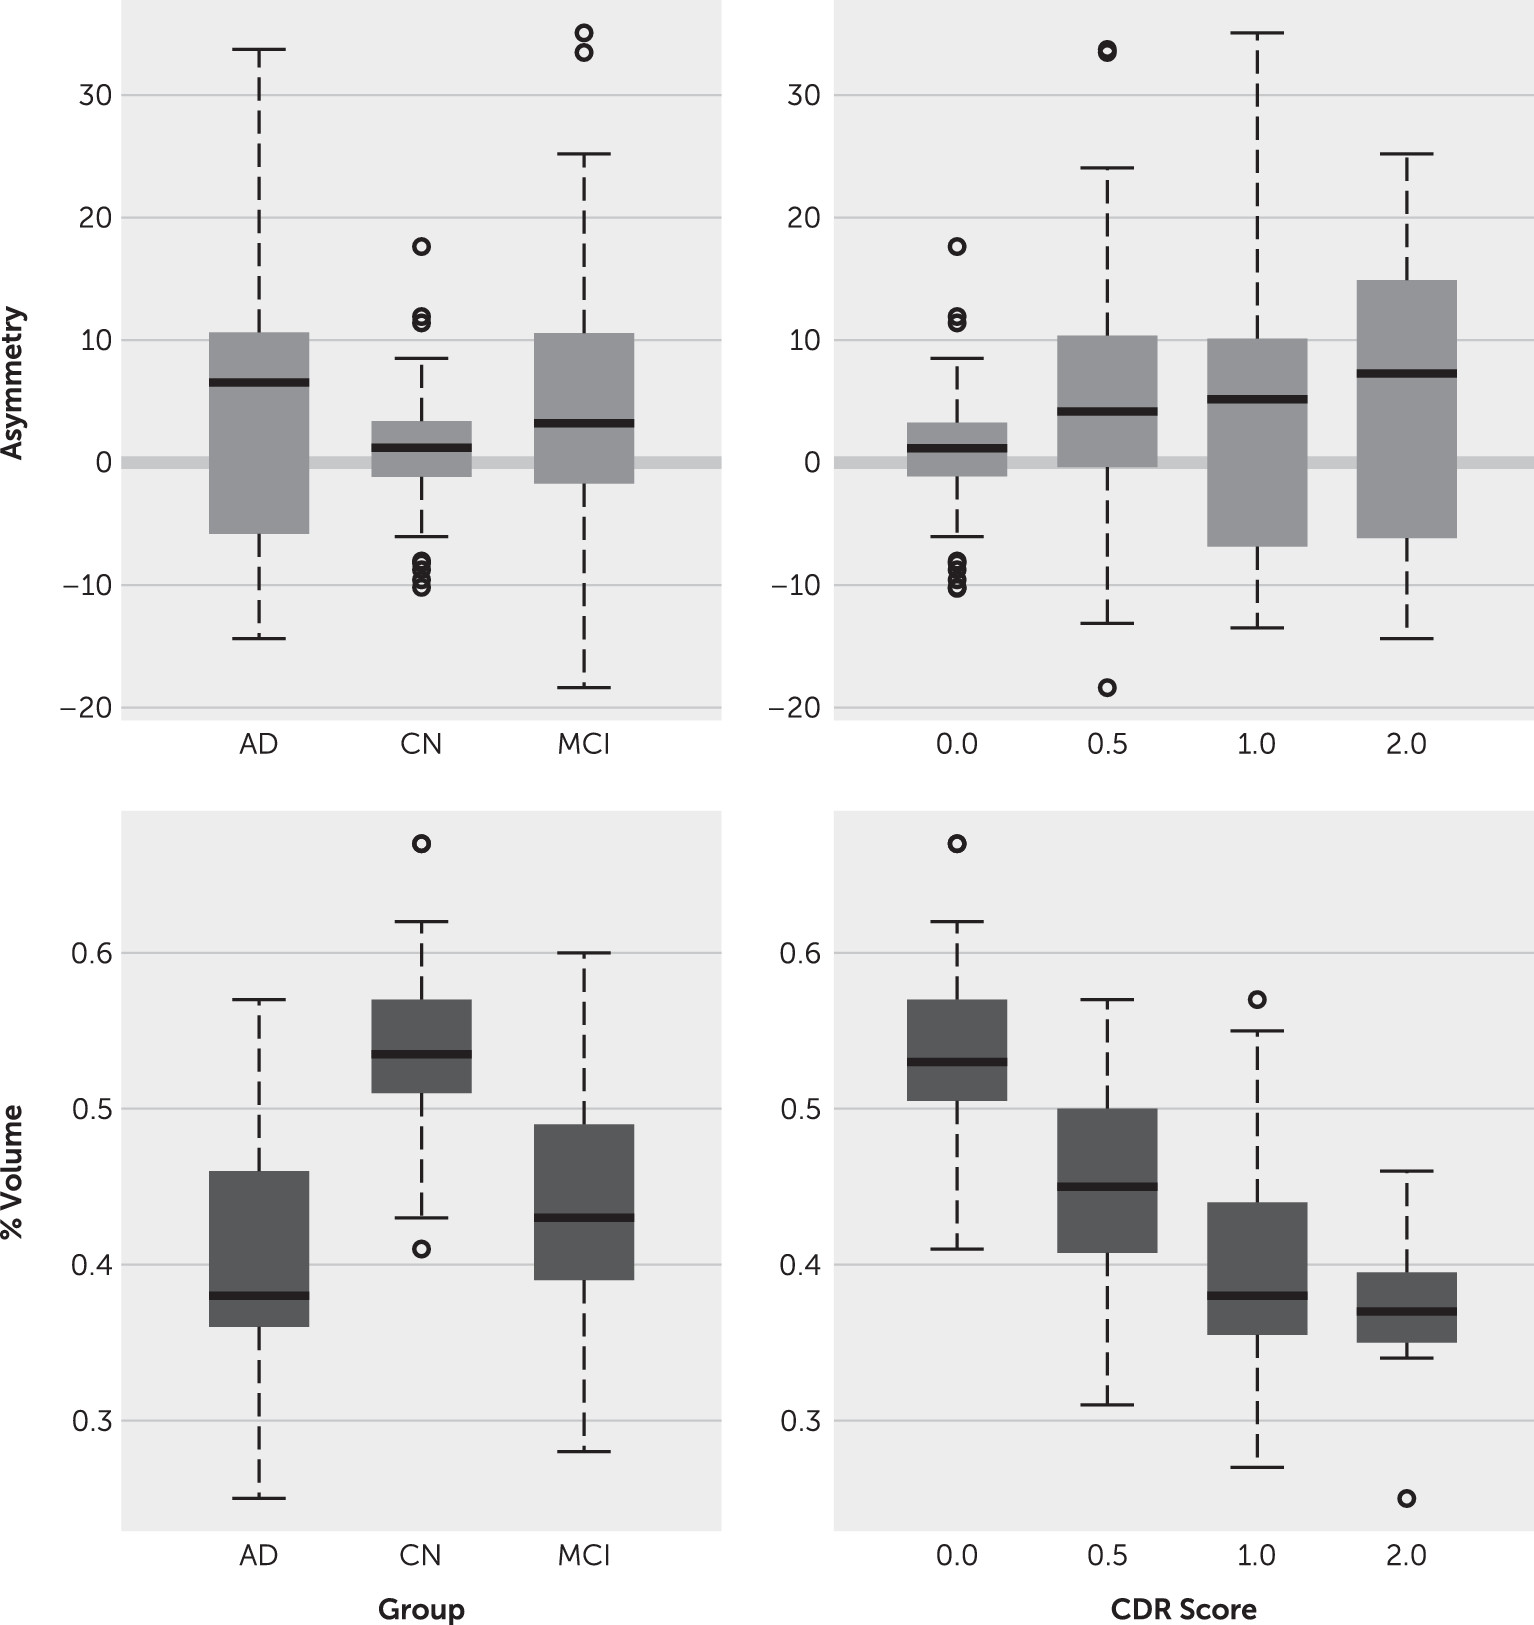
The mild cognitive impairment group had a higher proportion of males than the cognitively normal and Alzheimer’s disease groups (Pearson’s χ2=5.2120, df=2, p=0.02). No significant difference was observed in sex ratio of the other groups. Including sex in models with texture did not impact results. As expected, the age of participants in the CDR 2 group was significantly higher than other CDR levels. Including age in models with volume did not impact results. Figure 2 compares volume features across groups and CDR scores. Figure 3 shows the univariate comparison of features across feature groups. Features extracted from left and right hippocampi showed similar significance levels. Increasing the level of variance included in the principal components of texture features did not improve the results.
FIGURE 2. Comparison volume features across cognitive groups and Clinical Dementia Rating (CDR) scale scoresa
a The plots show the distribution of the two volume features (y-axis) across different groups of participants: cognitive groups and CDR scores (x-axis). Percent volume shows the sum of hippocampal volumes in relation to the volume of intracranial cavity. The asymmetry index shows the difference between the right and left hippocampal volumes divided by their mean. AD=Alzheimer’s disease, CN=cognitively normal, MCI=mild cognitive impairment.
FIGURE 3. Radiomic features that differentiate Clinical Dementia Rating (CDR) scale scores and cognitive groupsa
a Dependent variables are listed above columns (CDR score and cognitive group). Data were separated into different combinations of binary scores for each dependent variable, and univariate analysis was performed. Color maps show the false discovery rate-corrected p values of a two-sample t test within the data set of each classification problem. Red to white colors indicates significant (low) p values. A lower p value indicates a better ability to differentiate the pair of dependent variables in the column title. Dost=discrete Orthonormal Stockwell transform, Gabor=Gabor filter banks, GLCM-gray-level co-occurrence matrices, HC=hippocampus, LBP=local binary patterns, LoGHist=Laplacian of Gaussian histograms.

Prediction of Cognitive Groups

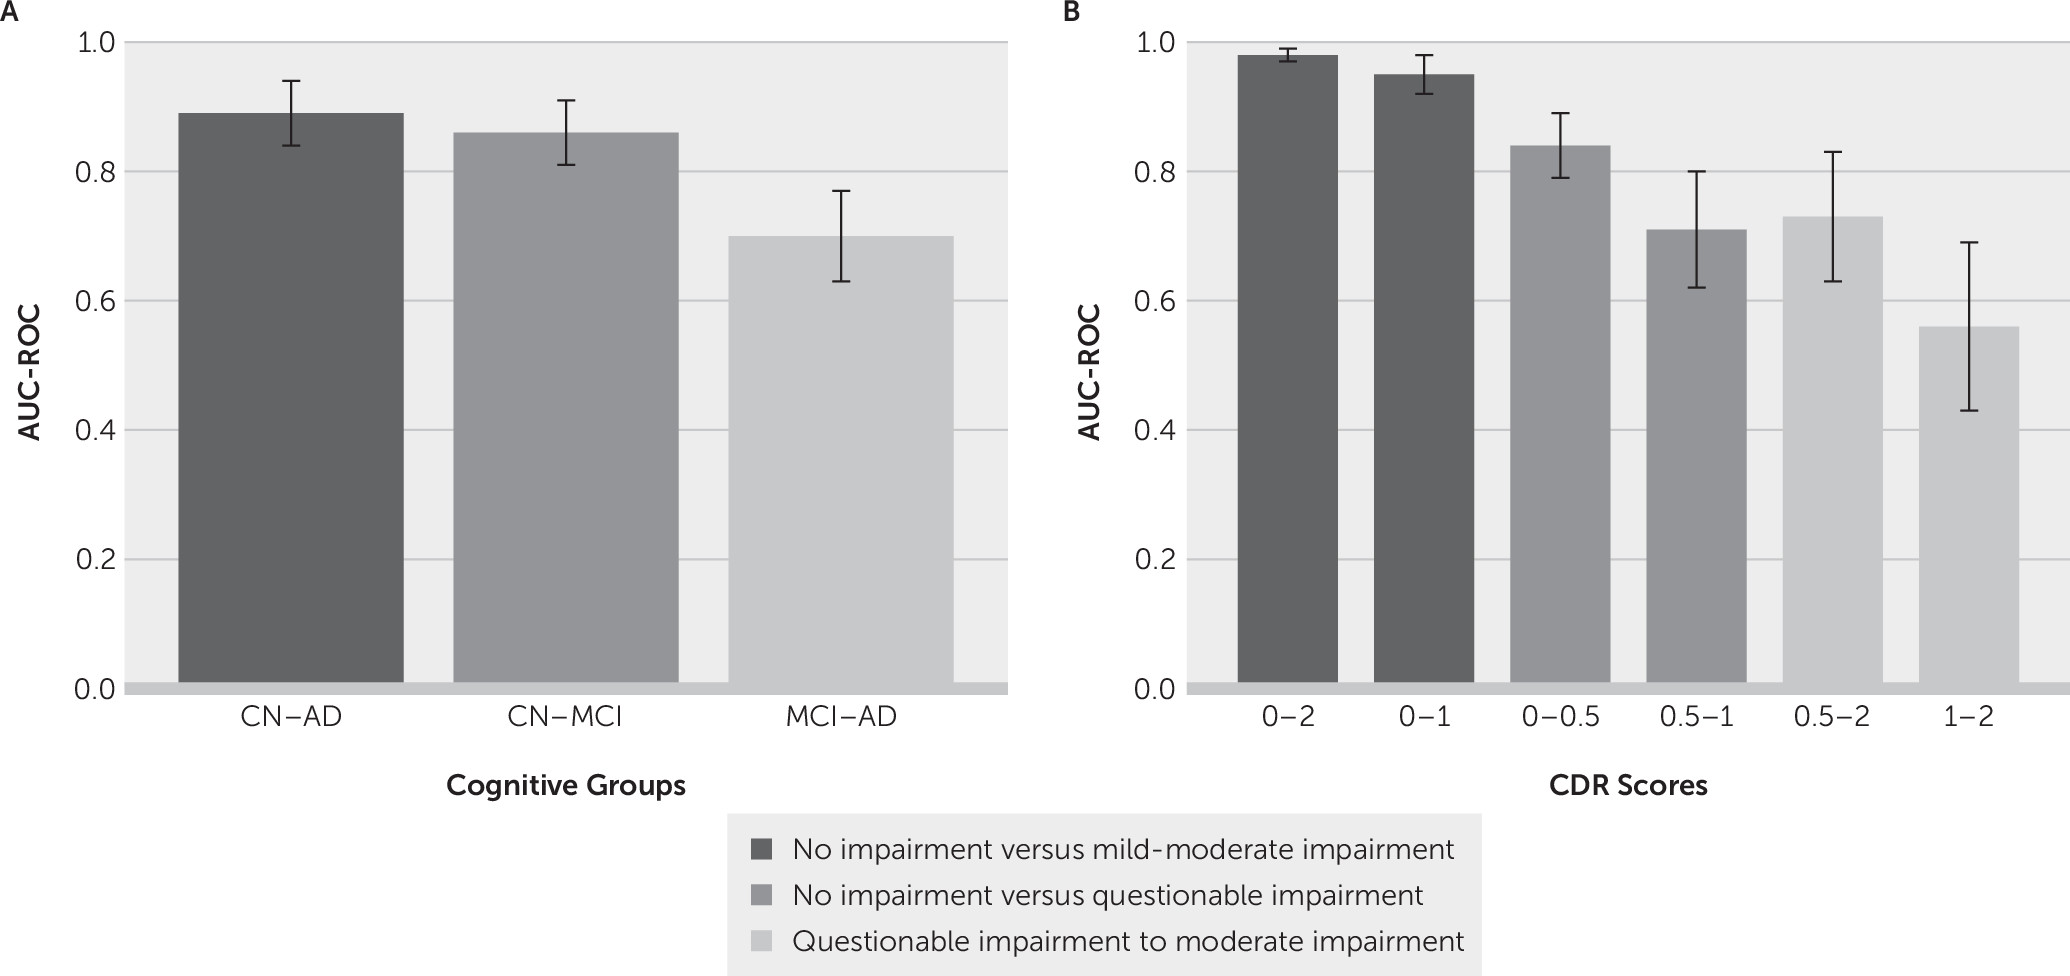
The area under the ROC curves (AUCs) for the classification of cognitive groups is shown in Figure 4A. Classification reached AUC levels of 0.89 (CI=0.82–0.94) for cognitively normal compared with Alzheimer’s disease; 0.86 (CI=0.79–0.91) for cognitively normal compared with mild cognitive impairment; and 0.70 (CI=0.61–0.77) for mild cognitive impairment compared with Alzheimer’s disease. The performance measures, selected features, and ROC curve analysis for the cognitive groups are summarized in Table 3. All three models were significant at a p value ≤0.05. Including sex in the models did not affect the results.
FIGURE 4. Comparison of area under the receiver operating characteristic (ROC) curvesa
a Panel A shows the area under the ROC curves of cognitive group classification models. Panel B shows the area under the ROC of the Clinical Dementia Rating (CDR) scale score classification models. Error bars show the confidence interval of the areas under the curve. AD=Alzheimer’s disease, CN=cognitively normal, MCI=mild cognitive impairment. Bars with the same color in panels A and B are associated with classification experiments that differentiate similar levels of cognitive impairment. Dark bars=no impairment versus mild-moderate impairment (CN–AD [left]; CDR 0–2 and 0–1 [right]); medium bars=no impairment versus questionable impairment (CN–MCI [left] or no impairment/questionable impairment versus mild impairment (CDR 0–0.5 and 0.5–1 [right]); light bars=questionable impairment to moderate impairment (MCI–AD [left]) or questionable and mild impairment versus moderate impairment (CDR 0.5–2 and 1–2 [right]).
TABLE 3. Classification results for prediction of cognitive groupsa
Cognitive groupArea under the curveSensitivitySpecificityFeature typeFeatureStandard errorb95% CIZ statisticpc
CN compared with MCI0.860.790.83TextureLeft HC LoGHist pc 1; Right HC LBP pc 10.030.79, 0.9111.58<0.0001
MCI compared with AD0.700.540.83TextureLeft HC LBP pc 10.050.61, 0.774.16<0.0001
CN compared with AD0.890.820.87Volume% HC Volume0.030.82, 0.9412.31<0.0001
a
AD=Alzheimer’s disease, CN=cognitively normal, HC=hippocampus, LBP=local binary patterns, LoGHist=Laplacian of Gaussian histograms, MCI=mild cognitive impairment, PC=principal component, %volume=relative volume in percent.
b
For further details, see DeLong et al. (73)
c
The significance level (p<0.05) is the probability that the observed sample area under the receiver operating characteristic curve is significantly different from the null hypothesis (area=0.5).

Prediction of CDR Scores

The AUCs for the classification of CDR scores is shown in Figure 4B. The AUC levels of our models were: 0.98 (CI=0.93–0.99) for CDRs 0–2; 0.95(CI=0.9–0.98) for CDRs 0–1; 0.84 (CI=0.76–0.89) for CDRs 0–0.5; 0.73 (CI=0.61–0.83) for CDRs 0.5–2; 0.71 (CI=0.61–0.8) for CDRs 0.5–1; and 0.56 (CI=0.42–0.69) for CDRs 1–2. Overall, models were more successful in classification when the target groups were farther apart on the CDR spectrum. Details of the models’ performance and significance, selected features, and ROC curve statistics for this analysis are present in Table 4. All models were significant at a p value ≤0.05 except for the classification model CDR 1–2. Relative volume of hippocampi (percent volume) was a predictive feature in two of the six models. We conducted further analysis to assess whether age accounted for the significance of percent volume. When age was included in the model, percent volume remained highly statistically significant (p=0.003), while age was not significant (p=0.35). The AUC only slightly increased from 0.98 (model with percent volume alone) to 0.9910 (model with percent volume and age). A model containing age by itself resulted in an AUC of only 0.785, and the addition of percent volume significantly improved the model fit (p<0.0001). Thus, we conclude that percent volume is meaningful in differentiating between CDR 0 and 2, independent of age.
TABLE 4. Classification results for prediction of the Clinical Dementia Rating (CDR) scale scorea
CDR pairsbArea under the curveSensitivitySpecificityFeature typeFeatureStandard errorc95% CIZ statisticpd
0, 0.50.840.780.81Volume% HC Volume0.040.76, 0.899.67<0.0001
0.5, 10.710.770.67TextureRight HC Dost pc20.050.61, 0.84.030.0001
1, 20.560.580.59TextureLeft HC Gabor pc 10.080.42, 0.690.740.46
0, 10.950.880.96TextureLeft HC Dost pc1, Left HC LoGHist pc5, Left HC Gabor pc1, Right HC GLCM pc20.020.9, 0.9822.88<0.0001
0.5, 20.730.580.90TextureLeft HC Gabor pc1, Left HC Dost pc10.080.61, 0.832.890.0038
0, 20.981.00.90Volume% HC Volume0.010.93, 0.9946.5<0.0001
a
Gabor=Gabor filter banks, Dost=discrete orthonormal Stockwell transform, GLCM=gray-level concurrence matrices, HC=hippocampus, LBP=local binary patterns, LoGHist=Laplacian of Gaussian histograms; PC=principal component, % volume=relative volume in percent.
b
Participants with a CDR score of 0 were classified as having no impairment, those with a score of 0.5 were classified as having questionable cognitive impairment or mild cognitive impairment, those with a score of 1 were classified as having mild dementia or impairment, and those with a score of 2 were classified as having moderate dementia or impairment.
c
For further details, see DeLong et al. (73)
d
The significance level (p<0.05) is the probability that the observed sample area under the receiver operating characteristic curve is significantly different from the null hypothesis (area=0.5).

Discussion

The well-established MR volume features and radiomics texture features had comparable and complimentary utility in classifying cognitive groups and CDR categories. There is ample literature on the utility of imaging features extracted from MRI to assist in clinical diagnosis of probable Alzheimer’s disease. Several investigations have focused on using volume, shape, and other structural MR features in identifying cognitively normal, mild cognitive impairment, and Alzheimer’s disease groups (10, 13, 18, 26, 28, 30, 7478). Texture features have also been used in identifying Alzheimer’s disease (14, 28, 3235, 79). The literature is controversial about exactly what texture captures in the context of Alzheimer’s disease. Sørensen et al. (14) speculated that texture patterns may provide information on hippocampal function as a result of the significant correlation with [18F]fluorodeoxyglucose-positron emission tomography uptake. The same group also found that hippocampal texture, followed by hippocampal volume, were the most significant features in their algorithm to discriminate cognitive groups (35).
Our results are consistent with those of Sørensen et al. (14) For example, when they used only volume to discriminate between ADNI cognitively normal individuals and those with Alzheimer’s disease, they achieved an AUC of 0.91. In our case, we achieved an AUC of 0.89 on this task. Sørensen et al. (14) also used texture features to differentiate cognitively normal individuals from those with mild cognitive impairment with an AUC of 0.76, comparable to our AUC of 0.86 for the same task.
One technical difference between our methods and those of Sørensen et al. (14) is that Sørensen et al. resampled MR images in order to have consistency in image voxel size across their cohort. Resampling is often a necessary preprocessing step when images are obtained using different imaging protocols or devices. However, resampling involves interpolation, which can affect the spatial frequency content of the image. In order to establish a reliable baseline for the utility of texture features, we focused on images with a common voxel size in this study. We also used 3-T imaging for higher spatial resolution and contrast-to-noise ratios. Another difference between our work and that conducted by Sørensen et al. is that we used texture features to predict CDR scores. We were able to distinguish CDR 0 (no impairment) from 1 (mild dementia) with an AUC of 0.95. This model used a variety of texture features but not hippocampal volume. On the other hand, volume features alone were able to distinguish CDR 0 from 0.5 (questionable impairment) with an AUC of 0.84. They also were able to distinguish CDR 0 from 2 (moderate dementia) with an AUC of 0.98. Overall, our CDR models performed well at distinguishing cognitively normal people from those with early-stage or questionable cognitive impairment.
Distinguishing between CDR 1 and 2 was the most difficult task in our study, and AUC classification performance was poor, not achieving statistical significance (p=0.46). The transition from mild to moderate impairment appears to be a subtle shift without pronounced discernable changes in texture or hippocampal volume. While texture features suggest that CDR scores and neuropathology may have a relationship early in cognitive impairment (that is, early deposition of amyloid or tau), the lack of discrimination accuracy between CDR 1 and 2 suggests that the pathological depositions may not help in improving classification accuracy. Aisen et al. (80) posited that the terminology behind mild and moderate Alzheimer’s disease is inaccurate, because the individual has had the disease present for many years. The clinical staging nomenclature infers a clear distinction between various stages, but in reality, the process progresses in a more continuous manner (80).
As a result of technical limitations of our pipeline, we did not perform three-dimensional segmentation of the hippocampi. Instead, we used a 2.5D segmentation approach in which the hippocampi were segmented on several two-dimensional slices to increase texture sampling. In this approach, we manually placed two-dimensional ROIs on three slices with the largest cross-sectional view of the hippocampus (16×16 pixels). We acknowledge that extracted ROIs may have potentially included immediate anatomical structures such as the entorhinal cortex, resulting in mixed captured signals. In future studies, we plan to replicate the study using an automatic segmentation process.
Small sample size is another limitation of this study (N=173). When divided between CDR groups, each dataset consisted of few samples with a high-dimensional feature space, two known contributors to model overfitting. Due to the lack of sufficient sample size, we did not split the dataset into train and test sets. In order to provide a realistic estimation of model performance and avoid overfitting, we adopted a nested CV scheme for model training and validation and a rather conservative threshold for feature selection (minimum of 5% CV accuracy improvement). Given that our results are comparable to previous studies, we feel confident that the risk of overfitting was mitigated and that the results presented here are generalizable to external data. In the future, we aim to validate this result on larger external datasets. Lastly, the reader should note that we cannot claim the clinical utility of textural biomarkers introduced here since the models were not tested prospectively.

Conclusions

We used existing resources (ADNI-1 data) to introduce a new application of brain MR radiomics using texture analysis and volumetric features in the field of aging, neuropsychiatry, and dementia. Our study findings support the use of brain MR radiomics features for identifying early cognitive impairment, as many features are sensitive to early Alzheimer’s disease pathology. Future studies need to replicate these findings and should examine the clinical utility of MR texture features as Alzheimer’s disease biomarkers. Beyond volume and texture analysis of T1 images of the hippocampus, future applications should expand to incorporate additional data sources. These could include additional MRI contrasts (for example, diffusion tensor imaging), fMRI, and PET. Additional brain structures known to be involved in Alzheimer’s disease progression could also be investigated.
Footnotes

Dr. Ranjbar and Ms. Velgos contributed equally to this study.
Data used in preparation of this article were obtained from the Alzheimer’s Disease Neuroimaging Initiative (ADNI) database (adni.loni.usc.edu). As such, the investigators within ADNI contributed to the design and implementation of ADNI and/or provided data but did not participate in the analysis or writing of this article. A complete listing of ADNI investigators is available online (http://adni.loni.usc.edu/wpcontent/uploads/how_to_apply/ADNI_Acknowledgement_List.pdf).
The contents of this article are solely the responsibility of the authors and do not necessarily represent the official view of NIH.

References

1.
Brookmeyer R, Johnson E, Ziegler-Graham K, et al: Forecasting the global burden of Alzheimer’s disease. Alzheimers Dement 2007; 3:186–191
2.
2016 Alzheimer’s Disease Facts. Chicago, Alzheimer’s Association, 2016; Available at http://www.alz.org/facts/.
3.
Jack CR Jr, Knopman DS, Jagust WJ, et al: Hypothetical model of dynamic biomarkers of the Alzheimer’s pathological cascade. Lancet Neurol 2010; 9:119–128
4.
Dubois B, Feldman HH, Jacova C, et al: Research criteria for the diagnosis of Alzheimer’s disease: revising the NINCDS-ADRDA criteria. Lancet Neurol 2007; 6:734–746
5.
Schneider LS, Mangialasche F, Andreasen N, et al: Clinical trials and late-stage drug development for Alzheimer’s disease: an appraisal from 1984 to 2014. J Intern Med 2014; 275:251–283
6.
Hardy J, Selkoe DJ: The amyloid hypothesis of Alzheimer’s disease: progress and problems on the road to therapeutics. Science 2002; 297:353–356
7.
Hulette CM, Welsh-Bohmer KA, Murray MG, et al: Neuropathological and neuropsychological changes in “normal” aging: evidence for preclinical Alzheimer disease in cognitively normal individuals. J Neuropathol Exp Neurol 1998; 57:1168–1174
8.
Shaw LM, Korecka M, Clark CM, et al: Biomarkers of neurodegeneration for diagnosis and monitoring therapeutics. Nat Rev Drug Discov 2007; 6:295–303
9.
West MJ, Coleman PD, Flood DG, et al: Differences in the pattern of hippocampal neuronal loss in normal ageing and Alzheimer’s disease. Lancet 1994; 344:769–772
10.
Jack CR Jr, Shiung MM, Gunter JL, et al: Comparison of different MRI brain atrophy rate measures with clinical disease progression in AD. Neurology 2004; 62:591–600
11.
Cuingnet R, Gérardin E, Tessieras J, et al: Automatic classification of patients with Alzheimer’s disease from structural MRI: a comparison of ten methods using the ADNI database. Neuroimage 2011; 56:766–781
12.
Ramani A, Jensen JH, Helpern JA: Quantitative MR imaging in Alzheimer disease. Radiology 2006; 241:26–44
13.
Falahati F, Westman E, Simmons A: Multivariate data analysis and machine learning in Alzheimer’s disease with a focus on structural magnetic resonance imaging. J Alzheimers Dis 2014; 41:685–708
14.
Sørensen L, Igel C, Liv Hansen N, et al: Early detection of Alzheimer’s disease using MRI hippocampal texture. Hum Brain Mapp 2016; 37:1148–1161
15.
Convit A, De Leon MJ, Tarshish C, et al: Specific hippocampal volume reductions in individuals at risk for Alzheimer’s disease. Neurobiol Aging 1997; 18:131–138
16.
Fox NC, Freeborough PA: Brain atrophy progression measured from registered serial MRI: validation and application to Alzheimer’s disease. J Magn Reson Imaging 1997; 7:1069–1075
17.
Gerardin E, Chételat G, Chupin M, et al: Multidimensional classification of hippocampal shape features discriminates Alzheimer’s disease and mild cognitive impairment from normal aging. Neuroimage 2009; 47:1476–1486
18.
Achterberg HC, van der Lijn F, den Heijer T, et al: Hippocampal shape is predictive for the development of dementia in a normal, elderly population. Hum Brain Mapp 2014; 35:2359–2371
19.
Costafreda SG, Dinov ID, Tu Z, et al: Automated hippocampal shape analysis predicts the onset of dementia in mild cognitive impairment. Neuroimage 2011; 56:212–219
20.
Devanand DP, Pradhaban G, Liu X, et al: Hippocampal and entorhinal atrophy in mild cognitive impairment: prediction of Alzheimer disease. Neurology 2007; 68:828–836
21.
Henneman WJ, Sluimer JD, Barnes J, et al: Hippocampal atrophy rates in Alzheimer disease: added value over whole brain volume measures. Neurology 2009; 72:999–1007
22.
Jack CR Jr, Shiung MM, Weigand SD, et al: Brain atrophy rates predict subsequent clinical conversion in normal elderly and amnestic MCI. Neurology 2005; 65:1227–1231
23.
Jack CR Jr, Petersen RC, Xu YC, et al: Prediction of AD with MRI-based hippocampal volume in mild cognitive impairment. Neurology 1999; 52:1397–1403
24.
Braak H, Braak E: Frequency of stages of Alzheimer-related lesions in different age categories. Neurobiol Aging 1997; 18:351–357
25.
Jack CR, Jr., Barkhof F, Bernstein MA, et al.: Steps to standardization and validation of hippocampal volumetry as a biomarker in clinical trials and diagnostic criterion for Alzheimer's disease. Alzheimers Dement 2011; 7:474-485 e4
26.
Davatzikos C, Fan Y, Wu X, et al: Detection of prodromal Alzheimer’s disease via pattern classification of magnetic resonance imaging. Neurobiol Aging 2008; 29:514–523
27.
Davatzikos C, Bhatt P, Shaw LM, et al.: Prediction of MCI to AD conversion, via MRI, CSF biomarkers, and pattern classification. Neurobiol Aging 2011; 32:2322 -e19-27
28.
Chincarini A, Bosco P, Calvini P, et al: Local MRI analysis approach in the diagnosis of early and prodromal Alzheimer’s disease. Neuroimage 2011; 58:469–480
29.
Filipovych R, Davatzikos C: Semi-supervised pattern classification of medical images: application to mild cognitive impairment (MCI). Neuroimage 2011; 55:1109–1119
30.
Fan Y, Batmanghelich N, Clark CM, et al: Spatial patterns of brain atrophy in MCI patients, identified via high-dimensional pattern classification, predict subsequent cognitive decline. Neuroimage 2008; 39:1731–1743
31.
Risacher SL, Saykin AJ, West JD, et al: Baseline MRI predictors of conversion from MCI to probable AD in the ADNI cohort. Curr Alzheimer Res 2009; 6:347–361
32.
Zhang J, Yu C, Jiang G, et al: 3D texture analysis on MRI images of Alzheimer’s disease. Brain Imaging Behav 2012; 6:61–69
33.
Freeborough PA, Fox NC: MR image texture analysis applied to the diagnosis and tracking of Alzheimer’s disease. IEEE Trans Med Imaging 1998; 17:475–479
34.
de Oliveira MS, Balthazar ML, D’Abreu A, et al: MR imaging texture analysis of the corpus callosum and thalamus in amnestic mild cognitive impairment and mild Alzheimer disease. AJNR Am J Neuroradiol 2011; 32:60–66
35.
Sørensen L, Igel C, Pai A, et al: Differential diagnosis of mild cognitive impairment and Alzheimer’s disease using structural MRI cortical thickness, hippocampal shape, hippocampal texture, and volumetry. Neuroimage Clin 2016; 13:470–482
36.
Kumar V, Gu Y, Basu S, et al: Radiomics: the process and the challenges. Magn Reson Imaging 2012; 30:1234–1248
37.
Lambin P, Rios-Velazquez E, Leijenaar R, et al: Radiomics: extracting more information from medical images using advanced feature analysis. Eur J Cancer 2012; 48:441–446
38.
Gillies RJ, Kinahan PE, Hricak H: Radiomics: images are more than pictures, they are data. Radiology 2016; 278:563–577
39.
Hu LS, Ning S, Eschbacher JM, et al: Multi-parametric MRI and texture analysis to visualize spatial histologic heterogeneity and tumor extent in glioblastoma. PLoS One 2015; 10:e0141506
40.
Hu LS, Ning S, Eschbacher JM, et al: Radiogenomics to characterize regional genetic heterogeneity in glioblastoma. Neuro Oncol 2017; 19:128–137
41.
Dang M, Lysack JT, Wu T, et al: MRI texture analysis predicts p53 status in head and neck squamous cell carcinoma. AJNR Am J Neuroradiol 2015; 36:166–170
42.
Ranjbar S, Ning S, Zwart CM, et al: Computed tomography-based texture analysis to determine human papillomavirus status of oropharyngeal squamous cell carcinoma. J Comput Assist Tomogr 2018; 42:299–305
43.
Patel BK, Ranjbar S, Wu T, et al: Computer-aided diagnosis of contrast-enhanced spectral mammography: A feasibility study. Eur J Radiol 2018; 98:207–213
44.
Weiner MW, Veitch DP, Aisen PS, et al: The Alzheimer’s Disease Neuroimaging Initiative: a review of papers published since its inception. Alzheimers Dement 2012; 8(Suppl):S1–S68
46.
ADNI Study Design; Background & Rationale. 2018. http://adni.loni.usc.edu/study-design/background-rationale/
47.
Morris JC: The Clinical Dementia Rating (CDR): current version and scoring rules. Neurology 1993; 43:2412–2414
48.
Hughes CP, Berg L, Danziger WL, et al: A new clinical scale for the staging of dementia. Br J Psychiatry 1982; 140:566–572
49.
O’Bryant SE, Waring SC, Cullum CM, et al: Staging dementia using Clinical Dementia Rating Scale Sum of Boxes scores: a Texas Alzheimer’s Research Consortium study. Arch Neurol 2008; 65:1091–1095
50.
Petersen RC, Caracciolo B, Brayne C, et al: Mild cognitive impairment: a concept in evolution. J Intern Med 2014; 275:214–228
51.
MRI Pre-processing: Image Corrections Provided by ADNI. 2016. http://adni.loni.usc.edu/methods/mri-analysis/mri-pre-processing/
52.
Mitchell JR, Jones C, Karlik SJ, et al: MR multispectral analysis of multiple sclerosis lesions. J Magn Reson Imaging 1997; 7:499–511
54.
Haralick RMSK, Dinstein IH: Textural features for image classification. IEEE Trans Syst Man Cybern 1973; 3:610–621
55.
Clarke LP, Croft BS, Nordstrom R, et al: Quantitative imaging for evaluation of response to cancer therapy. Transl Oncol 2009; 2:195–197
56.
Drabycz S, Stockwell RG, Mitchell JR: Image texture characterization using the discrete orthonormal S-transform. J Digit Imaging 2009; 22:696–708
57.
Jain AK, Farrokhnia F: Unsupervised texture segmentation using Gabor filters; in 1990 IEEE International Conference on Systems, Man, and Cybernetics Conference Proceedings. Los Angeles, IEEE, 1990
58.
Ojala T, Pietikainen M, Maenpaa T: Multiresolution gray-scale and rotation invariant texture classification with local binary patterns. Pattern Analysis and Machine Intelligence. IEEE Transactions 2002; 24:971–979
59.
van der Walt S, Schönberger JL, Nunez-Iglesias J, et al: scikit-image: image processing in Python. PeerJ 2014; 2:e453
60.
Coelho LP: Mahotas: Open source software for scriptable computer vision. J Open Res Softw 2013; 1:e3
61.
Ramkumar S, Ranjbar S, Ning S, et al: MRI-based texture analysis to differentiate sinonasal squamous cell carcinoma from inverted papilloma. AJNR Am J Neuroradiol 2017; 38:1019–1025
62.
Manjón JV, Coupé P: volBrain: an online MRI brain volumetry system. 2016. http://volbrain.upv.es/
63.
Manjón JV, Coupé P: volBrain: an online MRI brain volumetry system. Front Neuroinform 2016; 10:30
64.
Benjamini YHY: Controlling the false discovery rate: a practical and powerful approach to multiple testing. J Roy Stat Soc B Met 1995; 57:289–300
65.
Johnson RA, Wichern DW: Applied multivariate statistical analysis. London, Prentice Hall, 1992
66.
Pedregosa V, Varoquaux G, Gramfort A, et al: Scikit-learn: machine learning in Python. J Mach Learn Res 2011; 12:2825–2830
67.
Dudoit S, Fridlyand J, Speed TP: Comparison of discrimination methods for the classification of tumors using gene expression data. J Am Stat Assoc 2002; 97:77–87
68.
Lee JW, Lee JB, Park M, et al: An extensive comparison of recent classification tools applied to microarray data. Comput Stat Data Anal 2005; 48:869–885
69.
Ye J, Li T, Xiong T, et al: Using uncorrelated discriminant analysis for tissue classification with gene expression data. IEEE/ACM Trans Comput Biol Bioinformatics 2004; 1:181–190
70.
R Core Team: A language and environment for statistical computing. 2017. http://www.R-project.org
71.
Jones E, Oliphant E, Peterson P, et al: SciPy: open source scientific tools for Python. 2001. http://www.scipy.org.
72.
Robin X, Turck N, Hainard A, et al: pROC: an open-source package for R and S+ to analyze and compare ROC curves. BMC Bioinformatics 2011; 12:77
73.
DeLong ER, DeLong DM, Clarke-Pearson DL: Comparing the areas under two or more correlated receiver operating characteristic curves: a nonparametric approach. Biometrics 1988; 44:837–845
74.
Schuff N, Woerner N, Boreta L, et al: MRI of hippocampal volume loss in early Alzheimer’s disease in relation to ApoE genotype and biomarkers. Brain 2009; 132:1067–1077
75.
Vemuri P, Wiste HJ, Weigand SD, et al: MRI and CSF biomarkers in normal, MCI, and AD subjects: diagnostic discrimination and cognitive correlations. Neurology 2009; 73:287–293
76.
Chupin M, Gérardin E, Cuingnet R, et al: Fully automatic hippocampus segmentation and classification in Alzheimer’s disease and mild cognitive impairment applied on data from ADNI. Hippocampus 2009; 19:579–587
77.
Tang X, Holland D, Dale AM, et al: Shape abnormalities of subcortical and ventricular structures in mild cognitive impairment and Alzheimer’s disease: detecting, quantifying, and predicting. Hum Brain Mapp 2014; 35:3701–3725
78.
McEvoy LK, Fennema-Notestine C, Roddey JC, et al: Alzheimer disease: quantitative structural neuroimaging for detection and prediction of clinical and structural changes in mild cognitive impairment. Radiology 2009; 251:195–205
79.
Hwang EJ, Kim HG, Kim D, et al: Texture analyses of quantitative susceptibility maps to differentiate Alzheimer’s disease from cognitive normal and mild cognitive impairment. Med Phys 2016; 43:4718
80.
Aisen PS, Cummings J, Jack CR Jr, et al: On the path to 2025: understanding the Alzheimer’s disease continuum. Alzheimers Res Ther 2017; 9:60

Information & Authors

Information

Published In

Go to The Journal of Neuropsychiatry and Clinical Neurosciences
The Journal of Neuropsychiatry and Clinical Neurosciences
Pages: 210 - 219
PubMed: 30636564

History

Received: 31 December 2017
Revision received: 18 April 2018
Revision received: 23 June 2018
Accepted: 24 June 2018
Published online: 14 January 2019
Published in print: Summer 2019

Keywords

  1. Alzheimer’s Disease
  2. Cognitive Disorders
  3. Imaging Techniques
  4. Dementia
  5. Neuropsychiatric Rating Scales

Authors

Details

Sara Ranjbar, Ph.D.
The Department of Research, Mayo Clinic Arizona, Phoenix (Ranjbar); the Center for Clinical and Translational Science, Mayo Clinic Graduate School of Biomedical Sciences (Velgos); the Department of Biostatistics, Mayo Clinic Arizona, Phoenix (Dueck); the Department of Psychiatry and Psychology, Mayo Clinic Arizona, Phoenix (Geda); the Department of Neurology, Mayo Clinic Arizona, Phoenix (Geda), and the Department of Physiology and Biomedical Engineering, Mayo Clinic Arizona, Phoenix (Mitchell).
Stefanie N. Velgos, M.Sc.
The Department of Research, Mayo Clinic Arizona, Phoenix (Ranjbar); the Center for Clinical and Translational Science, Mayo Clinic Graduate School of Biomedical Sciences (Velgos); the Department of Biostatistics, Mayo Clinic Arizona, Phoenix (Dueck); the Department of Psychiatry and Psychology, Mayo Clinic Arizona, Phoenix (Geda); the Department of Neurology, Mayo Clinic Arizona, Phoenix (Geda), and the Department of Physiology and Biomedical Engineering, Mayo Clinic Arizona, Phoenix (Mitchell).
Amylou C. Dueck, Ph.D.
The Department of Research, Mayo Clinic Arizona, Phoenix (Ranjbar); the Center for Clinical and Translational Science, Mayo Clinic Graduate School of Biomedical Sciences (Velgos); the Department of Biostatistics, Mayo Clinic Arizona, Phoenix (Dueck); the Department of Psychiatry and Psychology, Mayo Clinic Arizona, Phoenix (Geda); the Department of Neurology, Mayo Clinic Arizona, Phoenix (Geda), and the Department of Physiology and Biomedical Engineering, Mayo Clinic Arizona, Phoenix (Mitchell).
Yonas E. Geda, M.D., M.Sc.
The Department of Research, Mayo Clinic Arizona, Phoenix (Ranjbar); the Center for Clinical and Translational Science, Mayo Clinic Graduate School of Biomedical Sciences (Velgos); the Department of Biostatistics, Mayo Clinic Arizona, Phoenix (Dueck); the Department of Psychiatry and Psychology, Mayo Clinic Arizona, Phoenix (Geda); the Department of Neurology, Mayo Clinic Arizona, Phoenix (Geda), and the Department of Physiology and Biomedical Engineering, Mayo Clinic Arizona, Phoenix (Mitchell).
J. Ross Mitchell, Ph.D. [email protected]
The Department of Research, Mayo Clinic Arizona, Phoenix (Ranjbar); the Center for Clinical and Translational Science, Mayo Clinic Graduate School of Biomedical Sciences (Velgos); the Department of Biostatistics, Mayo Clinic Arizona, Phoenix (Dueck); the Department of Psychiatry and Psychology, Mayo Clinic Arizona, Phoenix (Geda); the Department of Neurology, Mayo Clinic Arizona, Phoenix (Geda), and the Department of Physiology and Biomedical Engineering, Mayo Clinic Arizona, Phoenix (Mitchell).
The Alzheimer's Disease Neuroimaging Initiative
The Department of Research, Mayo Clinic Arizona, Phoenix (Ranjbar); the Center for Clinical and Translational Science, Mayo Clinic Graduate School of Biomedical Sciences (Velgos); the Department of Biostatistics, Mayo Clinic Arizona, Phoenix (Dueck); the Department of Psychiatry and Psychology, Mayo Clinic Arizona, Phoenix (Geda); the Department of Neurology, Mayo Clinic Arizona, Phoenix (Geda), and the Department of Physiology and Biomedical Engineering, Mayo Clinic Arizona, Phoenix (Mitchell).

Notes

Send correspondence to Dr. Mitchell ([email protected]).

Competing Interests

The authors report no financial relationships with commercial interests.

Funding Information

National Center for Advancing Translational Sciences10.13039/100006108: UL1 TR000135
Supported by the National Center for Advancing Translational Sciences (grant UL1 TR000135), a component of NIH. Data collection and sharing for this study was funded by the Alzheimer’s Disease Neuroimaging Initiative (NIH grant U01 AG024904) and a Department of Defense Alzheimer’s Disease Neuroimaging Initiative award (W81XWH-12-2-0012). The Alzheimer’s Disease Neuroimaging Initiative is funded by the National Institute on Aging and the National Institute of Biomedical Imaging and Bioengineering and through contributions from AbbVie, the Alzheimer’s Association, the Alzheimer’s Drug Discovery Foundation, Araclon Biotech, BioClinica, Biogen, Bristol-Myers Squibb, CereSpir, Cogstate, Eisai, Elan Pharmaceuticals, Eli Lilly, EuroImmun, F. Hoffmann-La Roche Ltd and its affiliated company Genentech, Fujirebio, GE Healthcare, IXICO Ltd., Janssen Alzheimer Immunotherapy Research and Development, Johnson and Johnson Pharmaceutical Research and Development, Lumosity, Lundbeck, Merck, MesoScale Diagnostics, NeuroRx Research, Neurotrack Technologies, Novartis Pharmaceuticals, Pfizer, Piramal Imaging, Servier, Takeda Pharmaceutical, and Transition Therapeutics.

Metrics & Citations

Metrics

Citations

Export Citations

If you have the appropriate software installed, you can download article citation data to the citation manager of your choice. Simply select your manager software from the list below and click Download.

For more information or tips please see 'Downloading to a citation manager' in the Help menu.

Format
Citation style
Style
Copy to clipboard

View Options

View options

PDF/EPUB

View PDF/EPUB

Login options

Already a subscriber? Access your subscription through your login credentials or your institution for full access to this article.

Personal login Institutional Login Open Athens login
Purchase Options

Purchase this article to access the full text.

PPV Articles - Journal of Neuropsychiatry and Clinical Neurosciences

PPV Articles - Journal of Neuropsychiatry and Clinical Neurosciences

Not a subscriber?

Subscribe Now / Learn More

PsychiatryOnline subscription options offer access to the DSM-5-TR® library, books, journals, CME, and patient resources. This all-in-one virtual library provides psychiatrists and mental health professionals with key resources for diagnosis, treatment, research, and professional development.

Need more help? PsychiatryOnline Customer Service may be reached by emailing [email protected] or by calling 800-368-5777 (in the U.S.) or 703-907-7322 (outside the U.S.).

Media

Figures

Other

Tables

Share

Share

Share article link

Share