Approximately 4.9 million nonlethal violent incidents occur annually in the United States (
1). Although the vast majority of these incidents involve persons with no major mental disorder, social policy and law have focused on preventing violence by individuals with mental illness through civil commitment and mandated community treatments (
2). These allow for involuntary confinement or supervision of persons with mental illness who, because of active symptoms, pose a danger to themselves or others. Psychopathology is thus accepted as a relevant criterion in violence prevention efforts, and yet the conditional probability of violence by diagnosis remains unclear (
3).
Markers of violence might not function in the same way across different diagnostic groups. Studies in the inpatient setting suggest that symptom constellations associated with an act of violence differ according to diagnosis (
4), but little is known about whether this is the case in the community. Characterization of a link between mental illness and violence thus requires consideration of two approaches: a categorical one, separating cases according to diagnostic class, and a dimensional one that examines dynamic fluctuation in risk markers such as symptom levels (
5).
Previous studies of mental disorders and violence have focused particular attention on psychotic disorders (
6,
7). Evidence is mixed about whether individuals with chronic psychotic disorders as a group have an elevated disease-attributable risk of violence, especially after estimates are adjusted for substance use (
8–
13). Meanwhile, relatively little attention has been devoted to the study of violence risk among individuals with affective disorders, who also frequently have co-occurring substance use disorders (
14). Depression is associated with an elevated risk of suicide, but there has been little research on violence toward others among patients with depression (
15–
18).
Previous studies have examined the relationship between symptom levels and violence, but generally without using diagnosis as a grouping variable (
19–
21). For example, hostility was found to be a significant predictor of violence across diagnoses in a sample of individuals at high risk of violence (
22), whereas delusions were not associated with violence when examined across multiple diagnostic groups (
23). In another investigation, co-occurring substance use and noncompliance with medications were associated with violence across mental diagnoses (
24), suggesting that increased symptoms may elevate risk.
This study examined symptom levels and alcohol use among persons with either depression or a psychotic disorder, to assess whether these dynamic indicators exerted similar effects on violence risk within each diagnostic group. We examined data from the MacArthur Violence Risk Assessment Study (
2), a large-scale investigation that followed psychiatric patients in the community for one year after hospital discharge. As previously reported, participants with depression had the same rate of violence as the overall patient sample, and participants with schizophrenia had a significantly lower rate of violence (
2). The MacArthur study data set allows for the examination of the role of symptoms and alcohol use in a defined sample of psychiatric patients, with repeated observations over a one-year period after hospitalization. We hypothesized that reported alcohol use would have a similar impact in both groups of participants and that symptoms most characteristic of each disorder would be significantly related to the risk of community violence.
Methods
Study participants
A sample of 1,136 patients admitted to acute inpatient psychiatric facilities in three cities was recruited for the study between 1992 and 1995 (
8). Eligibility criteria have been previously described (
2,
8). After complete description of the study to the participants, written informed consent was obtained. Institutional review board approval was obtained for this secondary analysis of the data set.
At baseline and follow-up interviews every ten weeks for one year, the participant designated a collateral informant with whom the participant had at least weekly contact. Arrest and rehospitalization records were also available. The study included interviews with participants who were hospitalized or incarcerated at the time of follow-up.
Baseline measures
Demographic variables.
The participant's age and gender were recorded during the baseline interview. Other baseline measures are described elsewhere (
2,
8).
Categorical diagnoses.
The DSM-III-R Checklist (
25,
26) was administered at the baseline interview. Participants were coded on each of 17 categorical diagnoses. DSM-III-R Checklist diagnoses were compared with medical record diagnoses, and a primary diagnosis was assigned based on the most clinically significant syndrome. Data for participants with a primary diagnosis of either depression or a psychotic disorder (schizophrenia, schizoaffective disorder, brief reactive psychosis, schizophreniform disorder, delusional disorder, or psychotic disorder not otherwise specified) were included in this study.
Repeated measures
Symptom levels.
The Brief Psychiatric Rating Scale (BPRS), an 18-item instrument scored on a 7-point scale (
27,
28), was completed at each follow-up. Subscales for affective symptoms and positive symptoms of psychosis were defined in accordance with a meta-analysis of the BPRS factor structure (
29) after confirmation of subscale loadings within the overall sample. The depressive-anxiety symptoms (“affective”) score was the sum of scores on the following items: anxiety, guilt, depression, and somatic preoccupation. The positive symptoms (“positive”) subscale was the sum of scores on the following items: unusual thought content, conceptual disorganization, hallucinatory behavior, and grandiosity.
Alcohol consumption.
Participants were asked the amount of beer, wine, and liquor they had consumed during the week preceding each follow-up interview. In keeping with prior studies defining binge drinking as five drinks on one day (
30), amounts of alcohol consumption in the previous week were coded as none, one to nine drinks (fewer than two binge days, or one to two drinks per day), ten to 34 drinks (fewer than seven binge days, or five drinks per day), 35–69 drinks (fewer than ten per day), and 70 or more drinks.
Violence.
At each follow-up interview, a revised version of the Conflict Tactics Scale (
31,
32) was used to ask participants and collateral informants about the participant's involvement in violence during the previous ten weeks. Violence was defined as an aggressive act that resulted in physical injury, sexual assault, an assaultive act involving the use of a deadly weapon, or a threat made with a weapon in hand. The presence or absence of at least one act of violence was coded on the basis of a previously described algorithm for reconciling participant and collateral reports (
2).
Statistical analyses
Violence outcomes at each assessment point were binary. Multivariate panel logistic regression models using maximum likelihood estimation were examined to assess relationships between symptom levels and alcohol use with concurrent violence (at time t) or lagged violence (at time t+1) as the dependent variable. Models included the five assessment times as repeated measures, with age and gender as fixed factors and the amount of alcohol consumed in the week prior to the interview and either affective or positive symptom subscales on the BPRS as time-varying covariates. Random-effects models allowed the inclusion of cases with incomplete follow-up data or no variation in the outcome variable (no violence).
Two sets of models were examined to assess the conditional effect within each diagnostic group of symptom levels and alcohol use: one set represented the relationship between symptom levels, alcohol use, and the multiplicative interaction between each type of symptom and alcohol use at time t and the occurrence of at least one incident of violence during the same period (violence at time t); the other set of models represented the lagged relationship between symptom levels, alcohol use, and the multiplicative interaction between each type of symptom and alcohol use at time t and the occurrence of at least one incident of violence during the subsequent period (violence at time t+1). Violence at time t was also included in these latter models to control for the effect of recent violence on future violence (
30). Each set of models tested affective and positive symptoms separately and together.
BPRS symptom-level scores, the five-level alcohol use variable, and interaction terms were initially tested as continuous variables in panel logistic models. [Tables concerning violence at time t and at time t+1 are included in an online supplement to this article at
ps.psychiatryonline.org.] In bivariate analyses, individuals consuming one to nine drinks in the week before the interview had the same odds of concurrent or lagged violence as individuals with no alcohol consumption, whereas participants consuming ten to 34 drinks, 35–69 drinks, or ≥70 drinks had significantly higher odds of violence than those with no alcohol consumption. In an alternative approach that allowed visualization of interaction term results, models were therefore constructed using categorization of the variables as follows: BPRS affect scores of <12 or ≥12 and alcohol use <10 drinks or ≥10 drinks per week. Both methods indicated the same patterns of statistical significance regarding affective symptoms. Due to nonlinearity of the relationship between positive symptoms and violence, additional analyses were performed, with BPRS positive symptom scores categorized as <8, 8–11, and ≥12, corresponding to mild, moderate, and marked levels of severity, respectively (
33).
Confirmatory subscale loadings of the 18-item BPRS were conducted for 1,136 participants in EQS, version 6.1. Descriptive analyses were conducted in SAS, version 9.2, and regression analyses were conducted in Stata SE, version 10 on each of the two mutually exclusive diagnostic groups.
Missing data in the selected sample
Twenty demographic and other baseline variables that were significant predictors of violence in the initial MacArthur study analyses were used to examine patterns of missing data. Student's t tests or chi square statistics were used to assess differences on these variables between participants present and missing at each time point within each diagnostic group.
Participants with depression who were missing at follow-up interviews differed significantly from those present (on more than two of 20 variables, or >10%), with differences generally in the direction expected for a higher risk of violence. Given that data were not missing at random, sensitivity analyses were performed within each diagnostic group to compare model differences among participants with at least one community follow-up; participants with no consecutive missed follow-ups; and participants present at all follow-ups. Although estimates differed in each of the above models, patterns of significance (at p<.05) were stable in models of affective symptoms and varied slightly in models of positive symptoms. Results are reported for participants who had at least one follow-up interview.
Results
Primary diagnosis at discharge
Of 1,136 participants in the MacArthur study, 688 (61%) had a primary diagnosis of either depression (N=443) or a psychotic disorder (N=245). Participants with no follow-up data (57 of 443 participants with depression [13%] and 44 of 245 participants with a psychotic disorder [18%]) were excluded from the analyses reported here. Participants with a psychotic disorder thus included 115 of 201 (57%) with schizophrenia and 55 of 201 (27%) with schizoaffective disorder. Of 386 remaining participants with depression, 152 (39%) also had a diagnosis of alcohol abuse or alcohol dependence, as did 67 (33%) of the 201 participants with a psychotic disorder.
Prevalence of violence overall and at each follow-up
Of the 587 participants included, 110 of 386 (29%) individuals with depression had at least one episode of violence in the year after discharge, compared with 32 of 201 (16%) individuals with a psychotic disorder (p<.001). The prevalence of violence in each follow-up period for each group is shown in
Table 1.
Study population
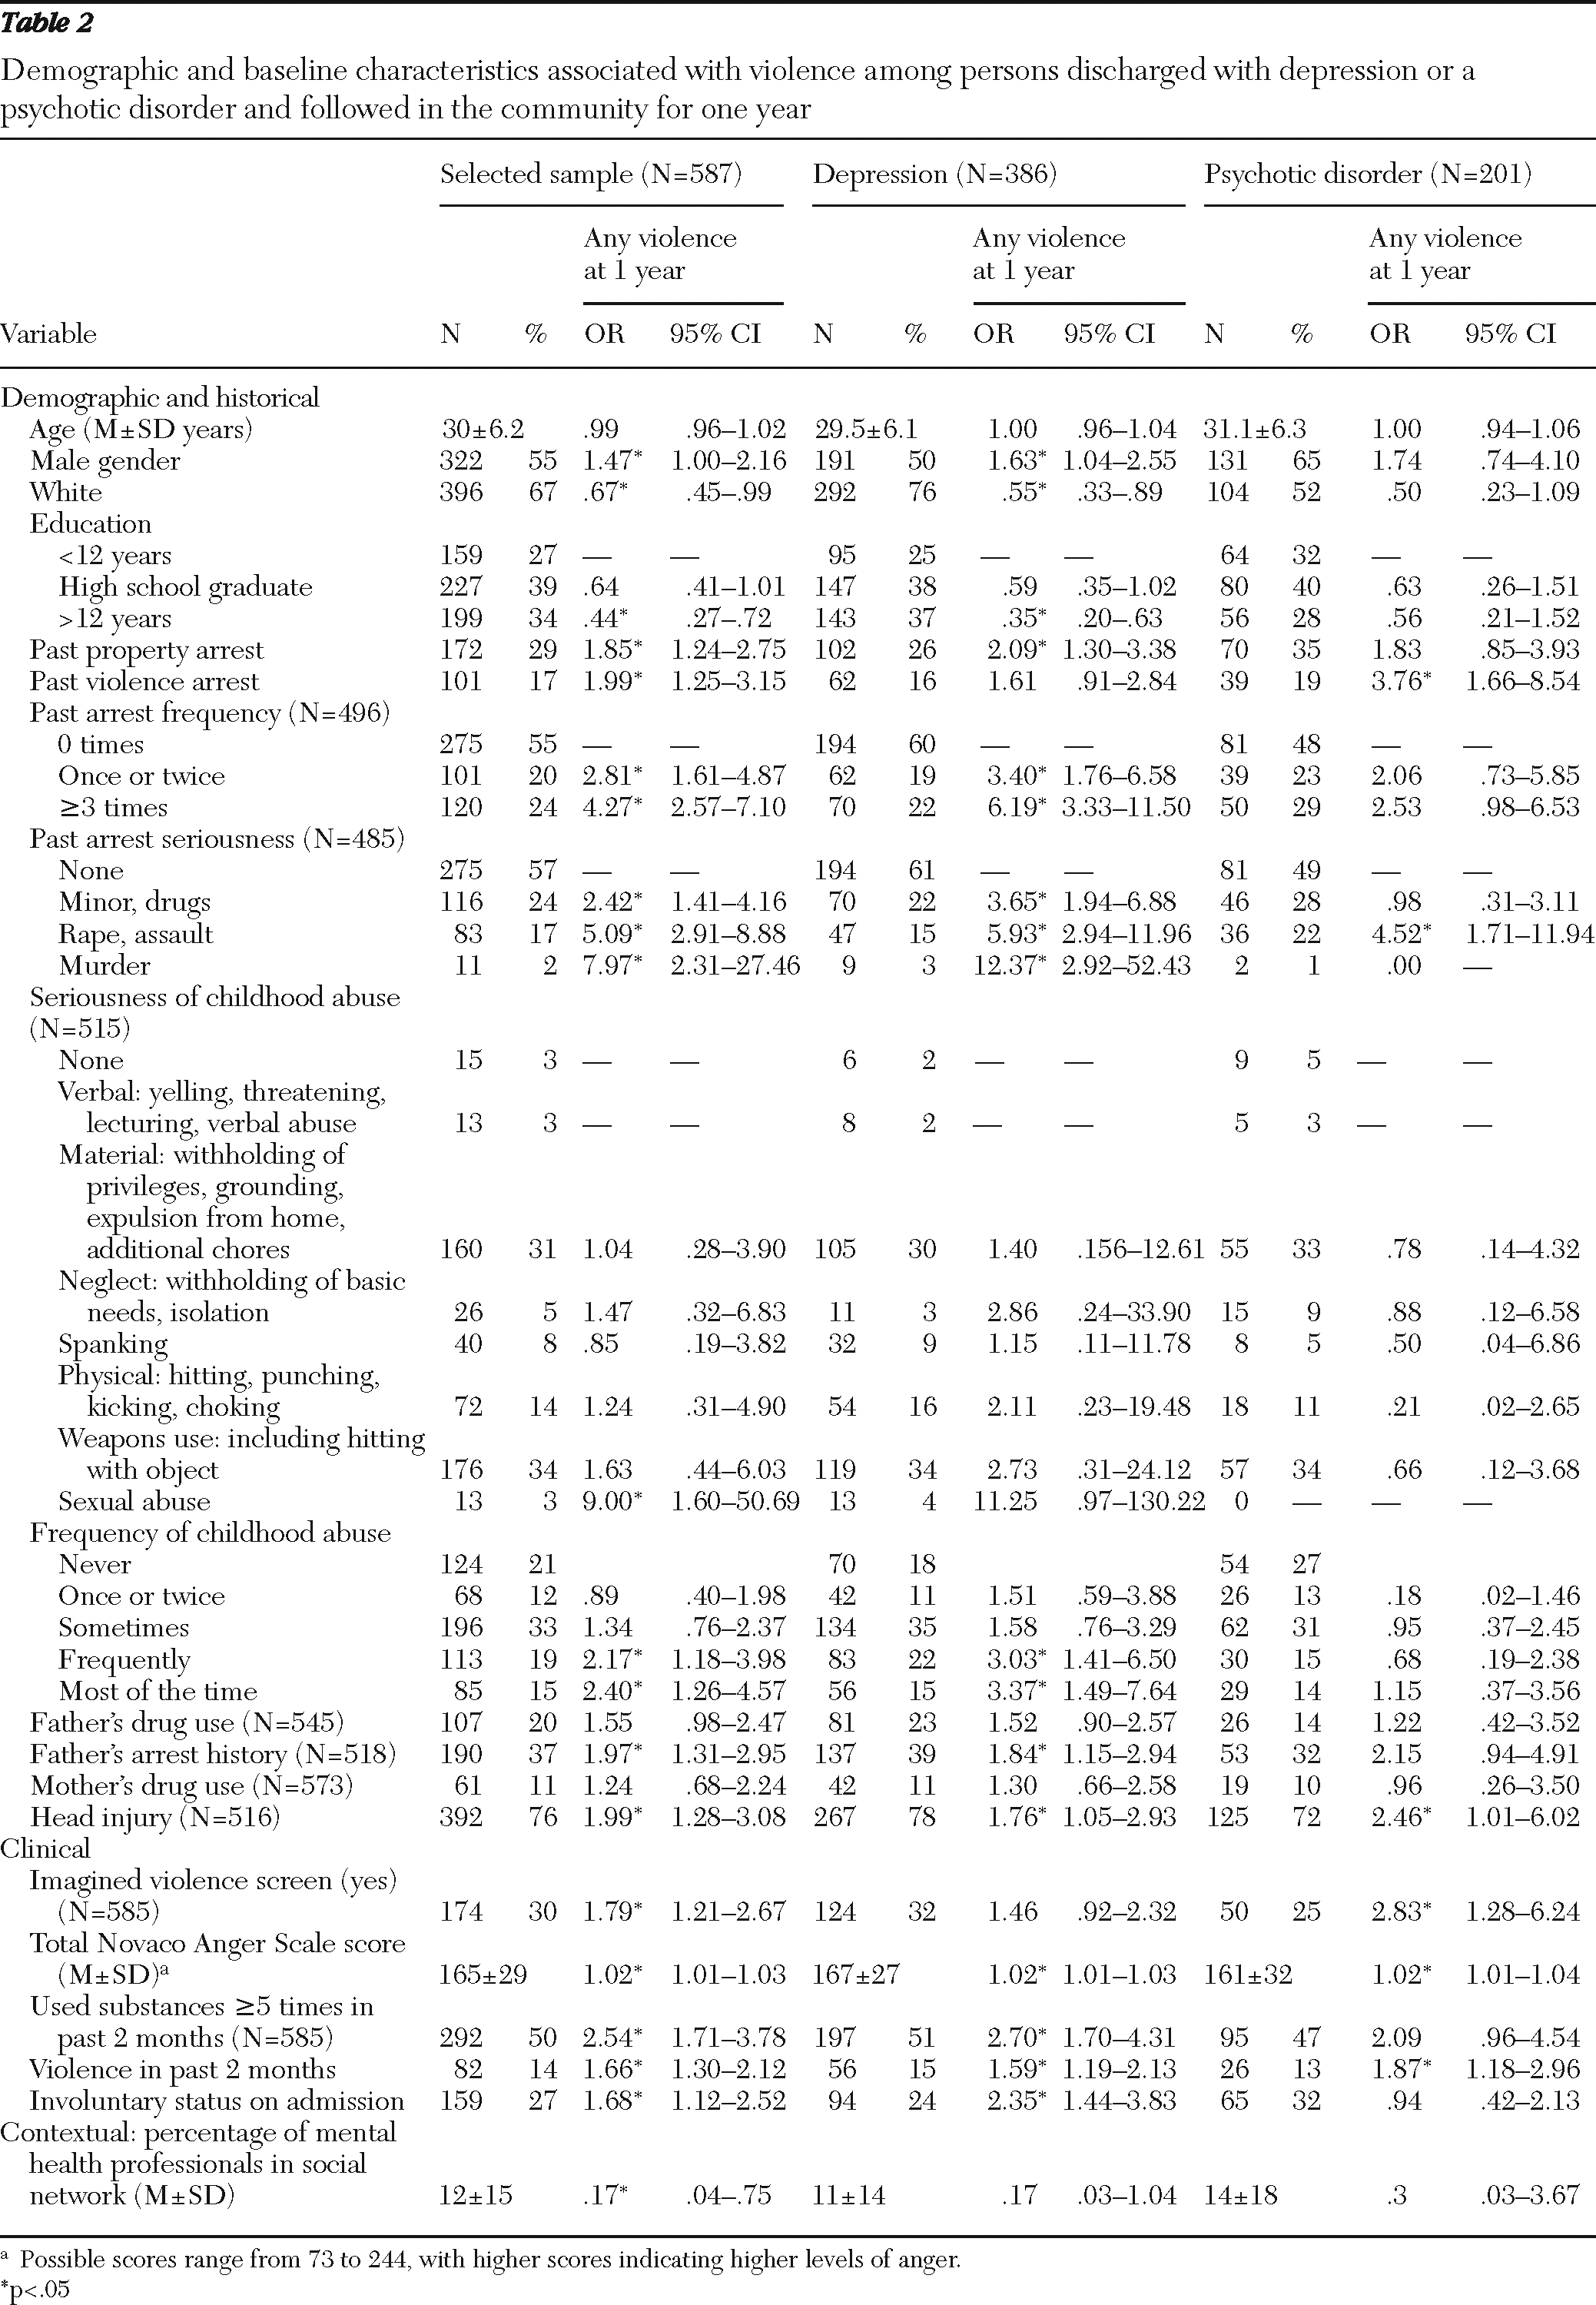
Participants with a primary diagnosis of depression were younger and more likely than those with a psychotic disorder to be white and female and to have more years of education. Demographic and other baseline information for the 587 participants in the analyses is shown in
Table 2.
Study variables
Participants with depression had higher mean±SD ratings on the BPRS affective subscale (10.7±5.0 on a scale of 4–28, with higher scores indicating more severe symptoms) than participants with a psychotic disorder (8.5±4.7). Participants with a psychotic disorder had higher ratings on the BPRS positive subscale (7.7±4.4 on a scale of 4–28, with higher scores indicating more severe symptoms) than participants with depression (5.0±2.1). Group differences were significant at p<.001. There was no significant group difference in amount of alcohol consumed.
Correlates of violence in a 10-week period
The presence or absence of a violent incident at time t and time t+1 and demographic variables (age and gender), affective and positive symptom scores, and alcohol levels were examined (not shown). Violence at time t and at time t+1 was significantly associated (p<.001) in each group of participants, and violence at time t was associated with the amount of alcohol consumed at time t (p<.001). Amount of alcohol consumed at time t was also significantly related to violence at time t+1 for both groups (p≤.001).
Multivariate panel logistic models
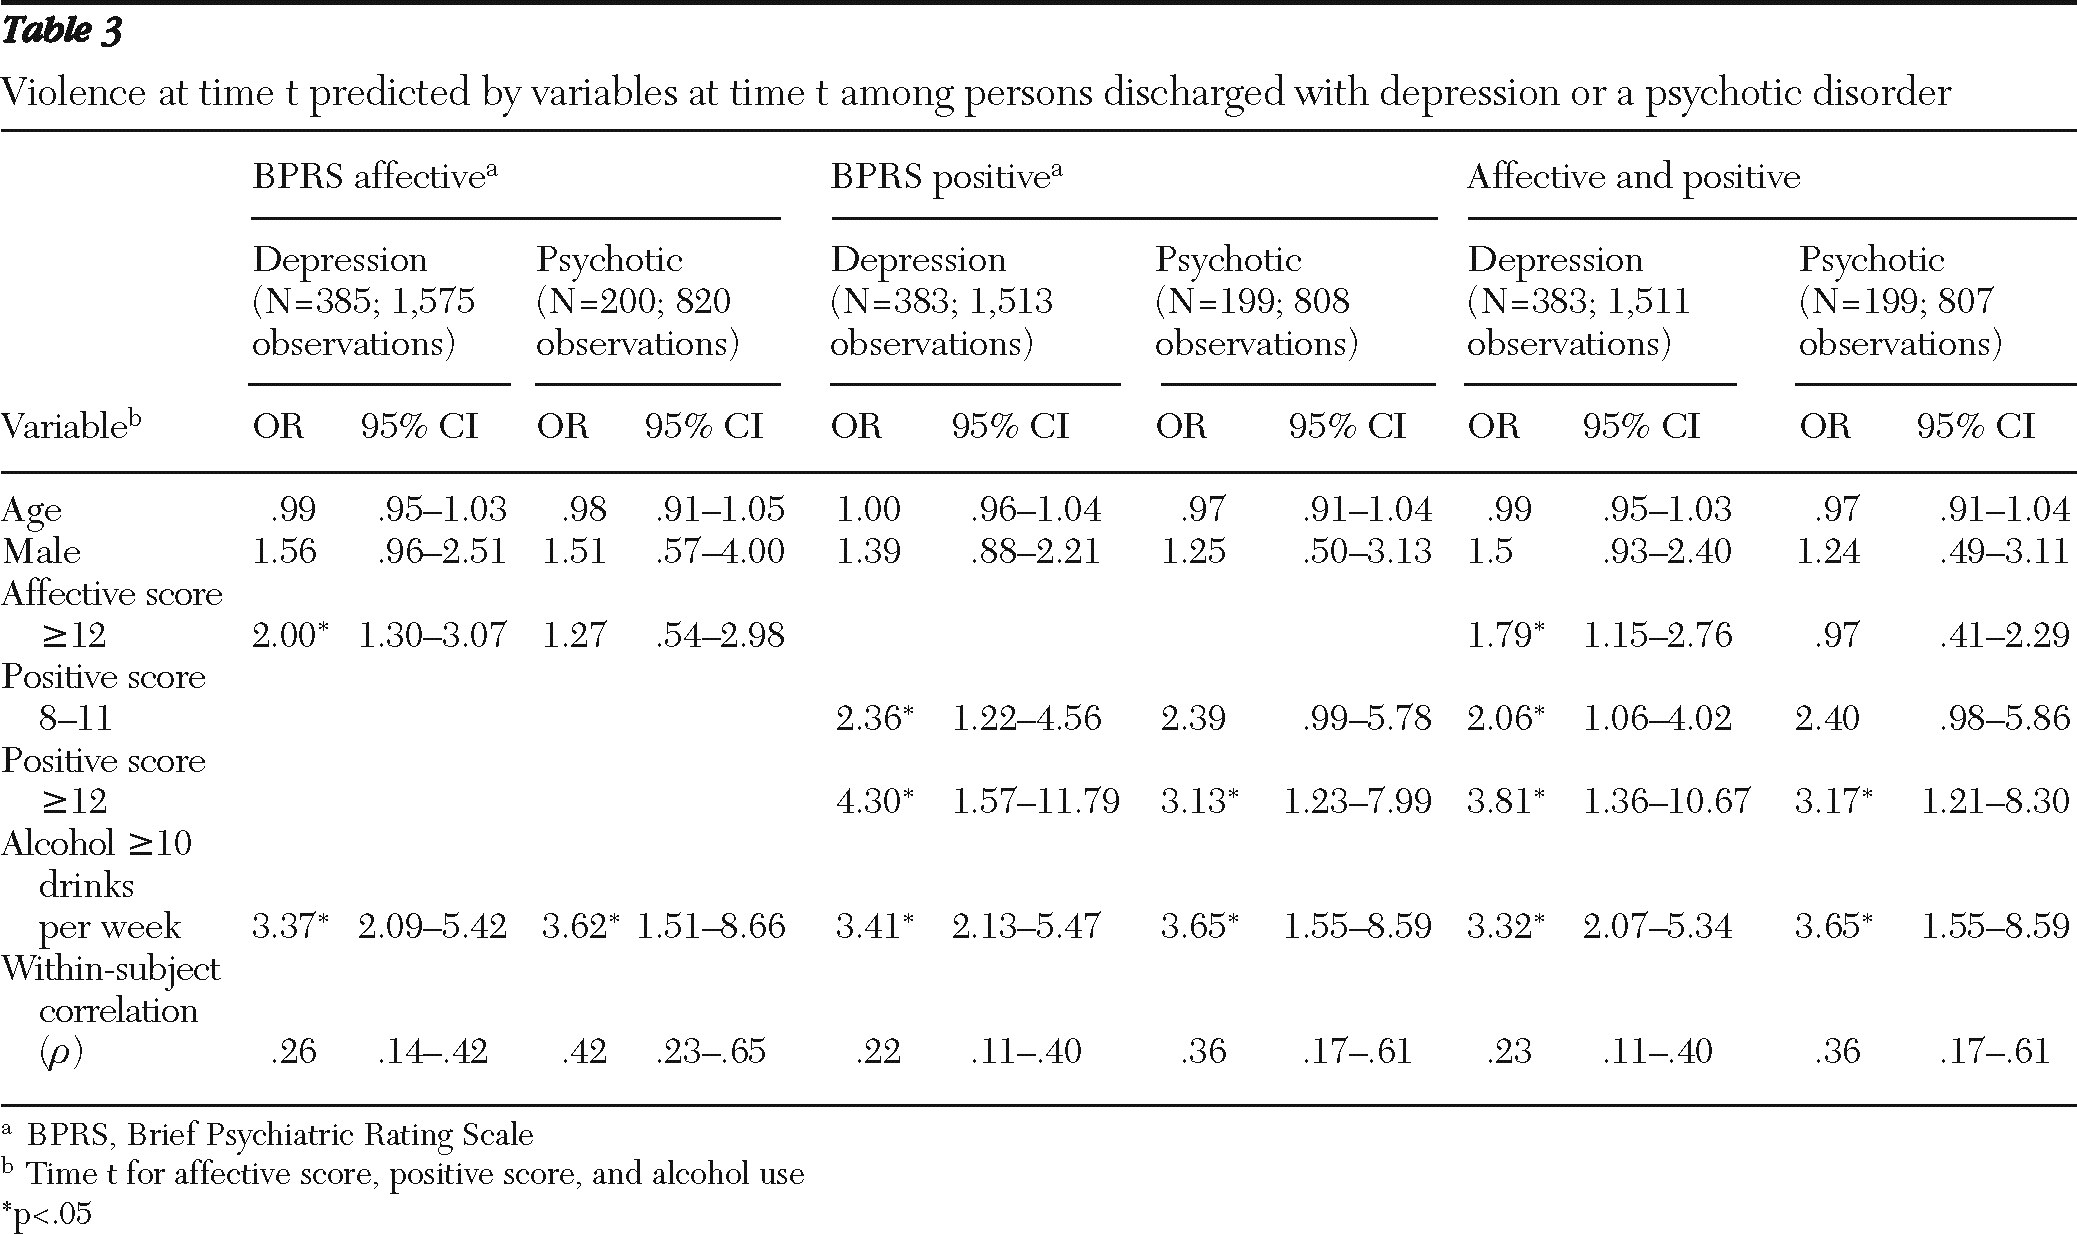
Panel logistic models using either continuous or categorized study variables both showed distinctive patterns in main effects for each diagnostic group. Among participants with depression, violence at time t was associated with both affective symptoms (odds ratio [OR]=1.07, SE=.03, 95% confidence interval [CI]=1.03–1.12) and positive symptoms (OR=1.23, SE=.06, CI=1.12–1.34) as well as with alcohol use (OR=1.55, SE=.14, CI=1.30–1.85) at time t. Among participants with a psychotic disorder, positive symptoms (OR=1.11, SE=.05, CI=1.03–1.21) and alcohol use (OR=1.58, SE=.26, CI=1.14–2.19) were associated with violence at time t. The interaction of symptoms and alcohol use was not significant in either group.
Table 3 shows results of analyses using the categorized variables, which mirror results using the continuous affective symptom variables.
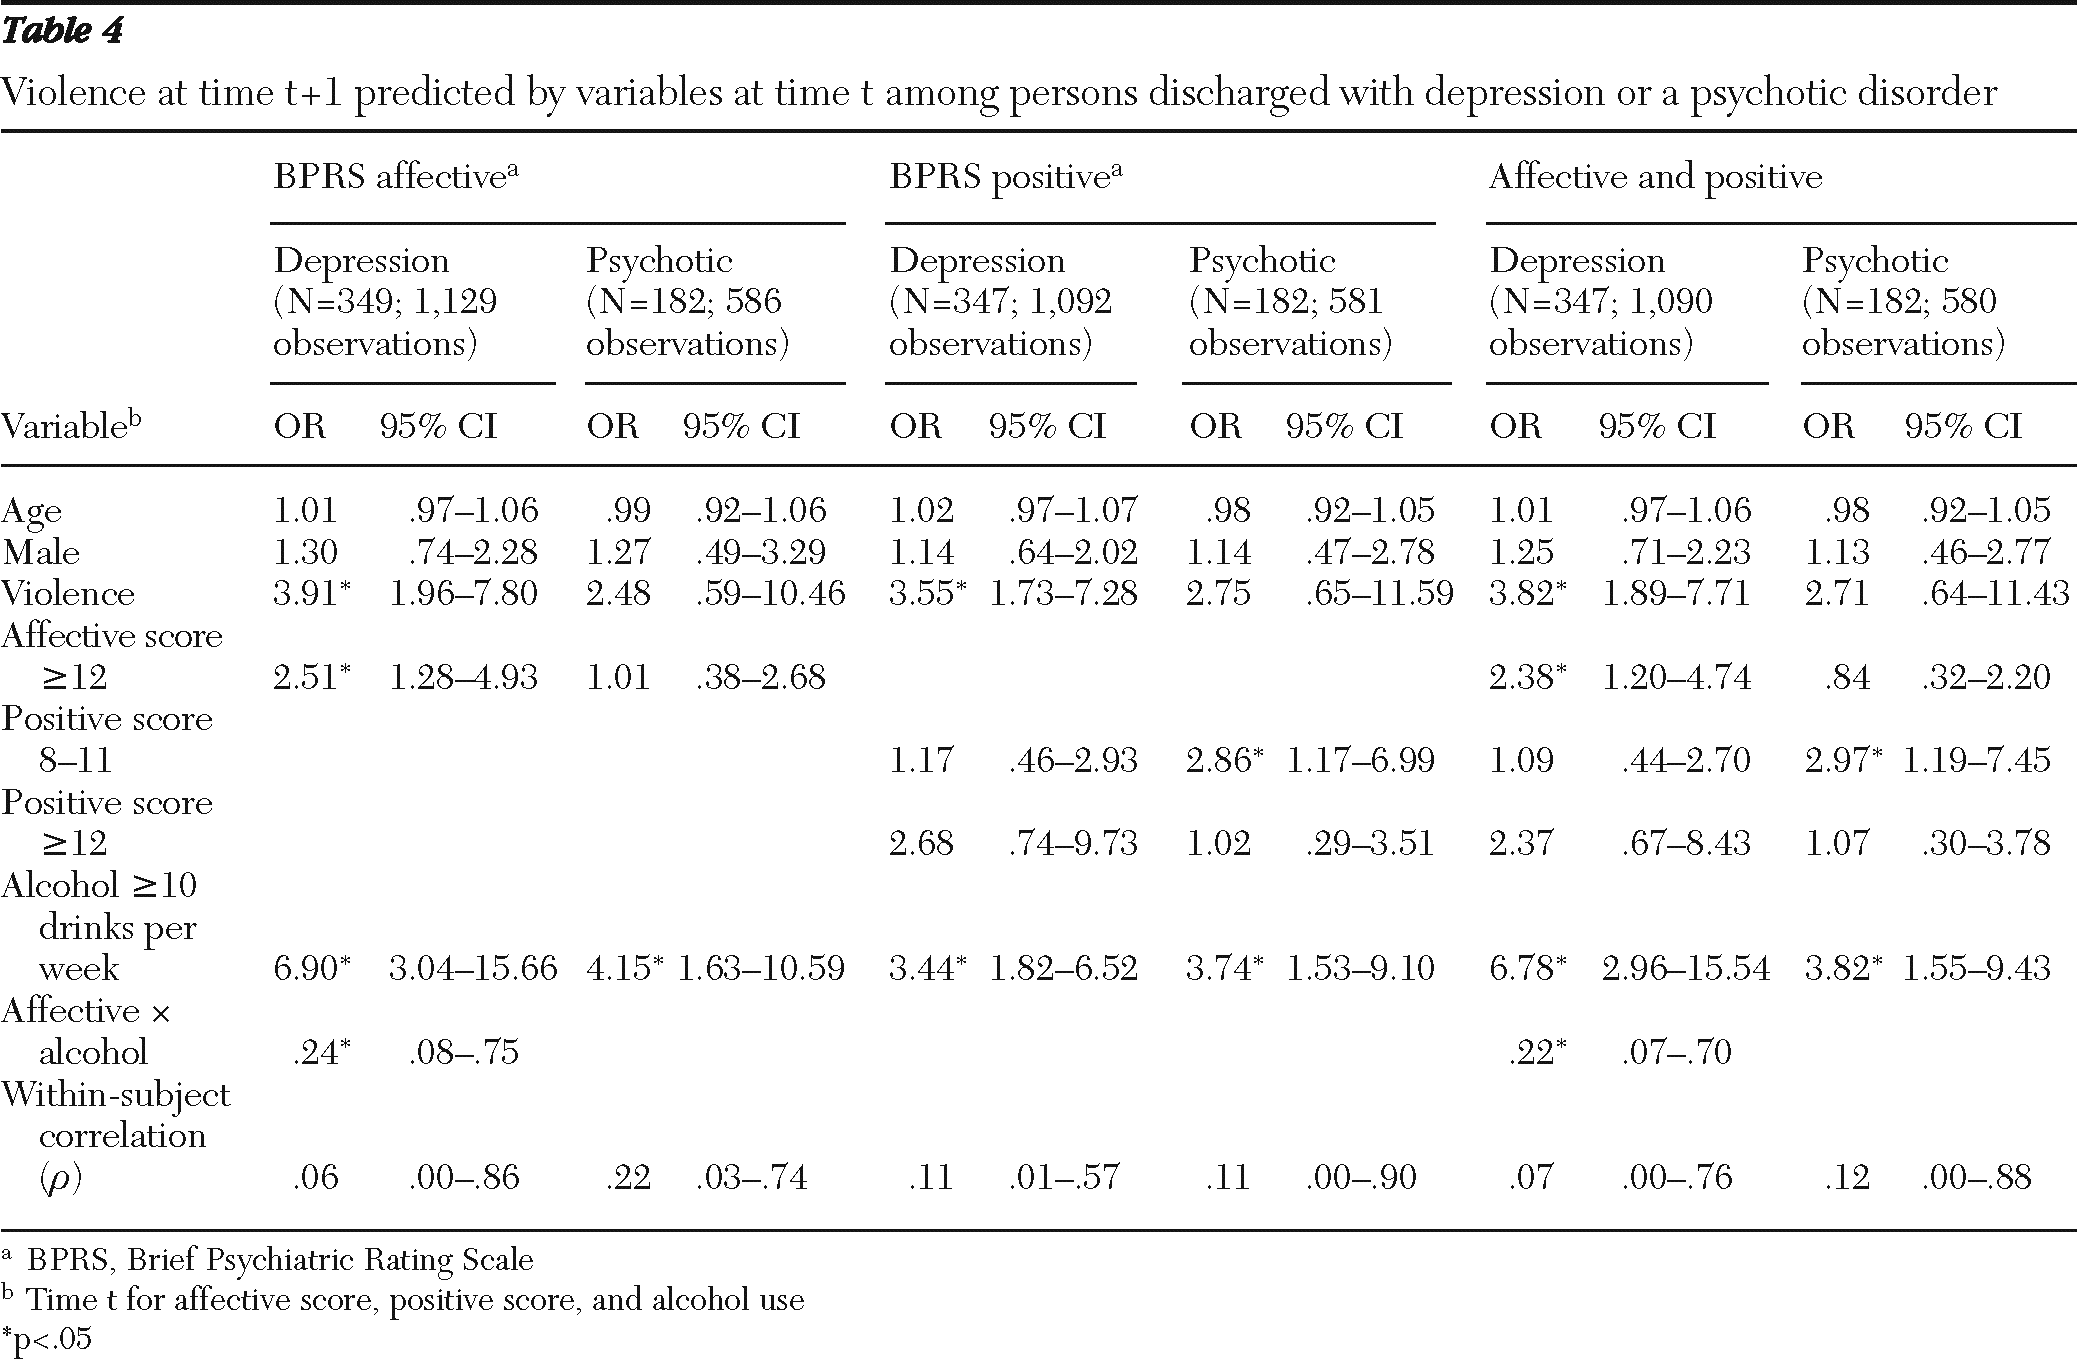
The panel logistic models showed different patterns for lagged effects. Among participants with depression, violence at time t+1 was associated with violence at time t (OR=3.51, SE=1.32, CI=1.68–7.34) and with affective symptoms (OR=1.08, SE=.04, CI=1.01–1.16) and alcohol use (OR=2.66, SE=.78, CI=1.50–4.73) at time t; there was a significant negative interaction of alcohol use and affective symptoms (OR=.95, SE=.02, CI=.91–.99). Among participants with psychotic disorders, violence at time t+1 was significantly associated with alcohol use only (OR=1.59, SE=.29, CI=1.11–2.28).
Table 4 shows results of analyses with the categorized variables. Among participants with depression, again, violence at time t+1 was associated with violence at time t and with high alcohol use and a high level of affective symptoms (BPRS affective score ≥12) at time t, with a significant negative (OR<1) interaction of alcohol use and affective symptoms. Among participants with psychotic disorders, however, violence at time t+1 was significantly associated with a moderate level (BPRS positive score 8–11) but not a high level (score ≥12) of positive symptoms and with alcohol use. Interaction terms between each symptom type and alcohol use were not significant for participants with a psychotic disorder.
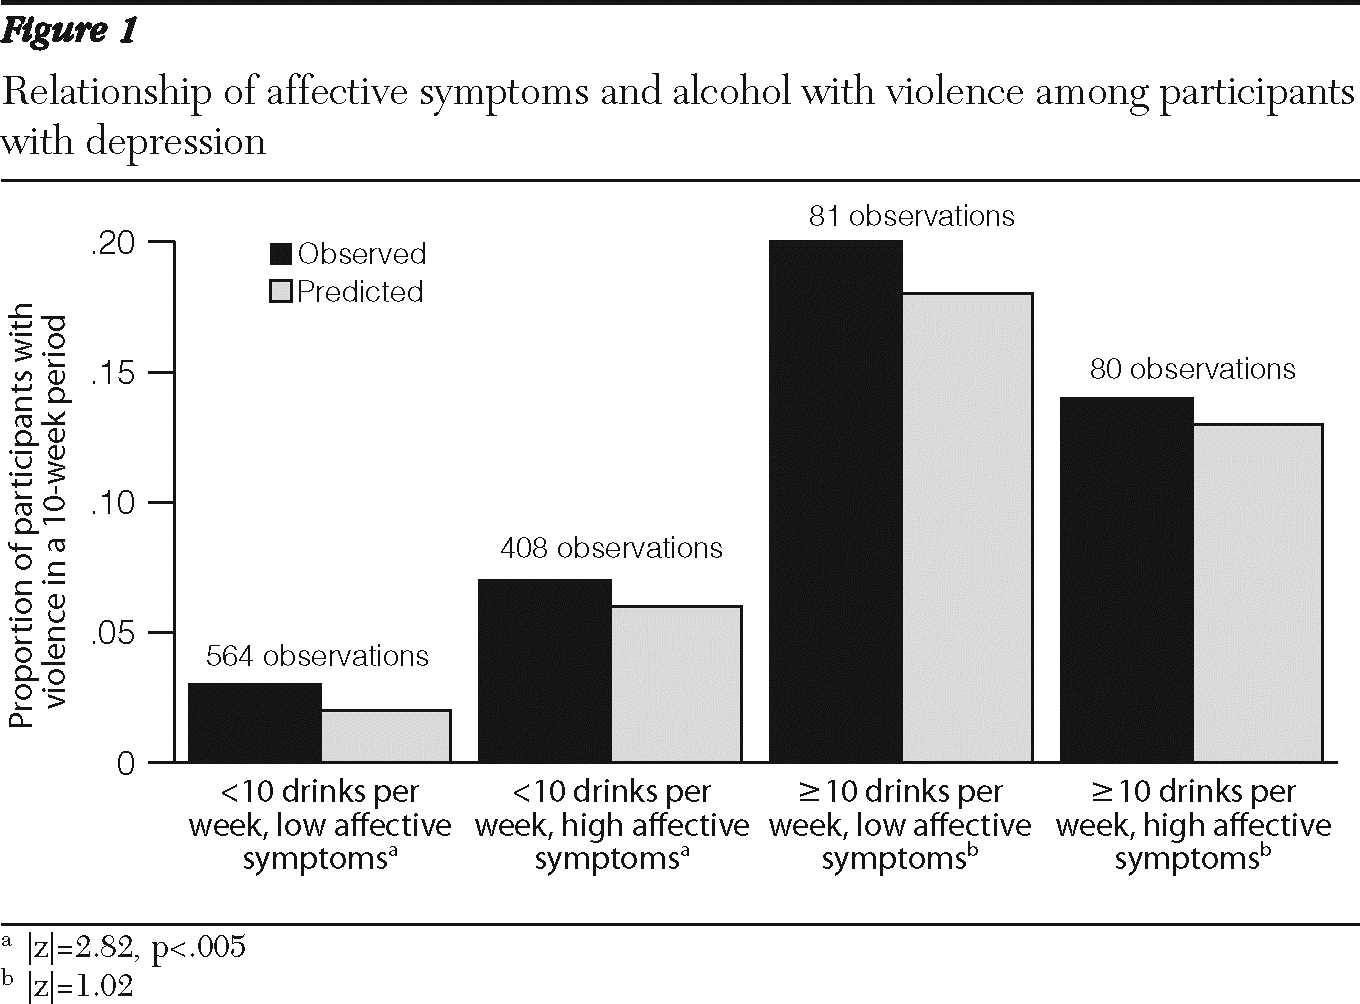
Figure 1 illustrates, with analyses using dichotomous variables, the consistently observed interaction between affective symptoms and alcohol use in relation to violence at time t+1 for participants with depression. Affective symptom levels had a significant effect on violence at low (but not at high) levels of alcohol use. Although there was a main effect for alcohol use, the difference between the low and high affective symptom classes was significant only at a lower level of drinking (p<.005).
Figure 1 thus shows that for participants with depression and low alcohol use, affective symptoms were associated with an increased probability of violence, and higher levels of alcohol use were associated with violence at any affective symptom level. A negative multiplicative interaction term indicates here that although alcohol use and affective symptoms each increased the risk of violence, together they increased risk less than alcohol alone in this diagnostic group (
34).
Discussion
In this study, affective symptoms and alcohol use were associated with concurrent and future violence of participants with depression. The relationship of positive symptoms and alcohol use to violence of participants with a psychotic disorder was less evident. There was a significant negative interaction between affective symptoms and alcohol use as predictors of subsequent violence of participants with depression, and there was no appreciable interaction between alcohol use and either type of symptom for participants with a psychotic disorder.
Recent past violence (within the past ten weeks) was a strong predictor of violence by participants with depression, but not by participants with a psychotic disorder. This suggests that the adage indicating past violence as the best predictor of future violence (
2) may not hold equally across diagnostic groups, at least in the relatively short interval of a ten-week follow-up period. The finding within this time frame is nonetheless most relevant for ongoing clinical management and attention to violence risk in different diagnostic groups. Wide confidence intervals for the participants with a psychotic disorder resulted from a low rate of violence in this group. Although positive symptom findings are somewhat consistent with previous large cross-sectional studies (
21,
35), the effect of recent prior violence in this sample of participants with a psychotic disorder is inconclusive.
Substance use has been consistently and strongly associated with violence (
8,
36), but evidence about the dynamics of this link is still limited (
30). Prior studies of violence demonstrated a moderate association between a diagnosis of a mental disorder and violence and an elevated risk when associated with a co-occurring substance use disorder (
8,
11,
21,
37). Our findings suggest further that dimensions of symptoms and the amount of alcohol use are also salient to dynamic risk of violence, perhaps more so than categorical diagnoses.
Our focus in this study on affective symptoms of depression and positive symptoms of psychosis was guided by a primary aim of examining specific effects within diagnostic groups. Many of the anergic symptoms of depression, such as blunted affect, social isolation, and psychomotor slowing, are represented in another subscale of the BPRS, but we did not test this subscale because these symptoms overlap with negative symptoms of psychosis (
38). Furthermore, our analyses did not test the effects of participants' medication or adherence to it. Alcohol may, for instance, increase the sedating effects of antipsychotic medication, thus decreasing the individual's propensity for aggression in social situations. These findings thus point to future investigations of violence risk of patients with depression, to examine additional variables (such as anergic symptoms, childhood antisocial conduct, and medication compliance), previously characterized in studies focused on patients with schizophrenia (
35,
39,
40).
Two caveats should be noted regarding time course. First, prior studies on the larger MacArthur Violence Risk Study sample demonstrated that adjusting for time at risk does not significantly affect the risk estimates (
2). There was, however, an overall pattern of decreased rates of violence over the one-year study period for participants with depression, suggesting that factors relating to this decrease would be useful to examine. Second, although a ten-week interval is reasonable for examining clinically significant change in the evolution of primary psychiatric symptoms in specific diagnoses, the interval is long for studying effects of alcohol (
30). Further characterization of a relationship between symptom fluctuation and alcohol use would require a fine-grained analysis using repeated measures at shorter intervals.
Conclusions
The results of this study suggest that violence risk among patients with psychotic disorders may function in a substantially different manner from the way it unfolds among patients with depression, in terms of both predictors and mechanisms. We selected two groups characterized by distinctive symptoms in order to contrast the effects within diagnostic categories. Examining a larger array of symptoms and how they map onto a set of other diagnoses, such as bipolar disorder or personality disorders, merits further study. Our results indicate that examination of the relationship between symptoms and violence across broad samples of patients does not appear sufficiently nuanced to give us clinically useful tests of this phenomenon. More appropriate tests require conditional assessment of different symptom types in the context of the individual's disorder.
Whereas suicide risk is routinely assessed with particular vigilance in clinical practice with depressed patients, their risk of harm to others is less commonly the focus of assessment and treatment. Our findings suggest that affective symptoms are associated with risk of harm to others and that this risk is further increased when patients with depression use alcohol. Just as we regularly assess suicidality with a focused aim of prevention in this population, increased attention to the assessment of violence risk associated with depression may afford an additional opportunity for prevention and improvement of quality of life.
Acknowledgments and disclosures
During the preparation of the manuscript, Dr. Yang was supported by grant T32 MH16804 from the National Institute of Mental Health and by the U.S. Department of Veterans Affairs (VA), Office of Academic Affiliations, Advanced Fellowship Program in Mental Illness Research and Treatment. Contents do not represent the views of the VA or the U.S. government. Dr. Yang thanks Kevin Kim, Ph.D., Candice Odgers, Ph.D., and Ada Youk, Ph.D., for valuable advice during data analysis and Bruno Falissard, M.D., Ph.D., for insightful comments on the manuscript.
Dr. Mulvey is a shareholder in COVR, Inc., which distributes Classification of Violence Risk (COVR) through Psychological Assessment Resources, Inc. The other authors report no competing interests.
