During the past 30 years, special education has expanded from a small set of programs in a few states to a national program providing services to students throughout the country (
1). Passage of the Education of All Handicapped Children Act in 1975 (PL 94–142), and later the Individuals With Disabilities Act (IDEA), transformed U.S. special education programs by establishing the right of all students with disabilities to a free and appropriate public education. Under the IDEA, children may receive special education services if a determination is made that the child has one of 13 conditions (autism, blindness, deafness, emotional disturbance, hearing impairment, intellectual disability, multiple disabilities, orthopedic impairment, other health impairment, specific learning disability, speech or language impairment, traumatic brain injury, and visual impairment) and it is shown that the condition adversely affects the child’s educational performance (
2). Much of what is known about the trends in special education and for specific disabilities, such as autism and specific learning disabilities, is based on the reports of the U.S. Department of Education Office of Special Education Programs (
3–
5).
Less frequently used sources of information about children enrolled in special education are household surveys, such as the National Health Interview Survey (NHIS). Since the redesign of this survey in 1997, the NHIS has included questions about activity limitations, including special education use and health conditions perceived to cause these limitations. In the NHIS, parents are asked to select from 13 conditions that may be causing their child’s limitations. Over 90% of children with an activity limitation are identified only by their use of special education (
6). The 13 conditions listed in the NHIS are as follows: vision or sight problem; hearing problem; speech problem; asthma or other breathing problem; birth defect; injury; intellectual disability; other developmental problem; other mental, emotional, or behavioral problem; bone, joint, or muscle problem; epilepsy or seizures; learning disability; and attention-deficit hyperactivity disorder (ADHD).
Using information from the 2001–2012 NHIS, we analyzed parent-reported data to describe the trend in the use of special education services and to examine trends in conditions reportedly causing activity limitations among children receiving special education.
Methods
For this study, we used data from the 2001–2012 NHIS, a cross-sectional in-person household survey of the civilian noninstitutionalized U.S. population conducted continuously since 1957 by the National Center for Health Statistics (NCHS). A knowledgeable family adult, usually a parent, responds for any children (persons <18 years of age) in the family; a child’s proxy respondent is referred to in this report as the child’s parent. The family response rate between 2001 and 2012 was 82% (
7). The analytic sample for this study included children ages 6–17 who had information about the current use of special education services (N=182,998).
Between 2001 and 2012, less than .5% of children were excluded due to a lack of information about the use of special education services. The item nonresponse rate for the other variables included in the analysis was less than 2%−3%, except in the case of family income. Family income was missing for 19%−30% of the families with children in the 2001–2012 NHIS. Multiply imputed values for this missing information were used in the analysis (
8).
Current use of special education services was identified by responses to the following question, “Do any of these family members (children less than age 18) receive special educational services?” Health conditions limiting a child’s activity were reported by parents of children using special education. These conditions were identified by providing respondents with a card with selected health conditions and asking them to indicate which conditions caused the child’s limitation. The respondents were asked, “What conditions or health problems cause the child’s limitations?” The card given to the respondent included 13 categories of health conditions. The respondent could select more than one health condition as the cause of the child’s limitations. Because of the small number of children in several categories, the health conditions were regrouped into seven categories for this analysis: sensory problem (vision or hearing), speech problem, asthma or breathing problem, intellectual disability or other developmental problem, emotional or behavioral problem (including ADHD), learning disability, and all other health problems (epilepsy or seizure; bone, joint, or muscle problem; injury; or birth defect).
To account for the complex sampling design of the NHIS, the analysis was performed with SAS-callable SUDAAN software, version 11.0 (
9). Analyses were based on weighted data and are representative of the U.S. noninstitutionalized population ages 6–17 years. The Taylor series linearization method was chosen for variance estimation. All estimates shown in this analysis have a relative standard error ≤30%. The significance of trends was tested with weighted least-squares regression models of the log of each outcome and Joinpoint software to determine whether an apparent change over time was statistically significant (p<.05), with the standard error for each data point accounted for (
10).
Results
Between 2001 and 2012, the percentage of children ages 6–17 who were using special education services increased from 7.2% to 8.7%, at an average annual rate of 1.8%. Increases in use were observed among boys (from 9.5% to 11.4%) and girls (from 4.9% to 6.0%) as well as among children ages 6–11 (from 7.4% to 9.5%) and children ages 12–17 (from 7.0% to 8.2%). Use of special education services was higher for boys than for girls in each year.
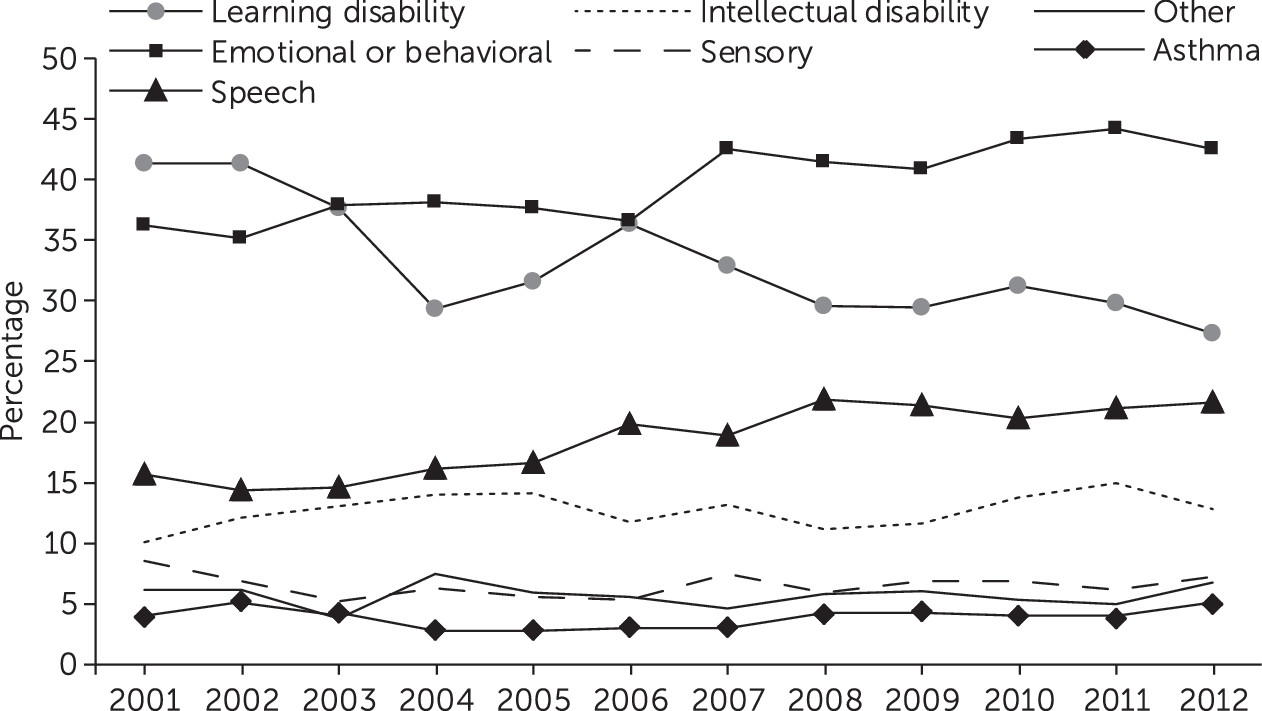
During 2001–2012, learning disability, emotional or behavioral problems (including ADHD), and speech problems were consistently the most frequently mentioned health conditions associated with use of special education services (
Figure 1). Learning disability showed a significant decrease as a cause of limitations, decreasing from 41% of the children in 2001 to 27% in 2012. Emotional or behavioral problems (including ADHD), in contrast, increased significantly over the period, increasing from 36% of the children in 2001 to 43% in 2012. The upward trend was observed among children whose parent reported ADHD and children whose parent reported other types of emotional or behavioral problems (data not shown). Reports of speech problems as a cause of limitations increased significantly, from 16% in 2001 to 22% in 2012. In regard to the other categories of conditions, there were no significant trends. Between 2001 and 2012, more than 75% of the children in special education had a report of only one condition causing limitations (data not shown).
Discussion
Between 2001 and 2012, there were significant and contrasting trends in the three most frequently mentioned health conditions associated with limitations in the activities of children receiving special education services. A decreasing percentage of children had a parent report of learning disability as a condition associated with limitations, and an increasing percentage had reports of emotional or behavioral problems (including ADHD) and speech problems as sources of limitations. No significant trends were observed in parent reports for the other categories of health conditions—intellectual disability or other developmental problem, sensory impairments, asthma or breathing problem, or for the category other health problems. These changes occurred during a decade when the population of children using special education services increased at an average annual rate of 1.8%.
In the NHIS, parents of children receiving special education services were asked to identify the health conditions causing the child’s activity limitations. More than one condition could be listed. These conditions did not necessarily include the condition that qualified the child for special education services, but in many cases, one of the conditions associated with the child’s limitations was the disability that qualified the child for special education services. Consistent with our finding of a downward trend in the percentage of children with a learning disability reported as a cause of activity limitations, administrative data collected by special education programs throughout the country have also shown a downward trend in the percentage of children receiving special education services because of specific learning disabilities (
11). Between 2000–2001 and 2009–2010, the percentage of students ages 6–21 receiving special education services who qualified because of specific learning disabilities declined from 46% to 38%.
Our finding that over 40% of the children receiving special education services in 2012 had limitations caused by emotional or behavioral problems is one that is not reflected in administrative data. Several educational researchers have noted that special education enrollment for emotional disturbance underestimates the prevalence of emotional and behavioral problems among children receiving special education services (
12,
13). However, some children with emotional or behavioral problems may receive services under other disability categories.
In regard to trends, parent reports in the NHIS indicated an increase in the percentage of children in special education with limitations associated with ADHD and an increase in the percentage with other types of emotional and behavioral problems (data not shown). In contrast, trends in administrative data have shown no increase in the percentage of students with emotional disturbance. However, the percentage of students with other health impairments (OHI) more than doubled, from 5% to 11% between 2000–2001 and 2009–2010 (
11). Several researchers have speculated that this rise has been due to the inclusion of students with ADHD in the OHI category (
5,
14). A comparison of data from administrative records and findings from our study suggest that parent reports in surveys provide information about the disabling conditions of children in special education programs that is currently not available in administrative records.
Limitations of the data used in this analysis need to be noted. The estimates of the number of children receiving special education services based on parent reports may underestimate the use of these services (
15). In addition, the categories of health conditions offered to parents as possible causes for limitations overlap with but differ from the categories of health conditions in administrative data. Finally, the NHIS sample covers the noninstitutionalized population and does not include the small percentage of children who are institutionalized (.2%); some of these children may also receive special education services.
A major strength of this study was that the NHIS includes consistently collected data that describe trends in the use of special education services and the health conditions reportedly causing activity limitation for a large nationally representative sample of children. Because parents could list more than one causal condition, the NHIS data provide a complex picture of the causes of activity limitations of children receiving special education. This contrasts with administrative data that classify students solely on the basis of a single condition identified as the primary disability qualifying the child for special education.
Conclusions
This study found that emotional and behavioral problems have become the most frequently reported cause of activity limitation of children in special education. Household surveys are a valuable source of information which can supplement the data available from administrative records about the general medical and mental health conditions of children receiving special education.


