Two basic approaches to tackle public stigma toward mental illness have emerged: education (in which myths about mental illness are contrasted with facts) and contact (in which members of the public interact with people in recovery) (
1). Results of a meta-analysis showed that both education and contact were associated with mean effect sizes that differed significantly from zero for overall measures of stigma and assessment of attitudes (
2). Additional analyses showed that among adults, contact had significantly greater effects on attitudes compared with education. However, there were no differences between contact and education on overall effect on stigma. These analyses represented effect sizes that were calculated on the basis of assessments conducted before and after an intervention (pre-post comparisons).
Equally important is whether the effects were maintained over time. This study analyzed data from the earlier meta-analysis to examine the effects of education and contact on stigma at follow-up. Given pre-post analyses, we expected education and contact to yield significant effect sizes for both an overall index as well as a measure of attitudes. We also expected that the type of intervention would be associated with a significant difference in attitudes but not in overall effects.
Methods
Procedures and analytic strategies for the meta-analysis were described fully elsewhere (
2). Briefly, the Guidelines for Systematic Reviews in Health Care (
3) were used to review the literature published before October 2010 for unduplicated abstracts (N=8,744) from studies of interventions to reduce stigma related to mental illness, yielding 72 complete reports. Studies were coded for demographic characteristics of research participants, type of stigma change program (contact or education), outcome measures, and moderating variables.
Education was defined as a didactic enterprise in which myths about mental illness—for example, people are responsible for their serious mental illness—are contrasted with facts—for example, most serious mental illnesses are the result of some biological vulnerability. Examples included classroom-based or one-to-one sessions that use PowerPoint software or other audiovisual materials to present data that dispel myths.
Contact was defined as face-to-face interactions with people who tell their stories of recovery from mental illness. Key to coding an intervention as contact was having a person with lived experience tell his or her story to research participants in group or individual settings.
We coded outcome measures as attitudes, for example, perceptions of dangerousness or incompetence or attributing blame or responsibility for a mental health condition; affect, for example, pity, anger, or fear; or behavioral intention, for example, avoid, coerce, or segregate. Design quality was assessed by coding studies for use of randomization, manualized education or contact conditions, training by use of manuals, and fidelity ratings.
Effect sizes were determined for attitudes, affect, and behavioral intention plus a mean overall effect (combining all outcome measures). Two independent raters were reliable coders of the studies (κ=.94). Given that there were multiple measures, these reports produced 612 effect sizes. Only 19 of the 72 studies measured variables at follow-up time points, resulting in a total sample size of 25,361. This sample size resulted in a total of 233 effect sizes because we computed separate effect sizes for multiple outcome measures from each study. There were insufficient effect sizes for follow-up of affect and behavioral intention, so the analyses described in this report focused solely on overall effect and attitudes.
Among the research participants, 58.9% were females, the mean±SD age was 20.00±4.25 years, 12.1% were African Americans, 12.1% were Asian Americans, 49.0% were European Americans, 13.9% were Hispanic or Latino, and 13.9% were from other racial-ethnic groups. The studies represented a variety of populations, including adolescents (24%), college students (25%), and nonstudent adults (51%). In terms of education, .2% had less than a high school education, 12% had a high school diploma or GED, 55.4% had some college, and 6.9% had a college degree.
The effect size used in this study was the standardized mean difference (
4) comparing the mean of those who received the intervention versus a contrast condition, divided by the within-group standard deviation of scores. Effect sizes were scaled so that a positive effect size would indicate less stigmatizing attitudes among those who received the intervention. Data were obtained from a variety of research designs, so effect sizes were computed by using all available information. Studies were included in the meta-analysis if an education or contact condition was compared with either a control group or a pretest. A majority of effect sizes included both a control group and a pretest (51%), whereas 38% did not include a control group, and 10% had no pretest. In order to enhance comparability across designs, effect sizes from studies with no control group were adjusted for the average level of change observed in control groups (
5). Effect sizes were computed from means and standard deviations if such data were available. In other cases, effect sizes were computed from available statistics (for example, t or F) or p values by using formulas appropriate to each research design (
5).
A few studies included more than one treatment condition. A separate effect size was computed for each intervention that met inclusion criteria. If the conditions represented different types of intervention, the effect sizes for each intervention were included. If they represented the same type of intervention, the effect sizes were averaged to produce a single effect size for type of intervention. Many studies included multiple outcome measures. Variables representing distinct outcome constructs were maintained as separate effect sizes. Multiple measures of the same construct were included as separate effect sizes for subsequent analyses. A random-effects meta-analysis was conducted by using restricted maximum likelihood estimation. Homogeneity statistics were determined to assess consistency with the distribution of effect sizes (Qw). Comparisons between effect sizes were conducted by using a weighted one-way analysis of variance (ANOVA) from the SPSS macro MetaF (
6).
Results
Analyses of study designs showed that 26.3% of studies used randomization, 31.4% used a manual to guide the intervention, and 35.3% used a manual during training. None of the studies assessed fidelity. There were insufficient numbers of randomized controlled trials (RCTs) to compare effect sizes between RCTs and studies that were not RCTs. However, in the meta-analysis of 72 studies, pre-post comparisons indicated that the patterns of effect sizes were similar among the RCTs and studies with other designs.
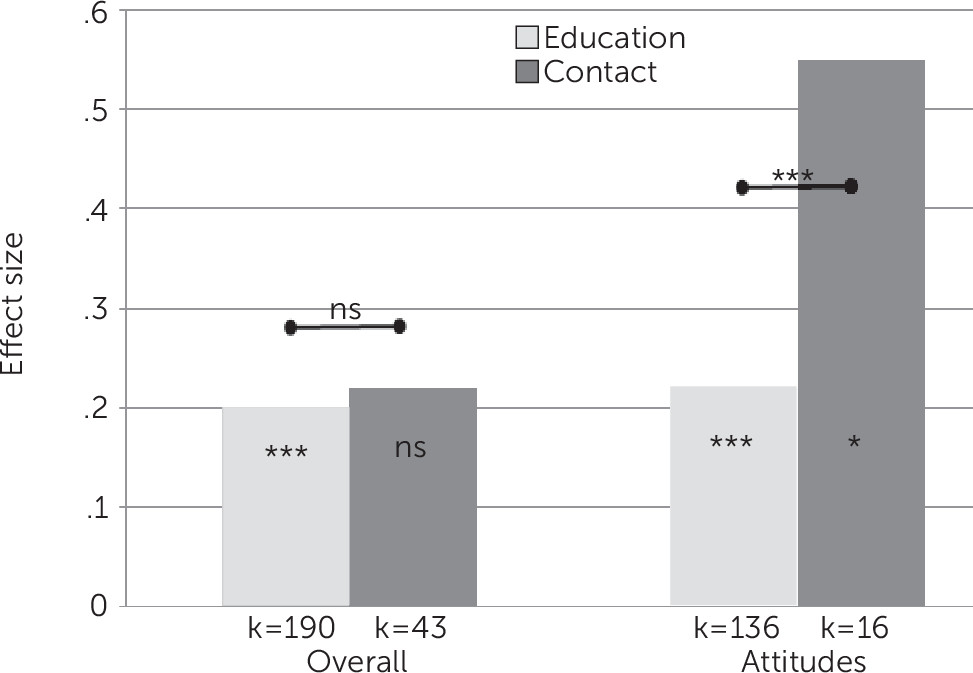
Mean effect sizes for overall effect and attitudes associated with interventions providing education or contact are summarized in
Figure 1. Far more studies of education (k=190 effect sizes) included follow-up compared with studies of contact (k=43). Homogeneity of distributions of effect sizes was mixed. For education interventions, the distribution of effect sizes for overall stigma and attitudes was consistent across studies. For contact interventions, the distribution of effect sizes was heterogeneous for both overall stigma (Qw=88.5, p<.001) and attitude (Qw=93.2; p<.001).
For education, mean effect sizes significantly differed from zero for both overall effects (d=.20) and attitudes (d=.22) (p<.001). Cohen (
6) defined effect sizes as negligible (d<.10), small (d=.10–.30), medium (d=.30–.50), and large (d>.50). Education effect sizes were in the small range.
For contact, mean effect sizes were significantly different from zero for attitudes (d=.55) (p<.05) but not for overall stigma. The size of the effect was small for overall stigma but large for attitudes. Results of a weighted one-way ANOVA did not yield a significant difference in d values for overall effects for the two intervention types; however, the effect size for attitudes was significantly greater for contact than for education (Q=13.6, p<.001).
Number of days defining follow-up varied greatly across studies. These values were positively skewed (skewness=6.5), with a mean of 330±936 days between posttest and follow-up (median=45 days). The follow-up periods ranged from one week to 3,285 days. It seems reasonable to conclude that the longer the period between the posttest and the follow-up, the less effect the intervention will have. However, correlational analyses using Spearman’s rho failed to find an association between time of follow-up and effect size for overall effects and attitudes.
Discussion
Do immediate benefits of antistigma programs persist over time? An audit of studies in our meta-analysis showed that 26.4% included measures of follow-up to answer that question. Results reflected some of the findings from our earlier analyses. Consistent with the pre-post finding of the meta-analysis, effect sizes for overall effects were significantly different from zero as a result of education programs, indicating an overall decrease in stigma, but the effect was small. However, effect sizes for overall effects did not significantly differ from zero as a result of contact. The absence of significant findings for overall effect may result from an underpowered sample; unlike the 190 effect sizes that comprised the education sample, only 43 effect sizes reflected the effects of contact. Note that the mean effect sizes for overall effects were virtually the same for contact and education and were not significantly different across antistigma conditions.
Follow-up effects of antistigma programs on attitudes more closely paralleled findings from the pre-post meta-analysis. Mean effect sizes for attitudes significantly differed from zero for education and contact, but the large effect size for contact was more than twice that for education. Mean effect sizes here significantly differed from each other, despite the limited number of effect sizes for contact (k=16) compared with education (k=136). When added to the pre-post findings, meta-analyses of follow-up results suggest that the effects of contact on attitudes, such as perceptions of dangerousness, competence, and blame, were superior to those of education.
The lack of significant effects of contact interventions on overall effects may reflect the heterogeneity of the distribution of effect sizes. Some contact interventions were more effective than others. This finding is consistent with results from our earlier meta-analyses (
2), which found substantially larger effects for in-person contact interventions than for contacts using video.
Little was learned from these analyses about whether length of follow-up is an indicator of an intervention’s effect, in part because the data were highly skewed. In many of the studies, the follow-up period was rather short (median, <2 months). It seems reasonable to conclude that the antistigma intervention’s effects will diminish as time passes between the completion of the intervention and follow-up testing. An important question for future research is how long one can expect an intervention’s effects to endure. Similarly, are effects maintained better by boosters? Some researchers recommend that plans for antistigma programs include continuity strategies (
7). Hence, we expect boosters will emerge as an important moderator.
Our findings focused on the impact of antistigma interventions on overall effects and attitudes, ignoring the interventions’ effects on affect or behaviors. Although proxies of affect and behaviors were examined in the pre-post meta-analysis, these constructs were not included in this study because insufficient numbers of studies examined behavior at follow-up. That is regrettable because advocates now believe that changing behaviors, and not just attitudes, is essential for meaningful stigma change (
8). Assessing changes in behavior related to stigma is not an easy task because behaviors are hard to collect (document). One suggestion has been to wed stigma change programs to specific groups as a way to more clearly suggest behavior goals (
7). For example, research suggests primary care providers often do not refer patients labeled mentally ill for secondary care when in need (
9). Hence, one approach to measure stigma among primary care physicians would be to track the number of referrals they make after participating in an antistigma program.


