Depression affects approximately 16.1 million adults in the United States (
1). Negative outcomes—including functional disability (
2), increased health care expenditures (
3), and higher risk of morbidity and mortality (
4)—are associated with depression, which remains underdiagnosed. Identification of depression among adults during screening in primary care settings, followed by treatment, leads to lower morbidity (
5). Routine depression screening of all adults has been recommended by the U.S. Preventive Services Task Force (USPSTF) since 2009 (
6).
Existing studies have examined depression screening patterns and predictors among adult populations in ambulatory care settings (
7–
9). However, to our knowledge, no study has examined the patterns, predictors, and trends in depression screening among adults without a depression diagnosis. The objective of this study was to examine national-level patterns, predictors, and trends in depression screening among adults in ambulatory care settings in the United States.
Methods
This is a cross-sectional study utilizing pooled data from the National Ambulatory Medical Care Survey (NAMCS) (2005–2015). The University of Arizona Institutional Review Board assessed this study as “not human subjects research.”
Nationally representative health care services provided in ambulatory care settings in the United States are captured in the NAMCS and collected by the National Center for Health Statistics (NCHS) annually. The NAMCS data provide weights used to estimate nationally representative ambulatory care service utilization. Cross-sectional surveys are administered to capture physician-patient encounters or visits defined as a direct, personal exchange between a patient and physician (or a staff member working under a physician’s direction) for the purposes of seeking care and providing health services. A multistage probability sampling design is used to collect the following data: probability samples drawn from primary sampling units (PSUs) and from practicing physicians utilizing PSUs and number of physician-patient encounters or visits within the annual practices of the sample physicians selected (total physician sample is divided into 52 random subsamples, with each subsample randomly assigned to one week of the survey year, during which physicians conduct systematic random sampling of visits) (
10). Information gathered includes patient characteristics, physician characteristics, diagnoses, prescribed medications, and service delivery.
The study sample consisted of adults (≥18 years) without a depression diagnosis who made an ambulatory care visit to a nonpsychiatrist. Visits were excluded if they listed
ICD-9-CM depression diagnosis codes (296.2–296.36, 300.4, or 311) or if the answer to the question “Regardless of the diagnoses written,…does the patient now have: depression?” was “yes” (
11). This question supplements diagnosis codes for chronic conditions (
12).
Depression screening (yes/no) was the dependent variable for this study. The question used to identify screening was “Were any examinations, blood tests, imaging, other tests, non-medication treatment, or health education ordered or provided at this visit?” [A list of independent variables is available as an online supplement to this report.]
Each individual record is assigned a patient visit weight (inflation factor) that is used to predict the total number of office visits made in the United States. All estimates are related to the number of patient visits and are subject to sampling variability. When conducting any survey procedure, a complex survey design is accommodated with weights, strata, and cluster information available in the survey that help with producing the national estimates. All analyses were conducted with an a priori significance level of .05 and adjusted for the complex survey design (weight, strata, and cluster) to obtain nationally representative estimates and were conducted using SAS, version 9.4. Weighted percentages of visit estimates were reported using descriptive statistics. Multivariable logistic regression analyses adjusting for all independent variables were conducted to examine depression screening predictors. Piecewise (segmented) regression analyses (
13) were conducted to evaluate the yearly trend and depression screening rate differences pre- and post-2009. The year 2009 was selected as the inflection point because the initial USPSTF recommendation for depression screening was published that year (
5). Year of visit served as the key independent variable in the piecewise (segmented) regression analysis, where year is segregated into intervals, and a distinct line fits into each of the intervals. Using this approach, the difference between intercept and slope coefficients was determined pre- and post-2009 USPSTF depression screening recommendations (
5). In order to further assess the effect of USPSTF depression screening recommendations during different time points, three different time segments were created. The period from 2005–2008 served as the prerecommendation period, and 2010–2011 and 2012–2015 served as the immediate and late postrecommendation periods, respectively. Because the USPSTF depression screening recommendation was published in 2009, this year was considered to be a phase-in period that allowed time for health care providers and patients to get acquainted with this recommendation.
Results
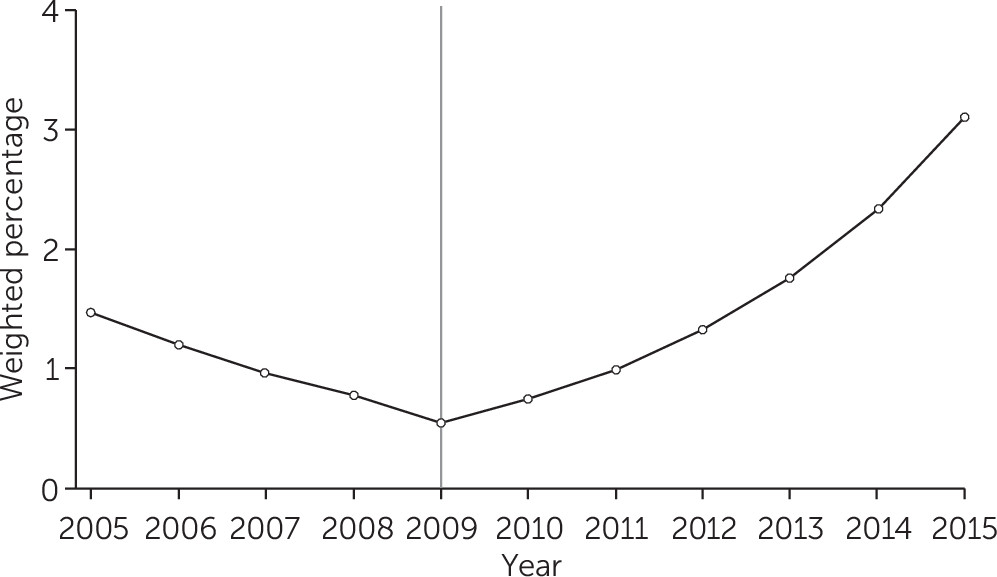
A total of 298,896 (unweighted) visits by adults met study inclusion criteria, and 3,986 (unweighted) visits included depression screening. Thus approximately 105 million visits reported depression screening at the national level from 2005 to 2015, which represents 1.4% (95% confidence interval [CI]=1.19%−1.56%) of the visits by adults without a depression diagnosis during this entire period. The rates varied over time, with the lowest in 2008 (.65%, CI=.35–.95) and the highest in 2015 (3%, CI=1.93–4.07). [Details of depression screening rates by year are presented in the online supplement.]
Overall, in the study sample, approximately 66% of the adults were 18–64 years old, 60% were female, 73% were white, 89% resided in metropolitan areas, and 39% resided in the southern United States [see
supplement]. Subgroup differences were noted across different factors. Multivariable findings were consistent with the univariate analyses in which gender, physician specialty, metropolitan location, geographical region, and time spent with physician were significantly associated with receipt of depression screening. Multivariable logistic regression analyses showed an increased likelihood of depression screening each year (odds ratio [OR]=1.12, CI=1.06–1.18, p<.001) . The piecewise regression analysis revealed a statistically significant (p<.001) interaction between year and change in depression screening rate, where screening rates increased significantly post-2009 (
Figure 1) [see
supplement for findings from the multivariable logistic regression analyses]. Further piecewise regression analysis showed that there was less likelihood of depression screening during the prerecommendation period (OR=.78, CI=.65–.91, p=.002). However, during the immediate and late postrecommendation periods, the odds of depression screening were higher (OR=1.46, CI=1.07–1.98, p=.016, and OR=1.34, CI=1.21–1.49, p<.001, respectively) [see
supplement].
Discussion
Findings from this study suggest that depression screening among adults without a depression diagnosis in the United States remains low. In 2009, the USPSTF recommended screening all adults only when enhanced programs were present (
5). This recommendation was later updated to reflect that screening should occur regardless of the presence of enhanced services (
6). Given that this study took place before the revised statement, the low screening rate observed likely reflects the earlier recommendation. There was a significant rise in depression screening rates post-2009, possibly influenced by the Affordable Care Act of 2010, which mandated the provision of preventative care such as depression screening at no cost to patients (
14).
Regional disparities in depression screening were observed, similar to previous research (8,11). Such findings may be explained by the greater number of rural communities and lower number of large metropolitan areas in the western United States compared with the rest of the country. Screening may need to be specifically promoted in rural America to address these regional disparities.
This study observed that more time spent by the patient in the physician’s office led to higher screening rates, consistent with findings from Schmitt et al. (
9). Since increasing the length of time of the actual visit to the physician may be difficult, it is recommended that other health care providers in these settings be trained to provide screening.
Findings from this study should be interpreted with caution, given that there were several limitations. The cross-sectional study design does not allow for causal inferences. It is possible that patients may be receiving depression screening through other mechanisms. Moreover, there is a high probability that depression screening methods (e.g., asking informal questions or using a standardized measure) vary across providers, and this is not addressed in the NAMCS data. If a depression diagnosis was recorded postscreening during a visit, then these visits were excluded from final analysis and may have led to lower screening rate observed in this study.
State-level health insurance coverage may have an impact on depression screening, but this study could not examine the state-level differences, as the changing sampling design of NAMCS data over years does not allow for state-level estimations, which is one of the major limitations of this study. Other limitations inherent in using a secondary data set, such as the possibility of reporting errors, coding errors, and interviewer effects, should be considered.
Conclusions
Although depression screening rates have increased significantly post-2009, screening remains low among adults without a depression diagnosis.
Acknowledgments
The authors thank Zufan Yegezu for help with manuscript formatting.


