Small area analysis is a technique that facilitates comparison of health services utilization and quality across various geographic areas (
1). Using this technique, researchers have consistently documented that the practice of medicine varies across geographic settings. For example, rates of procedures—such as tonsillectomy, prostatectomy, and hysterectomy (
2)—and inpatient hospitalization rates for general medical illnesses—such as back problems, gastroenteritis, and heart failure (
3)—have varied beyond what would be expected because of patient factors, such as illness severity or treatment preference (
4–
6). Furthermore, areas that on average provide substantially more care for identical conditions may not produce better outcomes (
7,
8), and such care could represent waste and inefficient resource allocation. Treatment patterns for common life-threatening conditions, such as acute myocardial infarction, vary widely, and patients in areas that have greater surgical capacity are much more likely to undergo surgery, rather than medical interventions (
9). It has been suggested that this “unwarranted variation” may be related to the supply of services available across geographic areas and to local medical culture (
10).
The development of the
Dartmouth Atlas of Healthcare in the 1990s facilitated the application of small area analysis to health care nationally, enabling the systematic identification of unwarranted variation on a local level (
11). Recent literature has been more critical of the concept of unwarranted variation in medicine (
12,
13). However, there is little debate that variation exists (
14) and that developing better tools to measure and better understand the drivers of variation could be a foundational step in improving health care systems (
15,
16).
Although small area analysis has been extensively applied to hospital-based medical and surgical services, it has been rarely applied to mental health services (
17). A 1995 analysis of psychiatric inpatient admission patterns in Iowa found higher rates of inpatient stays in areas with more primary care physicians, psychiatrists, and inpatient psychiatric units (
18). However, the authors used standard hospital service areas (HSAs) created for the
Dartmouth Atlas, which are based on where most Medicare recipients living in contiguous zip codes obtain general inpatient hospital services. Because there are many more general hospitals than specialized facilities providing inpatient psychiatric care, most of the HSAs created for the
Dartmouth Atlas did not contain a psychiatric unit. The importance of specifically considering psychiatric units is underscored by work in New England indicating that the localization index (LI), that is, the percentage of patients residing in a given HSA who obtain care in that HSA, for psychiatric hospitalizations increased from 23% to 69% when the analysis used mental health–specific HSAs rather than
Dartmouth Atlas HSAs (
19). Another analysis of the Iowa data grouped counties into politically defined community mental health center (CMHC) catchment areas and found that access to CMHC resources was associated with higher demand for inpatient psychiatric admissions (
20). The CMHC catchment areas were not necessarily the same or even intended to be the same as catchment areas for inpatient psychiatric units.
Perhaps the most comprehensive study of geographic variation in inpatient mental health care examined county variation in New York (
21). This study found that population variables, such as poverty and population density, were highly correlated with mental health service utilization; however, even when the analysis controlled for these factors, proximity to inpatient facilities was associated with increased utilization. Finally, a less comprehensive but more granular study examined geographic variation in inpatient psychiatric admissions in New York City (
22). These authors used zip codes as their unit of analysis and did not construct HSAs. They found that patients residing in a zip code where an inpatient psychiatric unit was located were more likely to be admitted. Similar to previous studies, this analysis was subject to the erroneous assumption that patients obtain their mental health care at local inpatient units: many zip codes did not have an inpatient psychiatric unit, and patients did not necessarily obtain their mental health care within their zip code, county, or state. Although the assumption that patients obtain care locally may be valid for countries with geographic assignments within national health care systems (
15,
23,
24), patients in the United States generally have flexibility about where to receive care.
Inpatient treatment dominated U.S. mental health care spending in the 1990s, when the
Dartmouth Atlas was created (
25,
26). More recently, most mental health care spending is in the ambulatory setting (
27). Thus, it may be more reasonable to build the basic geographic unit of analysis of mental health care use around outpatient services. We propose that the most granular level should be called “mental health service area” (MHSA). The
Dartmouth Atlas aggregates the 3,436 HSAs into 306 larger hospital referral regions (HRRs) according to where most Medicare recipients living in HSAs obtain heart surgery and neurosurgery (
11). Although useful for understanding geographic health service use patterns for expensive, highly technical procedures, HRRs may not be as useful for understanding mental health service utilization. However, in an analogous manner, MHSAs could be aggregated into mental health referral regions (MHRRs) on the basis of where mental health patients living in contiguous MHSAs obtain more intensive and specialized types of mental health treatment, including residential and inpatient care. These utilization-based small areas could be used to conduct analyses of geographic variation in the quality, quantity, and outcomes of mental health care.
This strategy could be used as an organic approach to understanding mental health services use across the U.S. health care system, and we used the Department of Veterans Affairs (VA) as an initial case example. The VA has integrated inpatient and outpatient data for all patients who access VA health care (i.e., VA users). It aims to provide a consistent level of high-quality mental health care nationally and allows users to receive care at their choice of VA facilities. Thus, our objectives were to construct MHSAs and MHRRs for the VA and to use these utilization-based areas to initially evaluate the variation of provision of key mental health services in the VA: outpatient mental health visits and residential and acute inpatient care.
One may reasonably ask why it is necessary to define service areas at all. First, they are based on actual patient use patterns, which may cross zip code, county, and state boundaries. Second, they typically contain one or a few service providers who can observe (and be accountable for) how their actual treatment practices and outcomes compare with those of others. Finally, service areas enable standard epidemiological methods with use of numerators and denominators to calculate rates.
Methods
Data Sources
We used the VA Corporate Data Warehouse to develop our study data set and collected data on VA health care facilities as well as patient demographic, utilization, and diagnostic data. This study was approved by the VA Institutional Review Board of Northern New England and VA national data systems. A waiver of informed consent was obtained. All analyses were completed within the VA Informatics and Computing Infrastructure secure computing environment.
Construction of MHSAs and MHRRs
Our goal was to create empirically defined regions of adequate size and that contained populations around facilities that provide mental health care. Once defined, these regions were used to compare the quantity of mental health care received and to measure quality and outcomes. (To facilitate future use among VA stakeholders, we include a detailed description of our analysis approach in an
online supplement to this article.) As described in the supplement, we constructed regions using mental health care that was provided by the VA (
28).
We constructed MHSAs and MHRRs by examining patterns of VA mental health service use from 2008 through 2014. We restricted our analysis to veterans and VA facilities in the 50 U.S. states and the District of Columbia. Each MHSA includes one or more counties attributed to a VA facility (e.g., community-based outreach clinic or VA medical center) that provides outpatient mental health care. We chose county-level aggregation instead of zip codes, because many zip codes had few or no VA users. Each MHRR contains one or more MHSAs attributed to a VA facility (primarily a VA medical center) that provides inpatient or residential mental health care. Thus, an MHSA contains one or more counties, and an MHRR consists of one or more MHSAs.
The initial assignment of counties to MHSAs was completely empirical. Each county was attributed to the mental health facility that provided most of the outpatient mental health visits for VA users from that county. Next, we required that counties assigned to the same MHSA be contiguous. To accomplish this, we created county-demarcated maps displaying MHSA assignments and reassigned noncontiguous counties on the basis of proximity to facilities and the LI. An analogous approach was used to attribute MHSAs to MHRRs. Each MHSA was initially designated to the facility to which residents of the MHSA were most often admitted for mental health care stays. When more than one MHSA was attributed to an MHRR, we required that the regions be contiguous, using printed maps and the LI to reassign. Of the 3,143 U.S. counties, 69 were reassigned to different MHSAs, and eight MHSAs were reassigned to different MHRRs to enforce the contiguity rule.
For each MHSA and MHRR, we calculated the LI as a measure of assignment quality. We defined the LI as the number of mental health visits to the assigned mental health facility (numerator) divided by all mental health visits to any facility (denominator). We aggregated care received between 2008 and 2014 to develop services areas. We conducted a sensitivity analysis by using the LI to assess whether small areas changed over time (see online supplement). We found high concordance of LIs for both MHSAs and MHRRs between 2008–2014 and 2015–2018.
Outcomes
To assess service use outcomes, we used the same types of utilization as the inputs for service area creation, but we expanded the date range and added “fee” data, which reflected services paid for by the VA but delivered outside the VA. The outcomes analysis combined data from 2008 through 2018 to increase precision and provide more recent events. We added fee data so that the outcomes covered all care paid for directly by the VA. We created annual denominators based on veterans who had any VA use in the year. Use of all benefits-eligible users in an area as denominators would have produced biased results, because veterans’ reliance on VA versus private-sector health care varies according to locally available private options and other factors (
29,
30). We did not restrict the denominator to VA users who accessed mental health services, because VA users vary regionally and demographically in how they access mental health care (
31). We used indirect adjustment to account for differences among areas in age, gender, race, and ethnicity. Race was defined as White, Black, or unknown, and ethnicity was defined as Hispanic, not Hispanic, or unknown; age was categorized into five groups.
For MHSAs, we calculated both the number of mental health visits per year and the percentage of veterans with one or more mental health visits. For MHRRs, rates included both the sum of residential and acute inpatient days per person, as well as the percentage of individuals experiencing one or more stays during the year. For each stay, we used the actual dates of service, such that a single inpatient or residential stay that spanned 2 years would count as an admission in each year, and the days occurring in each year were allocated to the appropriate year. We attributed veterans annually to their most frequent zip code of residence. For both MHSAs and MHRRs, we mapped results by quintiles, with each quintile containing the same number of geographic units rather than the same number of people. We used this grouping because we were interested in regional variation that is independent of population size.
Results
Creation of MHSAs and MHRRs
Among the 1,021 facilities that provided any outpatient mental health care, 441 met our criteria to be designated as MHSAs, because they provided the plurality of mental health care to at least one county. A total of 3,909,080 patients with 52,372,303 outpatient mental health visits (in 2008–2014) were used to create these MHSAs. The overall national LI was 68.1%, and the unweighted mean±SD across MHSAs was 59.3%±16.4%. The mean number of counties per MHSA was 7.0±9.1. Among the 238 facilities with acute inpatient or residential stays, 115 met our criteria to be designated as MHRRs. A total of 337,193 patients with 845,193 inpatient mental health stays (2008–2014) were used to create these MHRRs. The overall national LI was 68.8%, and the mean across MHRRs was 67.8%±12.7%. The mean number of MHSAs per MHRR was 3.8±2.6.
Outpatient Mental Health Visits
VA users had a mean of 1.98±7.22 outpatient mental health visits per year (in 2008–2018). Almost one-third of all VA users (33.2%) had at least one mental health visit in any given year. Outpatient mental health service use exhibited substantial regional variation; the lowest quintile of MHSAs had an adjusted mean of 0.88±0.18 visits, compared with 3.14±0.85 for the highest quintile (
Table 1). The adjusted percentages of users with one or more visits in a year for the lowest and highest quintiles were 16.8% and 58.5%, respectively.
Figure 1 shows the geographic variation in mean number of outpatient mental health visits per year on a national map revealing regional patterns. For example, VA users in the upper Midwest generally had more outpatient mental health visits than those in the Southeast.
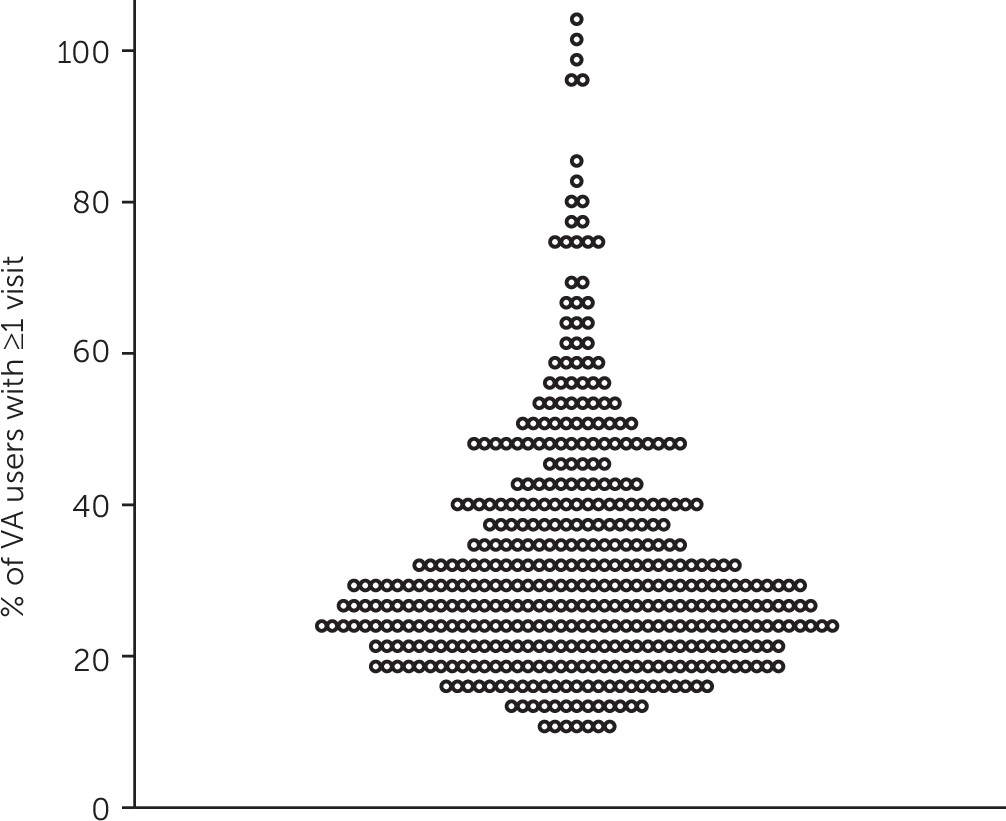
Figure 2 shows as a turnip plot the annual percentage of VA users in each MHSA who received an outpatient mental health visit. The points at the top represent a cluster of five MHSAs in southwest Florida where almost all VA users had a mental health visit each year.
Residential and Acute Inpatient Stays
VA users had a mean of 0.69±9.13 total days of combined residential and inpatient days per year (2008–2018). These days were concentrated among the 1.7% of all VA users who had at least one stay in any given year. Regional variation was substantial, with VA users in the lowest quintile of MHRRs having an adjusted mean of 0.29±0.05 days, compared with 1.79±1.57 days for those in the highest quintile. The adjusted percentages of users with ≥1 days in a year for the lowest and highest quintiles were 1.1% and 2.8%, respectively (
Table 1).
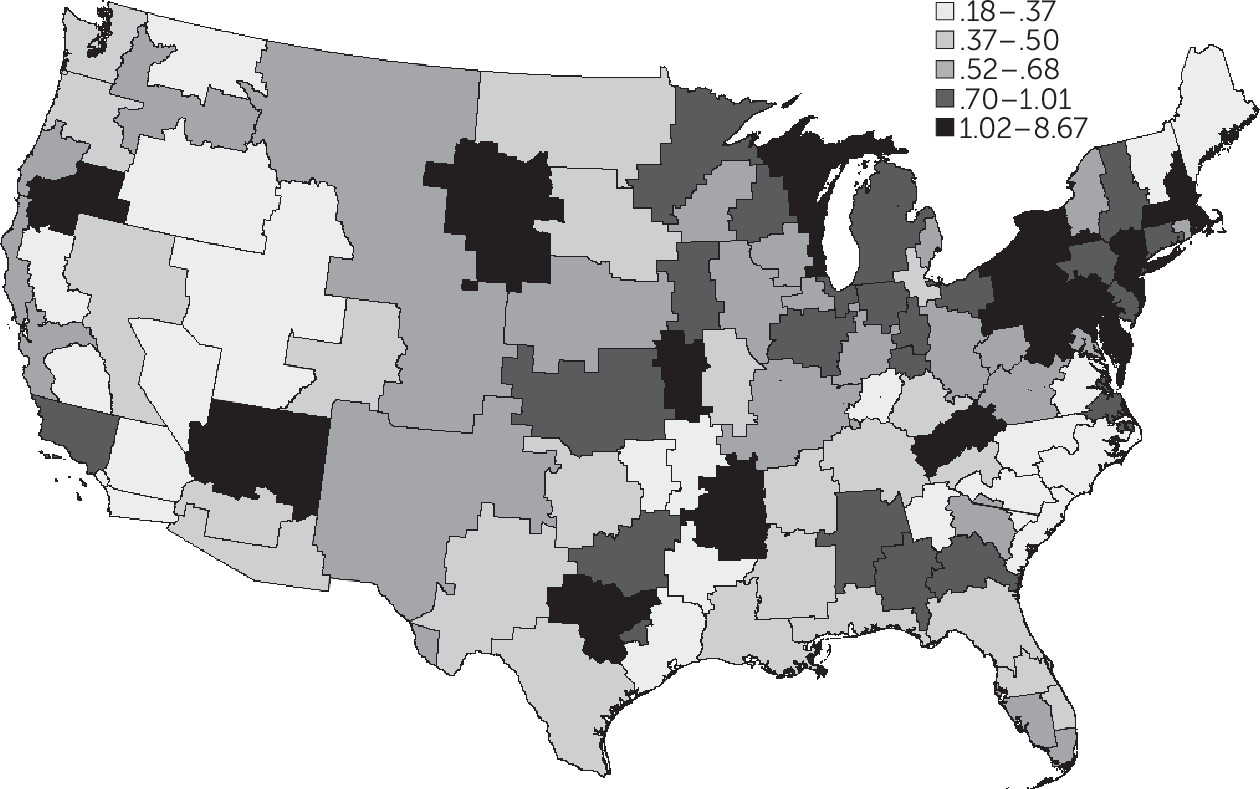
Figure 3 displays the regional variation in combined residential and acute inpatient days at the MHRR level. Notably, areas in the highest quintile abutted areas in the lowest. We note that VA users in the Northeast generally had higher rates of residential and acute inpatient days than those in the Mountain West.
Figure 4 shows a turnip plot of the annual percentage of VA users in each MHRR who incurred at least 1 day in an acute or residential facility in the year. Noticeably, the top point represents a single MHRR covering parts of northern California and southern Oregon where 5% of VA users spent at least 1 day per year in a VA residential or inpatient mental health setting.
Discussion
Using VA administrative data and small area analysis of utilization to identify and evaluate variation in the use of mental health services within the VA system, we created two geographic tools, MHSAs and MHRRs. In our illustrative case example examining outpatient visits as well as residential and acute inpatient stays, we identified large geographic variation in mental health service utilization rates that might represent underutilization, overutilization, or a combination of both. Although patient needs may vary geographically, it is unlikely that differences on the order of threefold and greater between top and bottom quintiles can be explained solely by patient needs. Seminal small area analysis studies that used general medical HSAs have demonstrated substantial geographic variation in health care utilization (
2,
3), and small area analysis has been widely applied to health care claims data (
12,
13). However, only Watts et al. (
19) adapted small area analysis to mental health services utilization, with the creation of psychiatric service areas for inpatient care. As in the study by Watts and colleagues (
19), we created valid representations of geographic patterns of mental health stays (the LI was 69% for stays in both Watts et al. and the present study) and identified substantial geographic variation in these mental health stays. Watts and colleagues examined inpatient psychiatric admissions in northern New England, and we evaluated both inpatient and outpatient mental health service utilization across all 50 U.S. states and the District of Columbia.
Our work had several limitations. First, we created service areas that were based on VA-provided mental health care for veterans. These utilization regions would likely differ from those based on civilian mental health care financed by Medicare, Medicaid, or private insurance. Likewise, many VA users receive care outside the VA system by fee-basis or covered by a payer other than the VA. It would have been difficult to include fee-basis data to create service areas because the location of facilities is often unknown. We also preferred service areas that are directly linked to VA facilities. We chose county-level aggregation rather than zip codes as our smallest unit of analysis. In a large county with multiple facilities that are geographically disparate, our method of attribution may lack precision. However, only 5% of counties had an LI <30% for outpatient care. Third, although the VA is a national health system, its mental health coding practices vary across regions and within VA administrative data. The quality of encounter documentation may have affected the accuracy of our results. A general assumption of small area analysis is that individuals do not move specifically for the provision of health care. It is possible that veterans with a serious mental illness resulting in frequent stays in facilities moved to be closer to a preferred facility or simply declared the facility as their residence address, driving up utilization rates locally, as perhaps seen in a single MHRR in the Northwest. Finally, inpatient mental health stays can be defined in more than one way. In this study, we combined acute inpatient and residential stays to generate MHRRs. Residential stays tend to be longer than acute inpatient stays, but for attribution purposes, we counted stays rather than total days. Therefore, variation in the use of facilities should have had little effect on attribution.
Conclusions
Using a VA-based model, we constructed a valid geographic tool for small area analysis of utilization of mental health services. We freely distribute this tool for use by VA stakeholders and researchers (available at
https://github.com/VAvtmudhog/mental_health_regions.git). Our study found substantial national variation in the delivery of mental health services to veterans that hitherto had not been reported. This variation could result from multiple sources, including differences in need, demand, or local practice norms. Future research could compare health outcomes among regions with differing care practices. For example, low-quality outpatient services may decrease utilization but increase inpatient need. Further research into population, treatment, and provider-level characteristics will be important for understanding mental health utilization patterns. Use of our attribution methods with non-VA data may elucidate patterns of mental health service use across U.S. health care. In the future, policy makers could choose to wield these tools to allocate the supply and location of facilities and to compare quality and outcomes.


