Expansion of Medicaid under the Patient Protection and Affordable Care Act of 2010 (ACA) dramatically transformed insurance coverage for substance use disorder treatment in the United States (
1–
4). Under the ACA, substance use disorder treatment services are identified as an essential health benefit that all Medicaid expansion plans must cover, making it the first federal mandate requiring any type of health insurance plan to cover substance use disorder treatment. Importantly, the ACA requires Medicaid expansion plans to comply with mental health and addiction parity legislation, which specifies that plans must provide coverage for substance use disorder treatment services in a manner that is no more restrictive than coverage of medical and surgical services.
In this study, we used data from the Medicare Part D Public Use File (2010–2017) to examine whether there were positive spillovers in opioid use disorder medication prescribing to Medicare Part D beneficiaries in Medicaid expansion states. We focused on prescribing of buprenorphine and extended-release injectable naltrexone, two medications approved by the U.S. Food and Drug Administration for opioid use disorder treatment that were covered Medicare benefits during our study period. Although prior studies have shown several positive benefits of Medicaid expansion for Americans with opioid use disorder, research has not examined potential spillovers to the Medicare population. This population is important to study because older adults are adversely affected by the opioid crisis and are experiencing increasing rates of opioid use disorder and opioid-related overdose deaths (
5–
9). Additionally, Americans with disabilities, who represent about 14% of Medicare beneficiaries, are also at high risk for opioid-related harms (
10).
There are several reasons to expect positive spillovers in opioid use disorder medication prescribing to Medicare patients in Medicaid expansion states. Nontrivial barriers exist to prescribing these medications. For buprenorphine, a schedule III narcotic, physicians and other qualified health care providers are required to complete an 8-hour course to obtain a waiver to prescribe buprenorphine for opioid use disorder. After a provider obtains this waiver, prescriptions may be written for any patient as long as the total number of patients is below the physician’s waiver limit, which is set at a maximum of either 30, 100, or 275 patients (at one time).
Although there are no waiver requirements for injectable naltrexone, appropriate prescribing requires providers to have knowledge of how to treat opioid use disorder. Notably, training in addiction medicine is not offered in a majority of medical schools in the United States (
11–
14). Additionally, storage and delivery of injectable naltrexone are more complex than those of other opioid use disorder medications, and patients must be opioid free for 7–10 days before initiating treatment, which may deter providers from prescribing injectable naltrexone (
11,
13,
15).
We may also expect spillovers, given that physicians, particularly those in primary care, treat both Medicaid and Medicare patients. Approximately 67% of primary care physicians who treat Medicare beneficiaries also treat Medicaid beneficiaries and uninsured patients (
16). Research has also found that 82.9% of newly buprenorphine-waivered physicians accept both Medicaid and Medicare (
17). We expected that, generally, most providers would choose Medicare patients over Medicaid patients because of higher reimbursement rates under Medicare (
18). Prior research has also shown that, on average, physicians are not prescribing buprenorphine at levels near their patient limits (
17,
19); thus, it is likely that providers have room under their limits to treat additional Medicare patients. To the extent that providers treat both Medicaid and Medicare patients and have the capacity to treat additional patients with opioid use disorder, a positive spillover to Medicare patients is expected.
Several studies have found that Medicaid expansion had a positive relationship with buprenorphine treatment capacity and prescribing of buprenorphine and naltrexone (
20–
25). We contributed to this literature by considering the potential spillover effects of expanded treatment access among Medicare Part D beneficiaries, a population that has been hard hit by the opioid crisis but has not been previously studied in this context.
Methods
Data Sources
Data on prescribing of buprenorphine and injectable naltrexone were taken from the Medicare Part D Prescription Public Use File (2010–2017). Of note, injectable naltrexone is prescribed for both alcohol and opioid use disorders. However, the data set does not include patient diagnosis, so we were unable to determine the condition for which the medication was prescribed. For each prescriber and drug, the total number of prescriptions dispensed under Medicare Part D in a given year were reported, although values <11 were suppressed. Prescription data were aggregated to the county-year level. We treated suppressed values as zeros; thus, data represent an underestimate of the true level of medication prescribing.
We identified Medicaid expansion states and their date of expansion by using data from the Kaiser Family Foundation as well as Maclean and Saloner (
20,
26). State policy data were from OPTIC-Vetted Data Sets and the work of Bradford and colleagues (
27–
29). County-level characteristics of the Medicare population were taken from the Centers for Medicare and Medicaid Services’ Geographic Variation Public Use File. County-level demographic data were taken from publicly available data sources (Area Health Resource File; Bureau of the Census; the Surveillance, Epidemiology, and End Results Program; U.S. Department of Agriculture Economic Research Service). The University of Georgia Institutional Review Board classified this study as not human subjects research.
Measures
Dependent variables.
We created three sets of dependent variables to measure prescribing of opioid use disorder medications at the county-year level. First, we constructed dichotomous measures indicating whether a county had any buprenorphine provider serving Medicare Part D patients in a given year, any injectable naltrexone provider, or any provider of one of those two medications (“any provider”).
Second, we constructed measures of the log(number of medication providers + 1) in the county, measured separately for buprenorphine, injectable naltrexone, and any provider. Third, we constructed a measure of the log(number of medication daily doses + 1) in the county (buprenorphine, injectable naltrexone, and any medication). We log-transformed these variables because we theoretically expected Medicaid expansion to have a proportional effect on the number of providers and doses. In other words, we expected larger absolute changes in the number of providers and doses in counties with relatively higher levels at baseline (controlling for population, as discussed later). Coefficients from these models should be interpreted as percentage changes.
We considered, but did not adopt, two-part models for the number of providers and daily doses, where the first part would be a model of the extensive margin (whether there were any prescriptions in the county), and the second part would be the conditional intensive margin (number of providers or prescriptions in counties with nonzero prescribing). However, in this longitudinal setting where we expected counties to move from “no prescriptions” to “few prescriptions,” the compositional change in the counties included in the second part would bias those coefficients toward zero.
Independent variables.
Our independent variable of interest was a dichotomous variable that measured state Medicaid expansion status. The variable took on a value of one if the state expanded Medicaid as of June of the observation year and a value of zero otherwise. Over the observation period, 32 states expanded Medicaid.
Control variables.
We included a range of control variables measured at the county-year level to account for within-county changes in Medicare beneficiary characteristics and county demographic characteristics that may independently affect the availability and utilization of opioid use disorder medication. First, we measured several characteristics of Medicare beneficiaries: log(total number of beneficiaries), percentage of Medicare beneficiaries enrolled in a Medicare Advantage Plan, percentage of dually eligible Medicare beneficiaries, average beneficiary age, percentage of female Medicare beneficiaries, number of inpatient stays per 1,000 Medicare beneficiaries, number of emergency department visits per 1,000 beneficiaries, and average hierarchical condition category score (a model-based risk score intended to measure expected future medical costs of beneficiaries). We also measured county race-ethnicity, median household income in $10,000s, unemployment rate, poverty rate, and log(total county population). State policy control variables included implementation of must-access prescription drug monitoring programs, naloxone laws, pain management clinic laws, and state medical and recreational cannabis dispensary access.
Analytic techniques.
Descriptive statistics were calculated for all study variables. We used a difference-in-differences linear regression framework to examine the effect of Medicaid expansion on prescribing of opioid use disorder medications in Medicare Part D. Effects were estimated by comparing regression-adjusted differences in prescribing between nonexpansion and expansion states, before versus after expansion. The identifying assumption in this model was that, in the absence of Medicaid expansion, outcomes in nonexpansion and expansion states would have trended similarly over time (the “common trends” assumption) (
30). We conducted analyses in 2020–2021 by using Stata, version 16.1.
All models included county and year as fixed effects, with standard errors clustered at the state level to address within-state serial correlation. The unit of analysis was the county-year (N=24,376). We also conducted event study analyses (see
online supplement); these models were an extension of the primary difference-in-differences model because they allowed the estimated effect to vary on the basis of time relative to expansion. These analyses were conducted to determine whether the outcome variables were trending similarly in expansion and nonexpansion states during the period before expansion, because these findings would support the common trends assumption.
We tested the robustness of our models to a logistic regression specification estimating the probability of a county having any buprenorphine, any injectable naltrexone, or any providers (rather than linear probability); estimating an inverse hyperbolic sine specification (rather than natural log); specifying outcome variables as number of prescribers and number of daily doses per 1,000 Medicare beneficiaries and per 1,000 county population; and replacing the logged Medicare beneficiary variable with the percentage of Medicare beneficiaries in the county (see
online supplement).
Results
Descriptive Statistics
On average, 40.4% of all county-year observations had at least one provider prescribing any opioid use disorder medication over the study period (
Table 1). The percentage of all county-year observations with a buprenorphine provider was 34.8%, and the percentage of all county-year observations with an injectable naltrexone prescriber was 3.1%.
Over the study period, 50.3% of county-year observations in Medicaid expansion states had at least one opioid use disorder medication provider, compared with 37.8% in nonexpansion states. On average, 43.8% of counties in expansion states had at least one buprenorphine provider, and 6.9% of counties had at least one injectable naltrexone provider over the study period. In contrast, 32.3% of counties in nonexpansion states had at least one buprenorphine provider, and 2.1% had at least one injectable naltrexone provider.
In Medicaid expansion states, counties on average had a greater number of buprenorphine providers (0.11 providers per 1,000 beneficiaries) and injectable naltrexone providers (0.004 per 1,000 beneficiaries), compared with nonexpansion states over the study period. Nonexpansion states, on average, had 0.069 buprenorphine providers and 0.001 injectable naltrexone providers per 1,000 beneficiaries. The number of daily doses of medications followed the same pattern (for complete descriptive statistics, see
online supplement).
Difference-in-Differences Regression Results
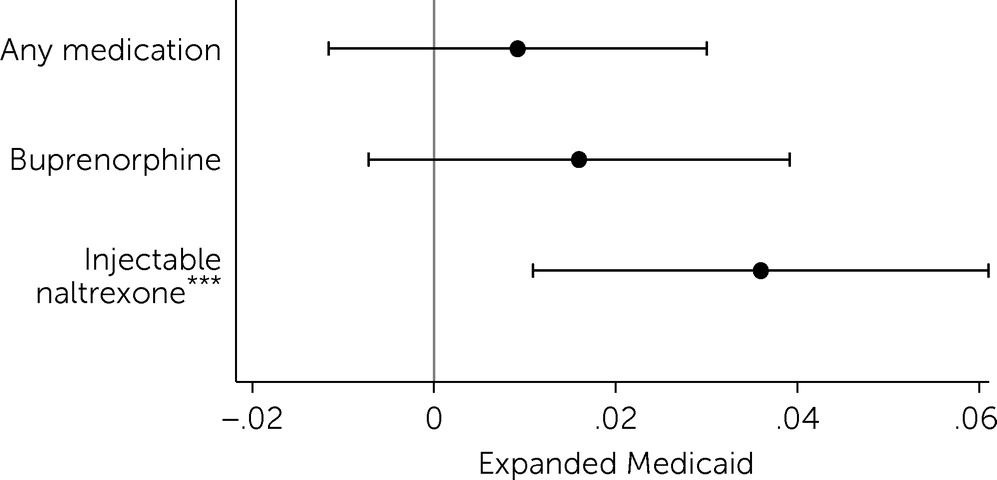
Results showed that Medicaid expansion was associated with an increase in the probability of a county having any injectable naltrexone providers who serve patients in Medicare Part D (
Figure 1). After expansion, the probability of a county having at least one injectable naltrexone provider increased by 3.6 percentage points (p<0.01), relative to the change in nonexpansion states.
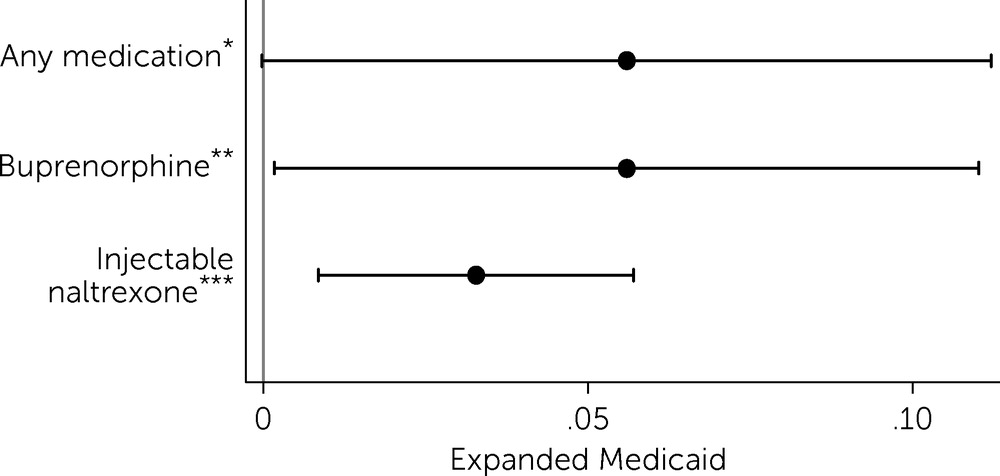
Overall, results showed that Medicaid expansion was associated with a 5.6% increase in the total number of buprenorphine- and injectable naltrexone–prescribing providers serving the Medicare Part D population (p<0.05), relative to nonexpansion states (
Figure 2). This increase in the overall number of providers serving the Medicare Part D population in expansion states was driven by a 5.6% increase (p<0.05) in the number of buprenorphine providers and a 3.3% increase (p<0.01) in the number of injectable naltrexone providers (
Figure 2).
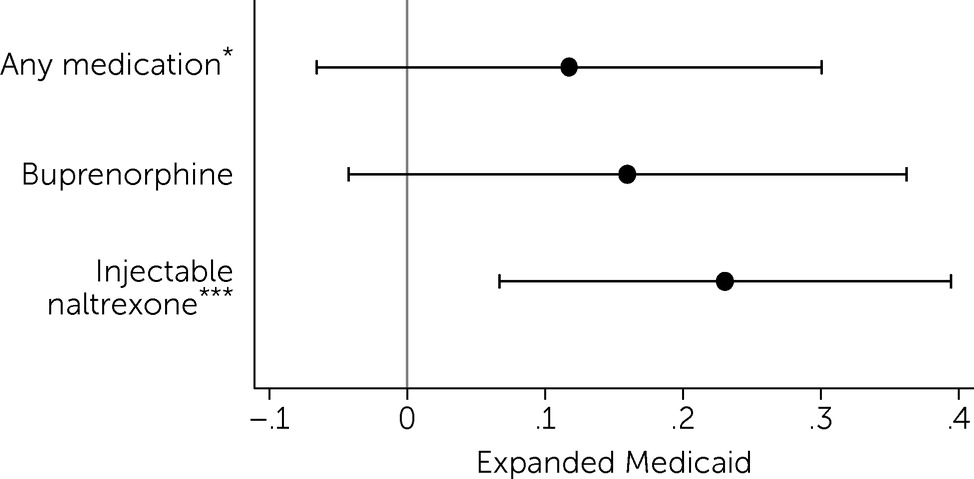
Results also showed that, after Medicaid expansion, prescribing of injectable naltrexone to Medicare Part D beneficiaries increased (
Figure 3). The number of daily doses of injectable naltrexone increased by 23.1% (p<0.01) (
Figure 3) (for full regression results, see
online supplement).
Results from event study analyses supported the common trends assumption (see
online supplement). For all outcome variables, the estimated coefficients for the periods before Medicaid expansion were not statistically different from zero; these findings supported the identifying assumption that in the absence of Medicaid expansion, the outcomes in adopting and nonadopting states would have evolved along similar trends. We note, however, that for the buprenorphine-related outcomes, examination of the point estimates suggested that this outcome was potentially evolving along a different trend for expansion and nonexpansion states in the periods before expansion. Therefore, these results should be interpreted with caution.
Discussion
Results indicate that Medicaid expansion is associated with positive spillovers in opioid use disorder medication prescribing to Medicare Part D beneficiaries. We found that Medicaid expansion was associated with an increase in the probability of a county having an injectable naltrexone provider but not a buprenorphine provider, indicating that the increase in buprenorphine providers is occurring in counties that already have at least one buprenorphine provider.
We also found that counties in expansion states experienced increases in the number of injectable naltrexone providers serving Medicare Part D beneficiaries along the intensive margin, although effects were modest. Results also showed that Medicaid expansion is associated with increases in the number of daily doses of injectable naltrexone prescribed to the Medicare Part D population. For buprenorphine, we found increases in the number of providers serving Medicare Part D beneficiaries; however, we did not find significant changes along the other margins that we examined.
These increases in the number of providers may translate to modest but meaningful changes in access for Medicare Part D beneficiaries. For interpretation, we scaled the estimated 5.6% increase in the number of buprenorphine providers serving Medicare Part D beneficiaries by the preexpansion mean number in Medicaid expansion state counties. This calculation suggested that Medicaid expansion resulted in 0.14 additional providers in a given expansion county (2.54 providers × 5.6% increase), or a total of 209.3 additional buprenorphine providers across all Medicaid expansion states (0.14 × 1,495 expansion state counties), relative to counties in states that did not expand Medicaid. If each of these buprenorphine providers holds a 30-patient waiver and treats only 30 patients annually, then 6,279 additional Medicare Part D patients can receive buprenorphine as a result of expansion. This estimate assumes that providers treat only 30 unique patients in a given year, which is likely an underestimate given the high degree of discontinuation among patients treated with buprenorphine. Prior research has found that the percentage of patients receiving buprenorphine who discontinue treatment in the first month of treatment is about 25% (
31) and that the percentage who discontinue treatment within 6 months of buprenorphine initiation ranges from 55% to 64% (
31–
34).
Additionally, we found a positive association between Medicaid expansion and the number of daily doses of injectable naltrexone, but not daily doses of buprenorphine. Scaling the estimated 23.1% increase by the baseline mean number of daily doses prescribed in a county-year (630.9) indicates that expansion increases the number of daily doses of injectable naltrexone prescribed to Medicare Part D beneficiaries by 145.7 in a given county-year, an increase of approximately 217,878.2 daily doses (7,262.6 monthly injections) across all expansion state counties. Although modest, this increase in daily doses translates to 1,210.4 additional 180-day courses of injectable naltrexone; 180 days (or more) is the Healthcare Effectiveness Data and Information Set and National Quality Forum quality measure of continuous treatment with opioid use disorder pharmacotherapy. Our findings are supported by prior studies that found an increase in naltrexone prescriptions in expansion states (
22,
24).
Given the rise in opioid-related overdose deaths and growing need for opioid use disorder treatment among older adults and beneficiaries with disabilities, increasing access to evidence-based medications for this patient population is critical (
9,
35). Estimates suggest that in 2013, 14% of Americans with opioid use disorder were Medicare Part D beneficiaries (
6); moreover, the number of fee-for-service Medicare beneficiaries with an opioid use disorder increased by 377% over the past decade (
36). Although a recent report found that the number of Medicare Part D beneficiaries receiving buprenorphine or naltrexone has been steadily increasing (
37), research indicates significant gaps between need and capacity for opioid use disorder treatment in Medicare Part D (
6). Thus, additional strategies to improve the accessibility of opioid use disorder medication treatment for this population are needed.
This study had several limitations. First, publicly available Medicare Part D data did not include diagnostic codes, patient characteristics, or Medicare plan characteristics such as use of prior authorization, treatment setting characteristics, or treatment quality and duration measures. Thus, we were not able to determine whether medications were prescribed to older adults, dual-eligible beneficiaries, and/or beneficiaries with disabilities. Second, suppression of prescription data for data privacy concerns may bias our treatment estimates. Third, we were unable to determine whether providers held a waiver to prescribe buprenorphine. Buprenorphine may also be prescribed for pain; however, we excluded buprenorphine products indicated for pain from the analyses. Fourth, injectable naltrexone is prescribed for both opioid and alcohol use disorders. Thus, we were unable to determine the diagnosis for which the medication was prescribed. Fifth, methadone used to treat opioid use disorder was not a covered benefit under Medicare during our study period; thus, we were not able to include it in the study. Sixth, there may be endogenous factors associated with states expanding Medicaid that are also associated with Medicare billing that were not completely controlled for by our study methods. Finally, although a quasi-experimental research design was used in this study, causality could not be established.
Conclusions
Our findings suggest that Medicaid expansion states may be better equipped to address the opioid crisis, not only in terms of the direct benefits to Medicaid beneficiaries (
1,
2,
23,
38) but also in terms of the accessibility of opioid use disorder medications for Medicare Part D beneficiaries. By the year 2030, one in five Americans will be eligible for Medicare, and this population is experiencing increased rates of opioid use disorder and opioid-related mortality (
39). A comprehensive public health response to the opioid crisis must include targeted efforts to increase access to evidence-based treatment in the nation’s growing Medicare population.
