Over the past decade utility measurement instruments have been used to obtain quality-adjustment weights for health states associated with a broad range of physical diseases. However, they have had little or no application to health states associated with psychiatric disorders. Our aim in this paper is to introduce mental health professionals to the concepts and methods of utility measurement. First, utility theory and general issues related to measurement are summarized. Next, the utility approach is illustrated using depression as an example. Utility measures are contrasted with traditional measures of depression symptoms, and the experience to date with utility measures of depression is reviewed. To provide an example, we describe the design of the McSad health state classification system for depression, a direct utility measure for depression, and report the results obtained in a patient survey using McSad.
Utility theory andmeasurement methods
Utility measures are derived from economic and decision theory, specifically von Neumann-Morgenstern utility theory, which describes decision making under conditions of risk and uncertainty (
5,
6,
7). The objective of the utility measurement process is to determine the score for a specific state of health on the utility scale, which ranges from 0, indicating death, to 1, indicating perfect health. The utility score an individual assigns to a given health state reflects the desirability or preference that person has for that health state relative to perfect health and death—that is, its utility.
Utility scores—often referred to simply as utilities—are obtained through specialized measurement techniques: the standard gamble, the rating scale, and the time trade-off. The standard gamble and the rating scale methods are discussed below. The time trade-off approach is described elsewhere (
4). The standard gamble is the classical approach to utility measurement (
4,
8) because preferences are measured under uncertainty—that is, risk or probabilities are involved in the utility measurement question. The rating scale and time trade-off methods can also be used, although these methods produce values, not utilities, because uncertainty and risk are not involved in the measurement process. Rating scale values can be transformed with a power curve calculation to allow them to be interpreted as utilities (
8,
9). For the time trade-off approach, however, no conversion method is currently available.
The distinction between utilities obtained with the standard gamble and values obtained with the rating scale or time trade-off techniques is important. Value measurement is founded on psychological scaling (
10,
11), whereas utility measurement is founded on von Neumann-Morgenstern utility theory. Empirically, the differences are systematic (for health states, utilities exceed values) and can be quite large (
3). In health applications, utilities are more appropriate than values because von Neumann-Morgenstern utility theory addresses decision making in the face of uncertainty. Clearly, health care decisions often involve uncertainties, and sometimes large uncertainties.
Utilities can be obtained directly (
1) or indirectly (
4,
12). McSad is a direct measure in which rating scale and standard gamble techniques are used in a structured, interviewer-administered questionnaire to obtain utilities for specific health states. Respondents are asked about their own state of health and about other hypothetical health states that they may or may not have experienced in the past, selected according to the research objectives of the investigator. McSad is focused on depression and hence uses hypothetical depression health states.
Alternatively, utilities can be obtained indirectly by classifying an individual's health status into a multiattribute health status classification system (
12,
13). The utility for a specific health state is then calculated using the scoring formula for that system. However, no such system is currently available for converting classifications of psychiatric disorders into utility scores.
Utility measurement in depression
The information provided by utility scores is complementary to existing measures of the presence and severity of psychiatric symptoms, such as the Hamilton Depression Rating Scale (
14), the Montgomery-Asberg Depression Rating Scale (
15), the Beck Depression Inventory (
16), and the Center for Epidemiologic Studies Depression Scale (
17). However, these instruments differ from the utility approach in a fundamental way. The scores they produce reflect the presence and severity of depressive symptoms, as defined by the item content, the scaling method, and the rater (physician, trained interviewer, or patient).
In contrast, utility scores measure the desirability or preference a patient has for depression as a health state, relative to other health states, on the utility scale. For example, two respondents might have identical depression severity ratings on the Hamilton Depression Rating Scale. However, when they are asked to rate their own current health states using utility techniques, the desirability or preference they assign on the scale may differ significantly. In an evaluation of the impact of a drug treatment for depression, scores on a utility measure and on a symptom rating scale may lead to different conclusions about the benefit of the treatment.
Relatively little attention has been given to utility measurement in depression. Scores for depression health states are available from only a few surveys of representative samples of the general population using methods with demonstrated reliability and validity. In one study, a health state characterized as a three-month episode of depression was assessed using the time trade-off method and received a value of .44 (
18). In another study, again using the time trade-off method, a health state described as "being anxious or depressed some or a good bit of the time and having very few friends and little contact with others" received a score of .45 (
8). In a third study, the health state "extremely fretful, angry, irritable, or depressed usually requiring hospitalization or psychiatric institutional care" received an indirect utility score of .50 using a multiattribute health status classification system (
19).
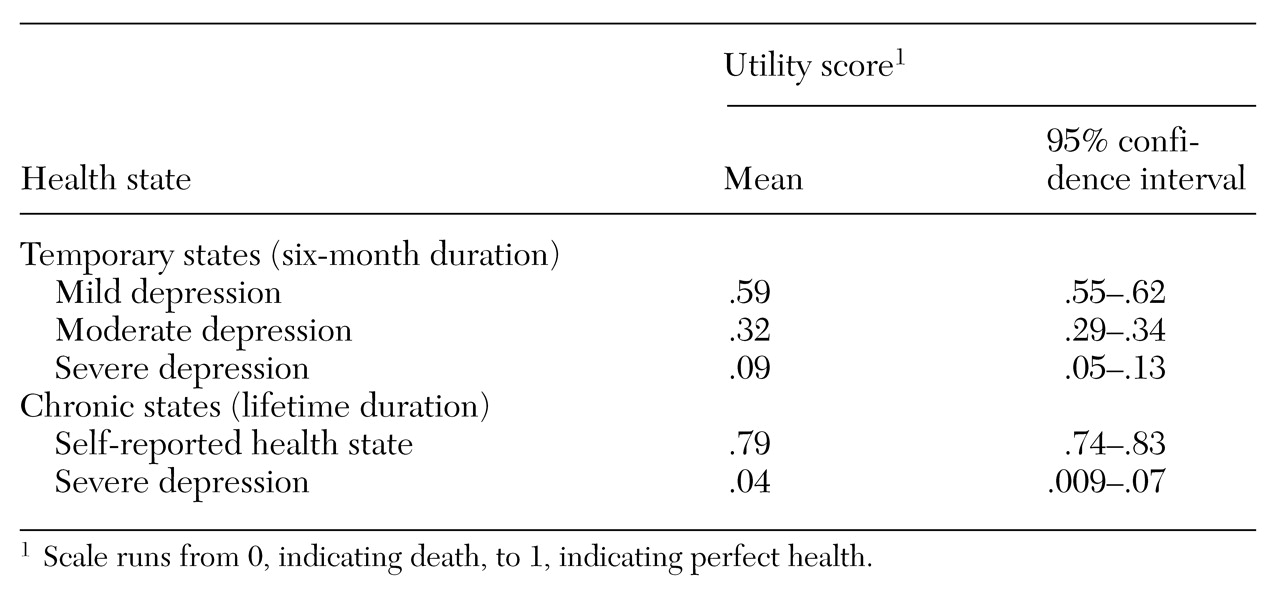
Utility scores provide the weights required to calculate quality-adjusted life years (QALYs) for cost-utility analysis. The following is a simplified example of how they are used. Utility scores obtained with McSad (discussed in more detail below) were .59 for mild depression and .32 for moderate depression. For an individual who can be expected to live another 20 years, the QALY figure associated with spending the entire 20 years in the moderate depression health state would be 6.6 years (20 x .32).
In contrast, the QALY figure associated with spending the entire period in the mild depression health state would be 11.8 years (20 x .59). Thus 5.2 quality-adjusted life years are gained as a result of an intervention that moves an individual from the moderate to the mild depression health state. The cost of treatment per QALY gained is then calculated. Cost can be calculated from at least three different perspectives—cost to the patient and the family, cost to the health care system, and cost to society. Torrance (
3) provides a detailed discussion of the use and calculation of QALYs.
To our knowledge, only three cost-utility analyses of treatment for depression have been published. In one of these studies, utility values were generated by a panel of physicians rather than by patients or representative samples of the general population or caregivers (
20). The authors of the study provided very few details about the methods they used to obtain the utility scores. Elsewhere it has been shown that physicians tend to assign higher utility scores than patients to a given health state (
21). Another investigator used estimated values drawn from a literature review (
22).
A third study included standard gamble utilities obtained from a sample of patients at two sites who had completed eight weeks of antidepressant therapy (
23). Untreated depression received a standard gamble utility score of .30. The other states assessed described short-term treatment with three different drugs. The authors provided very little information about the content of the health state descriptions and how they were developed. Also, if the patients were symptomatic, the scores obtained may have been biased downward.
Mean utility scores can be compared between treatment groups to evaluate differential treatment effects on patient preferences for the outcomes produced. For example, the mean utility score for a new treatment might be in the neighborhood of .60, which is consistent with mild depression (as suggested by the initial results with McSad presented below). If the existing standard treatment resulted in a mean utility score around .30 (consistent with moderate depression, based on the mean McSad utility score for this state), then we could conclude that, on average, the new treatment moves patients from moderate depression to mild depression. In the absence of clinical benchmarks along the utility scale, a difference of .10 on the scale is the minimum to be considered a clinically important difference (
4).
The McSad utility measure for depression health states
In this section we provide an example of a direct utility measure of depression health states—McSad. First we describe the instrument itself. Then we report utility scores for depression health states obtained in a patient survey using McSad.
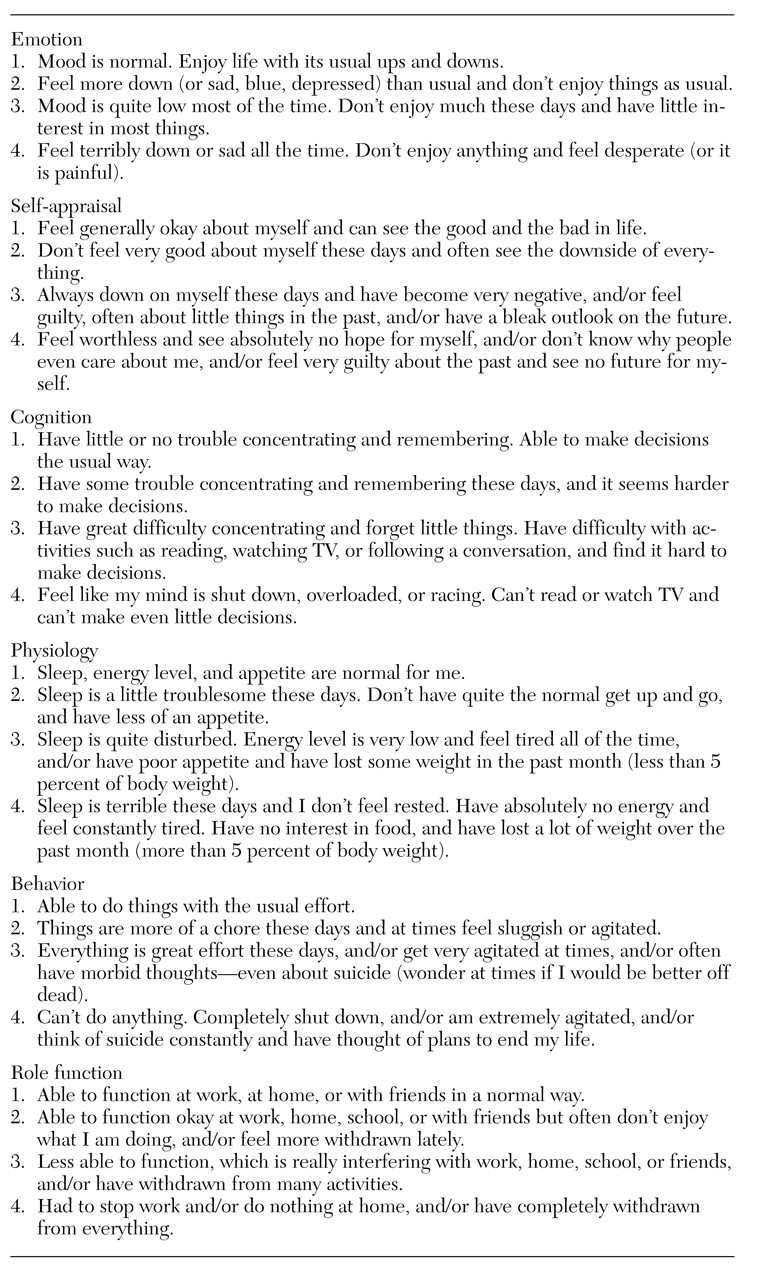
McSad was designed to measure utility scores for four depression health states: the respondent's self-reported health state and three clinical marker health states of untreated depression. Clinical marker health states are hypothetical states that the respondent may or may not have experienced. The three included in McSad, which describe untreated mild, moderate, and severe unipolar depression, provide utility scores for clinically important levels of untreated depression. These clinical marker health states were constructed using items from the six dimensions listed in
Table 1. They can be used as benchmarks, or anchors, along the utility scale to aid in the clinical interpretation of utility scores (
24).
To create descriptions of health states requires multiattribute classification systems that make explicit the dimensions of health and then define them in terms of levels of functioning (
12,
13). However, existing multiattribute systems are of limited usefulness for describing depression health states because they were developed to describe general health status and physical function (
12,
13). The Health Utilities Index, for example, includes eight dimensions: vision, hearing, speech, ambulation, dexterity, emotion, cognition, and pain (
13).
To describe depression health states, we developed the initial draft of the McSad depression health state classification system. The final version of the system was based on validity assessments by clinicians involved in the care of depressed patients. A full description of the validity assessment methods we used is available elsewhere (
25).
As shown in
Table 1, McSad consists of six dimensions: emotion, self-appraisal, cognition, physiology, behavior, and role function. The selection of these dimensions was guided by the
DSM-III-R criteria for major unipolar depression. Each dimension is operationalized by specific components designed to capture its essence in depression. For example, mood and ability to experience pleasure are the components of the emotion dimension.
Four levels of functioning are defined for each dimension, reflecting absence of dysfunction or mild, moderate, or severe dysfunction. For example, having no dysfunction on the emotion dimension is described as "Mood is normal. Enjoy life with its usual ups and downs." Mild emotional dysfunction is described as "Feel more down (or sad, blue, depressed) than usual and don't enjoy things as usual."
Respondents' self-reported health state is obtained at the start of the McSad interview by presenting them with a checklist of the McSad items and asking them to identify their level of functioning on each of the six dimensions during a specified period preceding the interview, usually seven days. The completed checklist is then used in the McSad interview along with the three McSad clinical marker health states—descriptions of untreated mild, moderate, and severe depression, presented to respondents on printed cards.
The McSad interview is a face-to-face interview with a trained interviewer. Respondents are asked a series of questions, in two parts, about the four health states. In part one, the questions about the health states are derived from the rating scale method, and in part two, from the standard gamble.
The rating scale approach is presented as a feeling thermometer. Respondents rank the health states by preference, relative to one another and to the anchor states. The top anchor of the thermometer, assigned a value of 100, is defined as the most preferred health state (perfect health). The bottom anchor, assigned a value of 0, is defined as the least preferred health state (death). In this exercise, respondents are asked to imagine living in each of the four health states without change for the rest of their lives. They are then asked to place the states of health along the scale in order of preference, spacing them at intervals that reflect the differences in the strength of preference the respondent feels for them. A utility score between 1 and 0 is computed for each health state.
The standard gamble is presented in the interview as two choices. Choice A, the uncertain choice, contains two possible health state outcomes, perfect health and death, which have the probabilities of p and 1-p, respectively, of occurring. Choice B is the certain choice; it includes only one possible health state or outcome—moderate depression, for example, as described in the corresponding clinical marker health state. The two health states are specified to last the same amount of time. The interviewer varies the probability (p) in choice A systematically until the respondent is indifferent between the uncertain and the certain choice.
For example, respondents are asked whether they would prefer to live the remainder of their lives in the moderate depression health state (choice B) or would prefer a lottery (choice A) in which they would have, say, a probability of .9 of having perfect health for the remainder of their lives and a probability of .1 of immediate death. If a respondent prefers choice A with these odds, the interviewer then reverses the question. Respondents are asked whether they would prefer to live the remainder of their lives in the moderate depression health state or would prefer a lottery in which they would have a probability of .9 of immediate death and a probability of .1 of having perfect health for the remainder of their lives. This reversal in the questioning, known as the Ping-Pong approach, is used to minimize measurement bias.
The interviewer then shifts the odds to a probability of .8 of perfect health and a probability of .2 of immediate death, and then again reverses the question. If the respondent still prefers the lottery, the odds are changed to probabilities of .7 and .3, and so on, until the respondent's preference for the lottery is the same as for a health state of moderate depression. Likewise, if the respondent prefers choice B at the outset, the odds are shifted in the opposite direction until the preferences are equal. The probability (p) at this indifference point is the utility score for the health state in choice B. The interviewer then goes to other health states, in random order, for choice B.
Application of McSad
McSad was applied in a cross-sectional survey of 105 patients who had experienced at least one episode of major, unipolar depression in the past two years but were currently in remission. Patients were recruited in 1995 from four psychiatric outpatient clinics linked to the Faculty of Health Sciences at McMaster University in Hamilton, Ontario. Of 121 patients referred, 117 met the inclusion criteria, and 112 agreed to participate. Of these, seven patients were excluded after the interview: five whose results were positive on a screen for relapse and two who were deemed ineligible because of physical handicap and hospital admission for depression, conditions that might bias the utility scores downward.
Interviews were audio-recorded and were spot-checked at regular intervals by a member of the research team. All interviews were completed, and the mean±SD interview duration was 52.6±8.4 minutes. Eighty-nine percent of the respondents were judged by the interviewer to have fully comprehended the interview, and all respondents were judged to have been fully cooperative.
The mean±SD age of the respondents was 41.7±8.7 years. Females constituted 74 percent of the sample, 62 percent reported English as their ethnic identity, and 68 percent were engaged in either full-time or part-time employment outside the home. Sixty-nine percent reported that they had completed high school, and 19 percent had a university degree. Sixty-six percent of the respondents reported that they first sought treatment for their depression within the past four years, 71 percent had experienced more than one episode of depression, and 66 percent reported that they had experienced severe depression as described by the McSad severe depression health state. Sixty-six percent of the respondents were currently taking antidepressant medication.
Table 2 shows the mean utility scores and 95 percent confidence intervals for the McSad depression health states. The three clinical marker states were measured using a six-month duration, and the self-reported health state and severe depression were measured using a lifetime duration. The respondent's self-reported health state appears not to have influenced the scores assigned to the hypothetical health states; the Pearson correlation coefficients between the self-reported health states and the hypothetical health states were all below .15 (p>.05). The order of the mean scores for the clinical markers is consistent with the rankings of mild (.59), moderate (.32), and severe (.09). The difference in means between mild and moderate depression is .27 (t= 15.16, p<.05), and the difference between moderate and severe depression is .23 (t=12.92, p<.05).