Measures I: client characteristics and outcomes
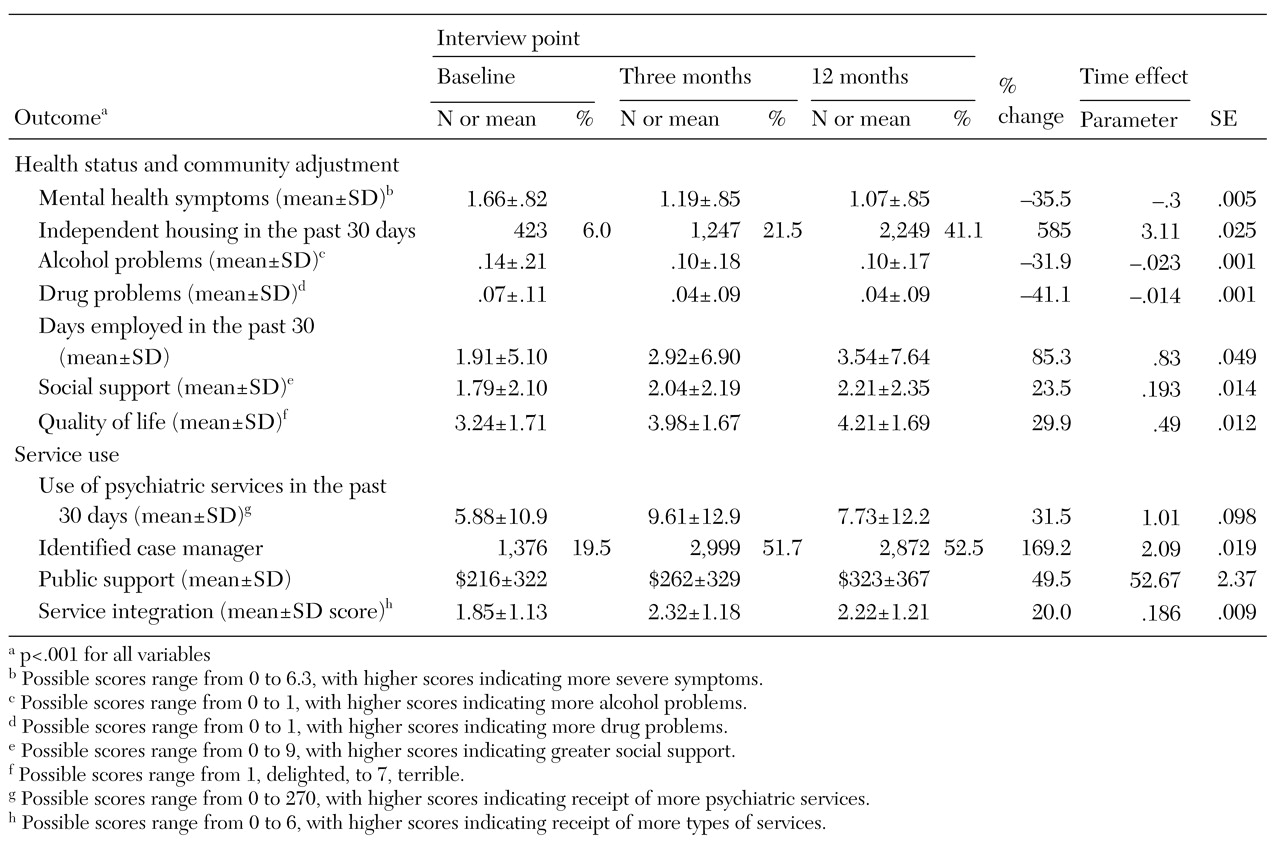
Sociodemographic characteristics, housing, and income. Client characteristics that we documented included age, sex, race, number of days employed, income, receipt of public support payments, duration of the current episode of homelessness, housing status in the 60 days before each interview, and social support—that is, the average number of types of people who would help the client with a loan or transport or in an emotional crisis (
2). History of conduct disorder was measured by reports of 11 behaviors occurring before the age of 15, such as being in trouble with the law or school officials, playing hooky, being suspended or expelled from school, and poor academic performance (
7). Family instability during childhood was measured with an 11-item scale that addressed experiences before the age of 18, such as parental separation, divorce, death, and poverty (
8).
Psychiatric and substance use status. Psychiatric status was assessed with standardized scales that measure self-reported symptoms of depression (
9) and psychosis (
10) and, at baseline, with interviewer ratings of psychotic behavior. Psychiatric problems, alcohol use, and drug use were further assessed with the composite problem scores from the Addiction Severity Index (ASI) (
11). Diagnoses were based on the working clinical diagnoses of the admitting clinicians on the assertive community treatment teams.
Quality of life. Overall quality of life was evaluated with a summary question, "Overall, how do you feel about your life right now?" Responses to the question were scored on a scale of 1, delighted, to 7, terrible (
12).
Primary outcomes. The two primary outcome measures were mental health symptoms and achievement of independent housing. To measure mental health symptoms, a mental health index was created by averaging standardized scores on three mental health outcome measures: the ASI psychiatric composite problem index, the depression scale derived from the Diagnostic Interview Schedule (DIS) (
9), and the psychotic symptom scale derived from the Psychiatric Epidemiology Research Interview (PERI) (Cronbach's alpha=.75). These scores were constructed by dividing the value of each observation by the baseline standard deviation of each measure. Test-retest reliability of this measure was assessed among 50 clients over a two-week period at one of the study sites and was found to be acceptable (intraclass correlation=.85).
For the purposes of assessing independent housing, participants were considered to be stably housed if they had been living in their own apartment, room, or house—either alone or with someone else—for 30 consecutive days by the measures developed for this study. Test-retest reliability of this measure was also acceptable (kappa=.84).
Service use. Service use was assessed with a series of 23 questions, developed for this study, about use of various types of health and social services during the 60 days before the interview. Another series of questions addressed receipt of public support payments and housing subsidies.
Client-level service integration. In contrast with systems integration, which reflects cooperation among diverse agencies at the macro system level, services integration is a client-level measure that reflects the extent to which individual clients have access to a diverse array of services appropriate to a wide range of potential needs. Dichotomous variables (scored as 0 or 1) were created as indicators of the use of each of six types of services: housing assistance or support from a housing agency, mental health services, substance abuse services, general health care, public income support (at least $100 a month), and vocational rehabilitation services. These measures were summed to form an index of services integration that was equal to the number of domains in which services were received. At baseline, the mean±SD value of this variable was 1.85±1.14 (range, 0 to 6).
We also recorded the proportion of clients who reported having a primary case manager on the basis of a single question that elicited their perception. This proportion was 19.5 percent at baseline, 52 percent at three months, and 53 percent at 12 months.
Analysis
First we conducted a series of random regression analyses to determine whether there was evidence of client improvement in the outcomes of interest and in access to services over the three client interview points (
16). The analysis then proceeded in three phases corresponding to the three hypotheses.
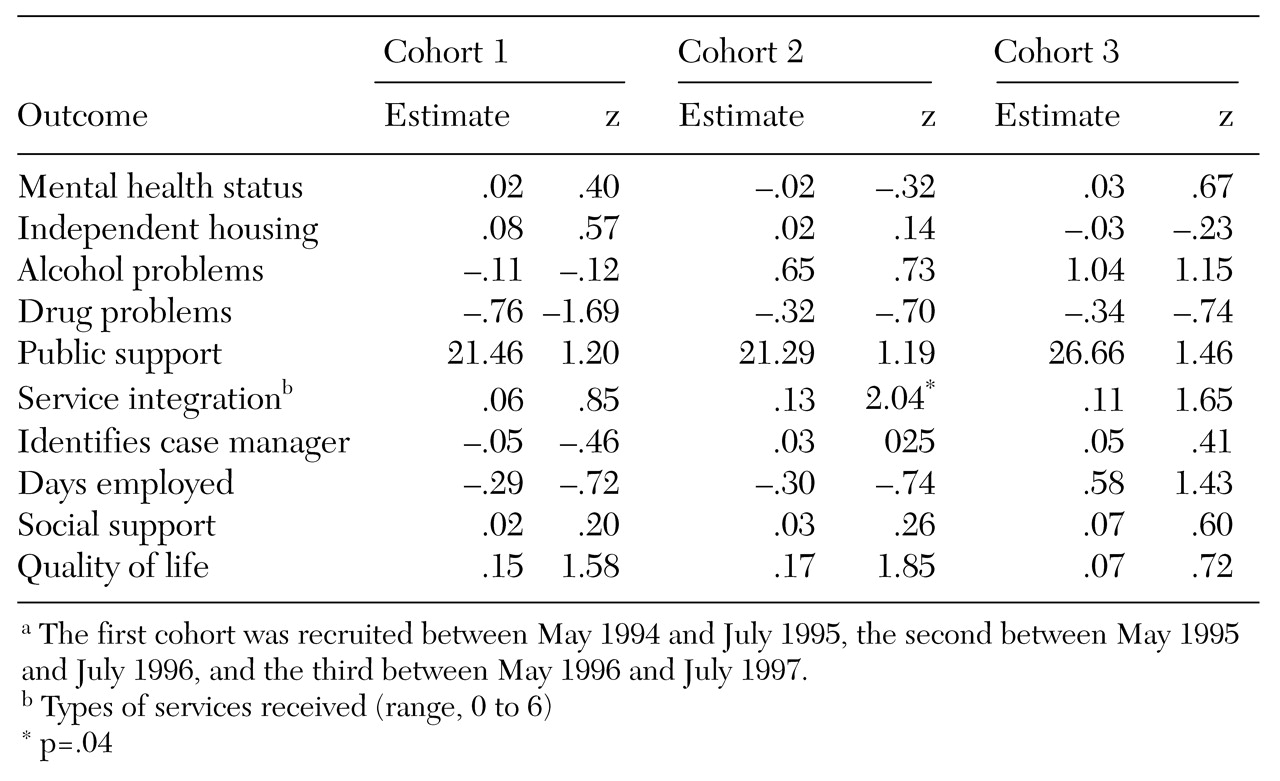
Experimental versus comparison sites. In the first phase of the analysis, changes in outcomes across cohorts were compared between the sites that were randomly assigned to be experimental sites and those that were assigned to be comparison sites. Because clients were not randomly assigned to sites, we expected that there might be baseline differences in client characteristics across study conditions within states. A series of two-way analyses of variance were used to identify baseline characteristics that differentiated clients at the experimental sites and the comparison sites in the entire sample and, more specifically, within each state. These analyses tested main effects for study condition (experimental, 1, versus comparison, 0), main effects for client cohort (coded 1 to 4), and the interaction of cohort and study condition, calculated as the product of these two terms. Baseline measures that showed a significant main effect for study condition or for the interaction between study condition and cohort within at least one state were included as covariates in all subsequent analyses.
To make use of all available outcome data, mixed-effects models were used for the principal analyses of the relationship between treatment condition and changes in outcomes across cohorts (
16). To test the hypothesis that there would be progressively greater improvement in outcomes across cohorts at the experimental sites than at the comparison sites, we used a model that used the first cohort as a reference group and evaluated the interaction between study condition and cohort for each of the subsequent cohorts. These models thus included nine key terms: a dichotomous main-effect term representing study condition; three dichotomous main-effect terms representing cohorts 2, 3, and 4; and three interaction terms representing the interaction of study condition and each dichotomous cohort variable.
In addition, a term representing the time of the follow-up interview—three months versus 12 months—was included, along with the potentially confounding baseline covariates described above. This multivariate model evaluated whether differences in improvements in client outcomes between the experimental sites and the comparison sites were significantly greater in later cohorts than in the first cohort.
In these models, each observation represented the measurement of a particular outcome for a particular client at one of the follow-up interviews. Because data from one client could thus be represented up to two times, and because different observations for the same client were likely to be correlated with one another, random effects using compound symmetry covariance structure were modeled for individual clients, thereby adjusting standard errors for the correlated nature of the data. Because client data were nested within sites that were nested within states, we used a three-level hierarchical linear model (
17). The software package MLwiN was used for these analyses.
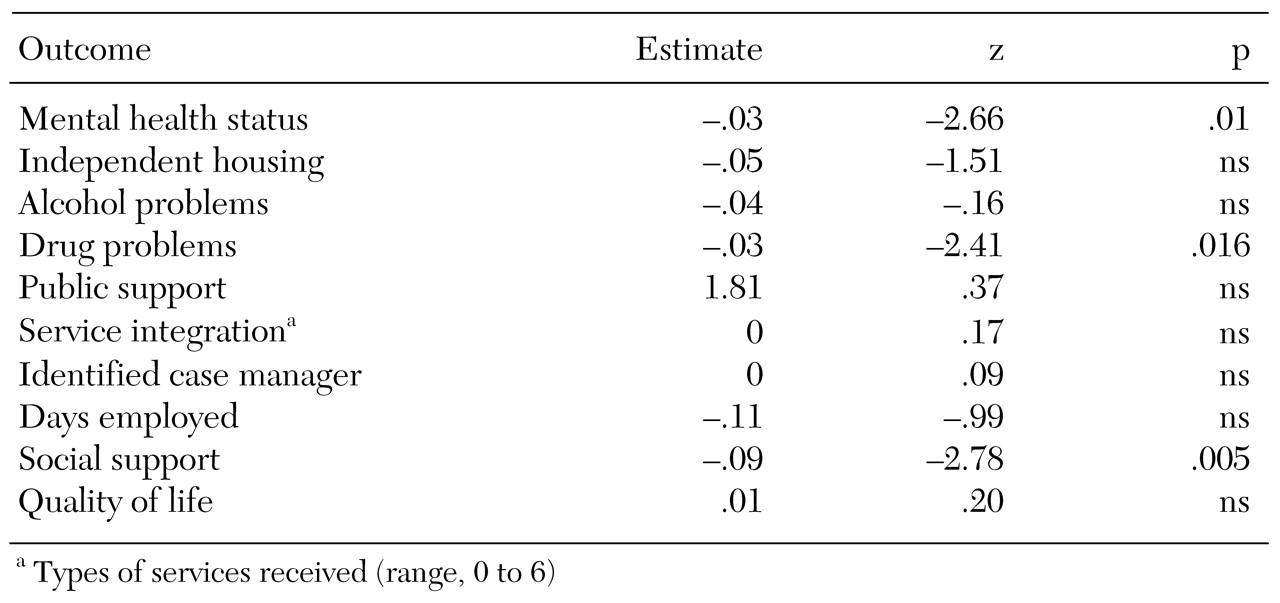
Implementation strategies. A similar analytic approach was used to evaluate the second hypothesis—that more complete implementation of a greater number of strategies for improving systems integration would be associated with superior client outcomes. We assumed that no systems integration strategies attributable to ACCESS had been implemented at the beginning of the demonstration (cohort 1), and scores of zero were recorded for all clients in the first cohort. For clients in cohorts 3 and 4, the value of the implementation measure specific to their site and cohort was used. As noted above, no measures were available for the use of integration strategies from cohort 2, so client data from that cohort were excluded.
The hypothesis was modeled by regressing three- and 12-month outcomes on measures of the implementation of integration strategies at each site, controlling, as in earlier models, for the baseline values of the outcome variables and potentially confounding baseline covariates as well as the term representing interview point.
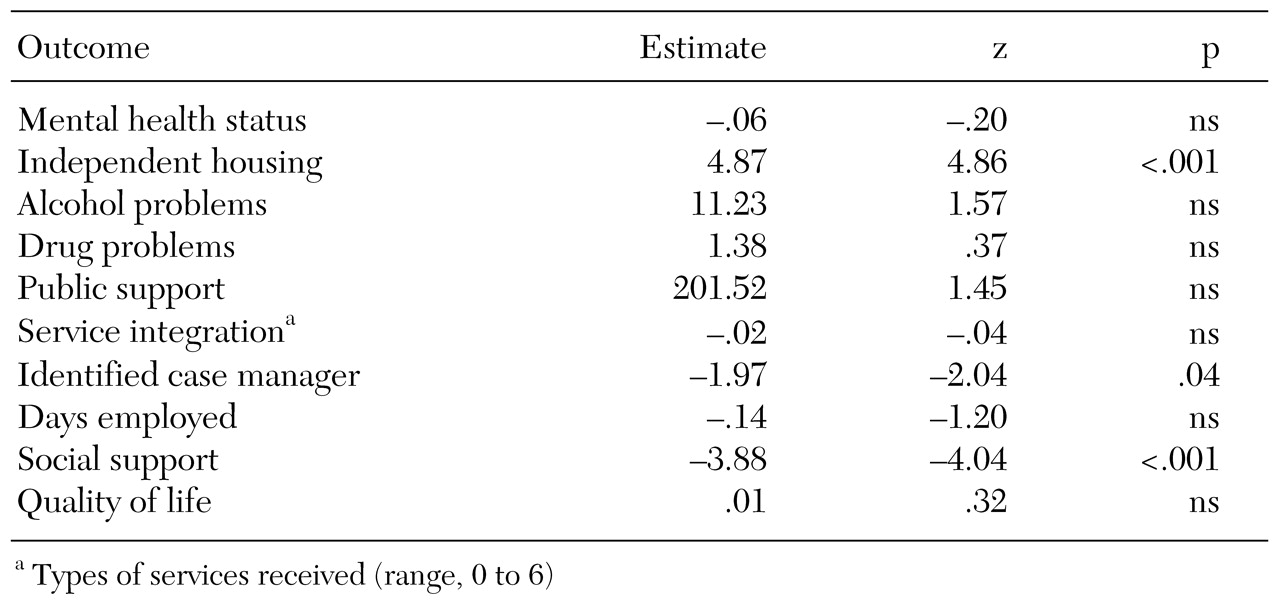
Changes in systems integration and changes in outcomes. A final set of analyses evaluated whether changes in systems integration between the first client cohort and each subsequent cohort were associated with parallel changes in client outcomes from the first to subsequent cohorts. As noted above, data on systems integration were not available for the third cohort, so client data from that cohort were excluded.
Measures of the amount of change in systems integration across cohorts at each site (from the baseline cohort 1) were generated by subtracting the measure of systems integration corresponding to cohorts 2 and 4 from the measure of systems integration corresponding to cohort 1 at each site. No change in systems integration was observed for cohort 1, so the measure of change in systems integration was zero. Client outcomes for that cohort were thus used as the reference condition for subsequent cohorts.
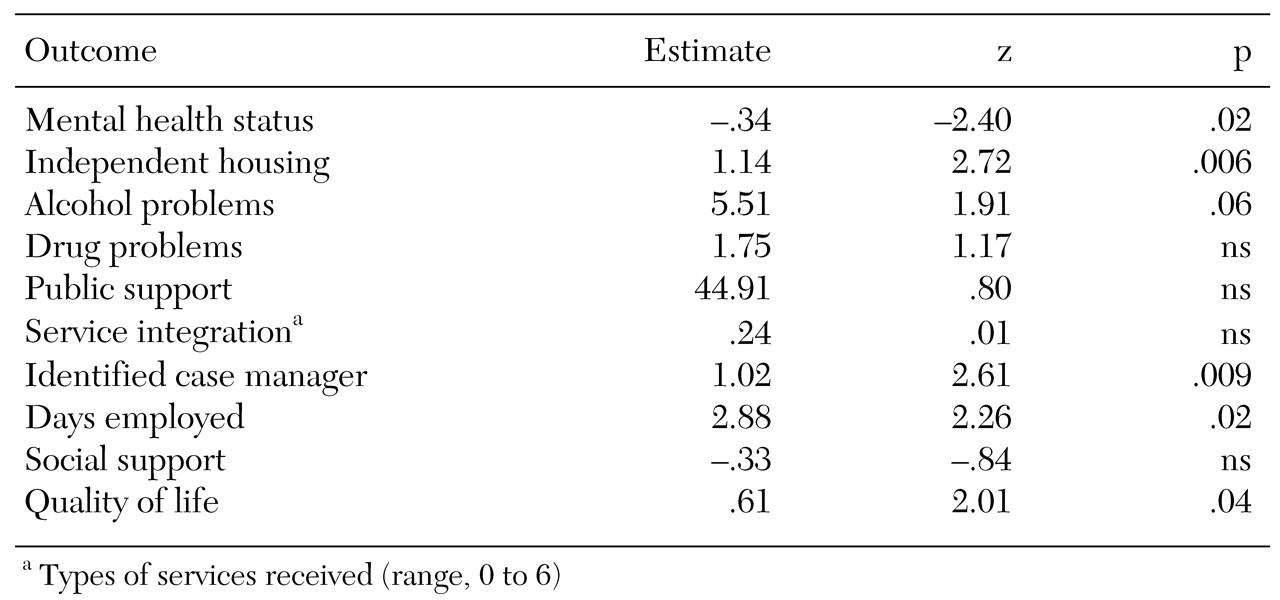
The hypothesis that client outcomes would improve as systems became more integrated (hypothesis 3) was modeled by regressing three- and 12-month client outcome measures on measures representing change in systems integration from baseline, controlling for the baseline value of the outcome variables, potentially confounding baseline covariates, the interview point (three months or 12 months), and the level of systems integration for the first cohort—that is, the baseline level of systems integration. This last term was included to adjust for the fact that sites regressed to the mean over time—that is, there was a negative correlation between baseline systems integration and the change in systems integration: r=−.39 (p<.05) for the correlation between baseline systems integration and change in integration from cohort 1 to cohort 3 and r=−.36 (p<.05) for the correlation of baseline systems integration and change in integration from cohort 1 to cohort 4.
Two sets of parallel analyses were conducted: one that addressed change in integration for the entire network (overall systems integration) and one that addressed change in the integration of relationships with the agency that was the grantee for the overall ACCESS project (project-centered integration).
Dependent measures and criteria of statistical significance. The analyses are first presented for the primary outcome measures: mental health symptoms and independent housing. Because we had four independent measures of interest—an intention-to-integrate analysis of the experimental group assignment, an analysis of the impact of implementing integration strategies, analyses of changes in integration considering measures of overall integration across all agencies in the network (overall systems integration), and the relationship of these agencies to the primary ACCESS grantee agency (project-centered integration)—a Bonferroni-corrected alpha of .006 (.05 divided by 8) was used as the criterion for statistical significance. Although this is a conservative test of significance, the fact that the sample was large increased the likelihood of significant results at this alpha level.
In addition, these same four analyses were examined for five secondary outcome measures—alcohol abuse, drug abuse, employment, social support, and subjective quality of life—and three service use measures—receipt of public support payments, client-level service integration, and a measure reflecting whether the client indicated that he or she had a primary case manager. Because this involved testing four models on a total of ten outcome measures, resulting in 40 analyses altogether, we used a Bonferroni-adjusted alpha of .00125 (.05 divided by 40) to evaluate the statistical significance of these secondary outcomes.
