In today's competitive health care environment, the use of "report cards" to compare health care programs is increasingly popular. Payers and consumers want comparative data to inform their choices about which health care plan to select. Public systems need data to monitor access and quality of care across systems. Report cards can be concise tools for presenting information and facilitating comparisons and thus have intrinsic appeal. Report cards typically rate health programs in a variety of domains, including access to care, services provided, cost, consumer satisfaction, and various other proxies for quality.
Access to care is a performance domain that most report cards rate. Access is multidimensional, and each report card measures it differently. For example, several report card entities report waiting time for appointments: the Health Employer Plan Data and Information Set (HEDIS), which is published by the National Committee for Quality Assurance; the Performance-Based Measures for Managed Behavioral Healthcare Programs (PERMS), which was created by the American Behavioral Healthcare Association; and the Mental Health Statistics Improvement Program (MHSIP), which is sponsored by the federal Center for Mental Health Services. In addition, HEDIS reports telephone response times and the availability of service providers—that is, the proportion of providers accepting new patients. PERMS reports treated prevalence rate—the proportion of enrollees using services annually, stratified by age, diagnostic category, treatment setting, and provider; the intensity of inpatient and outpatient service utilization; availability of alternatives to inpatient care; resources spent on severely and persistently mentally ill individuals; and telephone call abandonment rates. MHSIP reports access to a full range of services; access to providers who meet consumers' needs in terms of ethnicity, language, culture, age, disability (as measured by the proportion of enrollees who report not seeking services because of perceived incompatibilities); and out-of-pocket costs that do not discourage obtaining care. These programs have been reviewed elsewhere (
1,
2). The Department of Veterans Affairs (VA) National Mental Health Program Performance Monitoring System (the "VA report card") reports the treated prevalence rate for veterans in various categories of eligibility for VA services (
3).
Organizations may use report cards to measure program performance and inform quality assurance activities. Report cards also may be used to facilitate comparisons across prov-iders, programs, or organizations. A crucial issue is how to make fair comparisons of performance, given differences in case mix, such as members of one network being healthier than members of another, and in populations' health care behavior, such as use of preventive care. One technique that has been used to level the playing field when comparing outcomes is stratification based on disease severity or other patient characteristics. Another is risk adjustment—controlling statistically for population differences so that differences in outcome measures reflect differences in quality of health care received. The importance of risk adjustment for differences in patient populations is widely recognized (
4,
5,
6). Unfortunately, there is no consensus on how best to risk adjust (
4). Like report cards themselves, risk adjustment has great intuitive appeal, but the devil is in the details. Consequently, the creators of HEDIS, the most widely used set of performance indicators to assess health plans, have opted not to risk adjust (
7).
Practical considerations can make risk adjustment difficult. Information about individual risk characteristics can be difficult to obtain and expensive to collect. The identification of adequate proxies for case mix is challenging, particularly in the mental health field. Ideally, risk adjusters should be specified for each unique outcome (
5,
8), because factors affecting risk for various outcomes also vary. The most serious problem in constructing risk adjustment models is omitting factors that contribute substantially to variation in outcomes.
Educating report card users on how to interpret data accurately is another critical task (
9). Once information from report cards is in the public domain, those who developed that information cannot control its use. For example, when the New York State Health Department released in-hospital mortality rates for adults who underwent open-heart surgery (
9,
10), newspaper reports emphasized "numerical rankings of hospital performance . . . [and] made differences between hospitals of a few tenths of a percentage point appear important when the differences were not meaningful either statistically or clinically" (
9).
Although rank order provides a simple and convenient means by which to compare entities, it can lead to misleading conclusions. When scores are converted to rank order, information about the standard error around scores is lost. When variability is small, using rank order is akin to grading on a curve and assigning A's to the highest ranked and F's to the lowest, even when the entire class is doing very well or very poorly. Another common mistake in interpreting report card data is confusing statistical significance with administrative or clinical significance. Because of large samples, report cards may report differences that are statistically significant but of small magnitude and uncertain practical significance.
The Department of Veterans Affairs uses the National Mental Health Program Performance Monitoring System (the "VA report card") (
3) to rate mental health services in the 22 geographically designated Veterans Integrated Service Networks (VISNs), which cover the United States and treat more than 600,000 individuals annually. Ratings, including raw scores, risk-adjusted scores, standardized (z) scores, and rankings, are assigned in five domains: population coverage (that is, access), inpatient care, outpatient care, economic performance, and customer satisfaction. For access, the VA report card includes the treated prevalence rate for veterans in various categories of eligibility for VA services and ranks VISNs according to the percentage of veterans who receive services. These percentages are risk-adjusted by using demographic variables and distance to VA and non-VA hospitals (
3,
11). Authors include data on unadjusted and adjusted rates of access, standard deviations and coefficients of variance, and standardized scores (
3). Both ranks and standardized scores are presented because although ranks are more accessible to nonresearchers, standardized scores are a more accurate gauge of the magnitude of differences in performance. Despite the breadth of information provided, competition between regions may lead managers to focus on rank order. The VA report card was developed explicitly to compare quality in different parts of the United States and improve it where performance is below the national norm. In the VA context, we therefore focus on managers as the report card's primary audience. However, consumers and payers face parallel issues when they use report card data to compare their region's performance with national averages (in the VA context) or to choose among plans (in the private sector).
In this study, we used a measure of access to care in the VA report card to show how a seemingly modest methodological refinement—adding one variable to the risk adjustment model—can have a rather dramatic impact on report card results. This retrospective analysis extends a previous study of VA mental health report card data, adding one variable to the risk adjusters used previously (
11). We asked the following questions: Are veterans who live in counties with VA facilities more likely to use VA mental health services? How much does the presence of a VA facility contribute to the variation in access rates across counties? Does living in a county with a VA facility have the same impact on access to mental health services throughout the United States? In the course of answering these questions, we illustrate how sensitive a report card measure can be to the addition of a single variable in the risk adjustment procedure.
Methods
Sample and measures
The unit of analysis was the county in the 50 states, plus the District of Columbia and Puerto Rico (N=3,139). Access—the treated prevalence rate—was determined by dividing the number of actual service users in each category of eligibility for VA services (described below) by the number of potential service users—that is, eligible individuals—in each category residing in each county.
Although VA mental health services are available to all veterans, the VA prioritizes the delivery of services among subgroups of eligible veterans. First priority is given to veterans who receive disability compensation payments for service-connected mental illnesses. Next in priority are veterans with low incomes who do not receive service-connected disability compensation. Lowest priority is given to veterans who neither receive compensation for service-connected mental illness nor are poor. Very few individuals in this category use VA mental health services.
Data sources
Data on VA mental health service use and the number of veterans who receive compensation payments, by county, were derived from computerized VA files (
11). The number of veterans residing in each county and an estimate of the number of veterans who are eligible for VA services on the basis of income criteria were derived from 1990 U.S. census data.
Because only service users, rather than all eligible veterans, formally register at VA health centers, data on the personal characteristics of veterans who are eligible to receive services are not available at the individual level in VA data files. Census data on the personal characteristics of veterans residing in each county were used as proxies. These data include age (percentage older than 65 years of age), race (percentage black), ethnicity (percentage Hispanic), and poverty status (percentage with family income less than $10,000). The geographic accessibility of VA and non-VA services was determined by calculating the distance from the center of the veteran's zip code area to the nearest VA hospital and the nearest non-VA hospital.
Data analysis
The first set of analyses addressed two questions: Are veterans living in counties with VA facilities more likely to use VA mental health services? How much does the presence of a VA facility contribute to the variation in access rates across counties? We used analyses of covariance (ANCOVAs) to examine access to VA mental health services for veterans who reside in counties with or without VA facilities, controlling for geographic distance from the facilities. A classification variable—representing the presence or absence of a VA facility in each county—was used to distinguish counties with (N=176) and without (N=2,963) VA facilities. Covariates used to risk-adjust rates of service use were the demographic characteristics age, race, ethnicity, and poverty as proxies for demand for services (paralleling the methodology of the VA report card) and variables for geographic accessibility of VA and non-VA services.
The analysis was conducted for three groups: all veterans, veterans receiving compensation for service-connected mental illness, and veterans with low incomes. Access to general health services was examined to determine whether the impact of residing in a county with a VA facility is similar for mental and general health services.
Next, we addressed the question "How sensitive are population coverage rankings to the addition of one variable in the risk adjustment procedure? We used an ANCOVA with VISN as a class variable to stratify county-level access rates into VISN-wide (regional) rates using the demographic and geographic covariates described above. We calculated VISN-wide access rates and ranked VISNs before and after adding a variable distinguishing between counties with and without a VA facility to the risk-adjustment model. We then calculated changes in rankings between the models.
To determine whether living in a county with a VA facility has a uniform impact on access throughout the United States, we conducted a two-way ANCOVA examining the interaction between two variables: the VA geographic region (as represented by VISNs) and whether or not a county had a VA facility (a dichotomous variable).
Results
The first question we sought to answer was how sensitive a report card measure is to the addition of a single variable in the risk adjustment procedure. The rankings of the 22 geographic VA regions (VISNs) changed when a dichotomous variable accounting for the presence or absence of a VA facility by county was added to standard adjustments for demographic and geographic variables. Rankings for use of mental health services by all veterans changed substantially: seven of 22 regions (32 percent) changed five or more places in rank order. For use of general health services by all veterans, rankings for five of 22 regions (23 percent) changed by five places or more. Among low-income veterans, rankings for access to mental health services changed by five or more places in four of 22 regions (18 percent). By contrast, the rankings for access to mental health services among veterans with service-connected mental illness were more stable.
The next question we examined was whether veterans who live in counties with VA facilities are more likely to use VA mental health services than those who live in counties without such facilities.
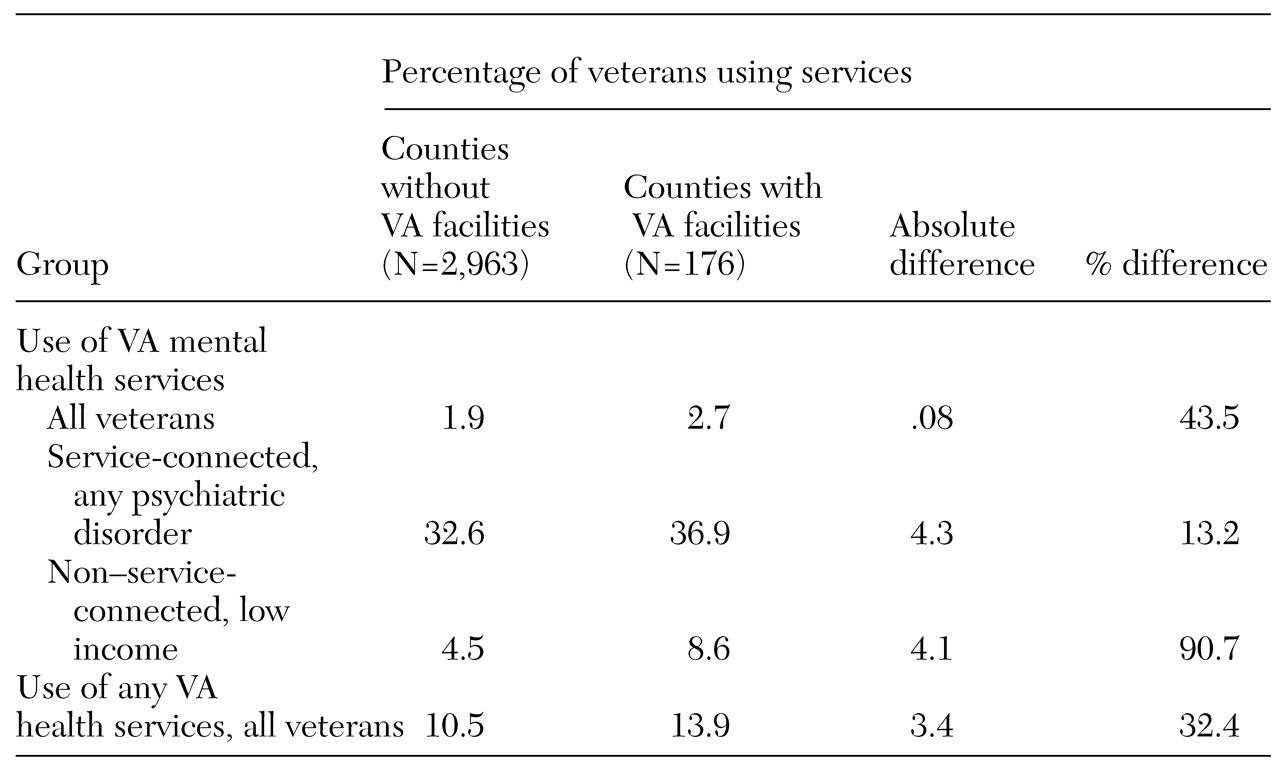
Table 1 compares treated prevalence rates from 1995 for veterans living in counties with or without VA hospitals. In every eligibility category for mental health service use—all veterans, those receiving service-connected compensation, and low-income veterans—and for veterans using general health services, access was significantly greater among veterans who live in counties with VA facilities, even after demographic factors and geographic distance from VA and non-VA hospitals were controlled for (p<.001). The comparative reduction in access to mental health services among veterans who live in counties without VA facilities was more pronounced for low-income veterans than for those receiving compensation for service-connected mental illness.
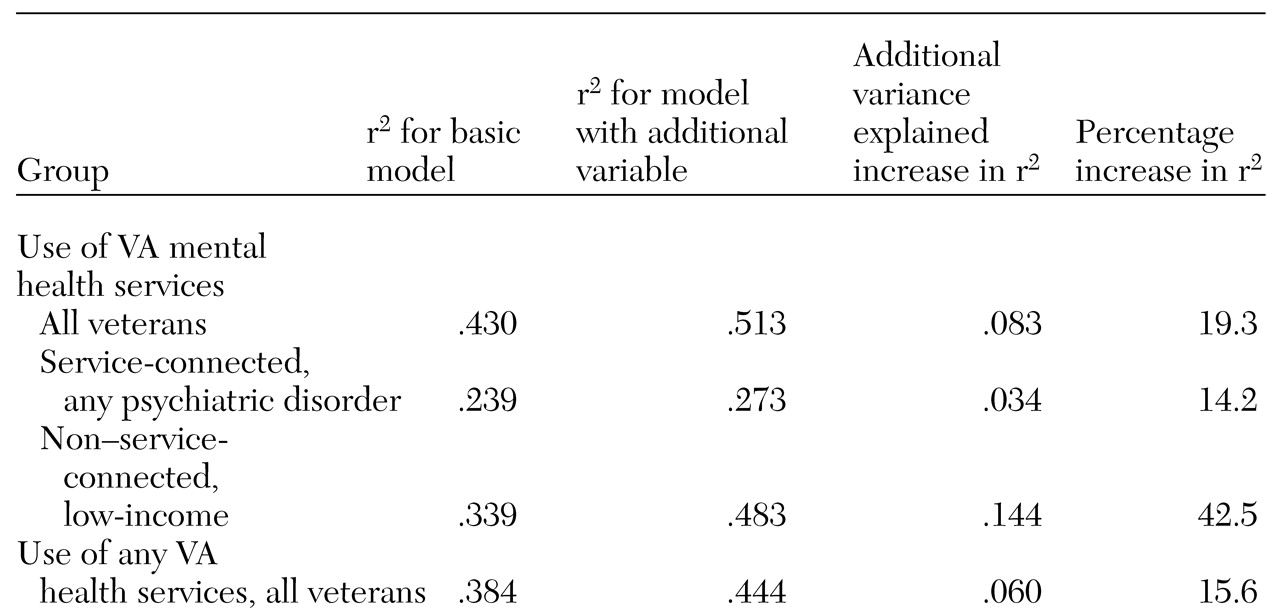
The third question we asked was how much the presence of a VA facility contributes to the variance in access rates across counties. As
Table 2 shows, adding the dichotomous variable for the presence or absence of a VA facility, by county, to the risk adjustment model improved the explained variance (r
2) of the model for all categories of veterans. Although this variable was statistically significant for all eligibility groups (p<.001), its practical significance varied. For low-income veterans, the presence or absence of a VA facility in the county explained an additional 14 percent of the variance, increasing the model r
2 from .339 to .483. For veterans receiving service-connected compensation, little additional variance was explained by living in a county with a VA facility.
The last question we sought to answer was whether living in a county with a VA facility had the same impact on access to services across VISNs—that is, across regions. The interaction between VISN and the variable representing presence or absence of a VA facility in the county was statistically significant for each eligibility category (p<.001), indicating that the impact of residing in a county with a VA facility varied across regions of the United States. In all 22 regions, access to mental health services by all veterans was higher for those who reside in counties with VA facilities, and the percentage difference ranged from 21 to 93 percent higher. Access to general health services showed a similar pattern.
Discussion
Implications for report cards
Our results suggest that caution must be used when evaluating provider performance on the basis of report card rankings alone, regardless of whether they are risk-adjusted. In this study, adding one variable—the presence or absence of a VA facility by county—to the risk adjustment model substantially changed the report card rankings. That variable accounted for an unexpectedly large amount of variance in access to VA mental health services, even after distance to VA and non-VA hospitals was controlled for.
Our results underscore the importance of using richer information conveyed by scores, standard deviations, and standardized (z) scores rather than focusing on rank order alone. Although some report cards present only ranks, the VA report card also presents average standardized scores so that managers can examine quantitative differences between programs as well as their ranks. Because they are simple and nontechnical, ranks get VA managers' attention and may encourage them to use data. There may be a trade-off between simplicity and precision, however, and reliance solely on rank order can lead to inaccurate conclusions. The creators of report cards must educate managers and other report card users to attend to more detailed data, such as scores, coefficients of variance, and standardized scores. This task is difficult, given competing demands on managers' time and varying degrees of interest in the quantitative aspects of report card data, with all their complexity. For report cards whose users are primarily purchasers or consumers of health care services, similar caveats apply. There may be instances in which reporting the simplest measure—rank order—may invite misunderstanding.
Experts disagree about whether it is helpful to include ranks when means are close and variation within regions is high. In situations in which real differences between programs are small, the inclusion of ranks may get users' attention, but it carries the risk of fostering inaccurate conclusions. Eliminating ranks to minimize the misuse of the data may risk users' ignoring the data altogether. When the Public Citizen Health Research Group and the National Alliance for the Mentally Ill rated and ranked state mental health systems in 1986 and 1988, Hawaii was ranked 51st (
12). An entire issue of the
Hawaii Medical Journal subsequently was devoted to examining health services for the severely mentally ill in Hawaii. Other states with low scores do not seem to have paid similar attention to the issue, suggesting that the impact of ranking last triggered scrutiny in Hawaii. Hawaii's ranking 51st may have been an artifact, however. One of the report's authors acknowledged, "It is possible that in 1986 [Hawaii] should have been as high as 44th" (
13)—that is, the performance of seven other states may have been indistinguishable from Hawaii's.
One solution may be for creators of report cards to determine whether groups differ significantly for a given performance measure by using a procedure such as ANOVA, then conducting post hoc means tests to establish where there are statistically significant differences between specific programs, such as programs with adjacent ranks. The post hoc tests quantify the difference between means that must be exceeded for the difference to be statistically significant. This number could be included in published report cards as a yardstick, along with means and ranks. Report card users equipped with this information could then see whether differences in means for programs of nearby ranks exceed the size of the yardstick and hence are discriminately different statistically. Finally, clinically or administratively significant differences between programs should be distinguished from those whose statistical significance is driven by large sample sizes but whose magnitude is small.
Access to care
Previous studies have documented the impact of geographic proximity on access to mental health care (
11,
14) and on access to general medical care for patients with psychiatric disorders (
15). Hence our finding of higher access rates among veterans who live in counties with VA facilities was not surprising. That these differences persisted after we controlled for distance from VA and non-VA health care facilities was unexpected. Possible explanations include the likelihood that transportation barriers are greater between than within counties, because public transportation is often organized on the county level. Topography may matter, since county lines often follow natural barriers such as rivers or mountains. Psychological factors, including the perception that a VA facility in one's home county is part of one's own community, may affect service use.
Low-income veterans exhibit greater "elasticity" in their access to VA mental health services on the basis of residence in a county with a VA medical center than do veterans receiving compensation for service-connected mental illness. Veterans who receive compensation for psychotic disorders or posttraumatic stress disorder are less elastic in their access to services than are veterans who have service-connected status for other psychiatric disorders (data not shown). This finding suggests that veterans with more severe disorders or specialized needs are likely to seek treatment within the VA system, regardless of whether a VA facility is located in their home county. By contrast, low-income veterans may choose the most conveniently located services and not seek out VA services across county lines.
Limitations
Counties were categorized as having or not having VA facilities without any knowledge of the types of services offered at each facility. Although some facilities lack specific psychiatric services, the vast majority have them, and the sample size of more than 3,000 counties was thought to be sufficient to observe the effect we were interested in, despite the possibility of a few misclassifications. Similarly, community-based VA clinics were relatively uncommon in 1995 (
16), so excluding them is unlikely to have affected our results. Second, adjustments for demographic factors were made on the basis of 1990 census data, but service use data are from 1995. Population shifts in those five years could have affected counties with or without VA facilities differently, although such shifts are unlikely to have been substantial. Third, the risk adjustment model may have failed to account for additional risk factors affecting access that are outside providers' control—for example, other local conditions such as the level of non-VA inpatient and outpatient mental health services available. The presence of a VA facility may itself be a proxy for another characteristic affecting access.
Risk adjustment is a tool that facilitates comparisons among providers. It can correct for disparities in demographics or geography that may be outside managers' control, but it cannot correct actual disparities in access or outcomes for people with health care needs. Finally, it should be reiterated that treated prevalence is only one aspect of access to care.
Conclusions
Because report card data are quantitative, they have the appearance of objectivity. As this study demonstrated, however, changing the risk adjustment model by only one variable can substantially shift rankings. When publishing report cards, it would be helpful to include the results of sensitivity analyses to indicate how much the results would change under different reasonable assumptions. When rankings are volatile and reshuffle substantially when modestly different models are used, the validity of ranking performance is debatable. Decision makers should be mindful of the limitations of current methodologies and avoid inadvertently rewarding or punishing programs on the basis of artifactual differences. Our results emphasize the importance of attending to observed and adjusted scores, along with standard deviations, rather than to rank order alone and highlight the need to educate users of report card data—including consumers, payers, and administrators—in their interpretation and limitations.
Understanding the dynamics governing service use is helpful in locating new clinics and closing or consolidating old ones. Our results suggest that county boundaries should be taken into consideration when VA clinics are to be opened or shut down. Because low-income veterans appear less likely to seek out VA services across county lines, outreach programs could target low-income veterans who live in highly populated counties without VA medical facilities.
Acknowledgments
The authors thank Leonard Katz, Ph.D., for statistical assistance. This work was supported by the Mental Illness Research, Education, and Clinical Centers of Veterans Integrated Service Networks 3 and 1 and the Northeast Program Evaluation Center.