In 2002 an estimated 110.2 million visits were made to U.S. emergency departments, or about 38.9 visits per 100 persons in the United States (
1). Paradoxically, although the number of emergency department visits increased by 20 percent over the past decade, the number of emergency care facilities nationwide decreased by approximately 15 percent, breeding serious overcrowding (
2). Although small-scale studies have shown a positive relationship between frequent attendance at emergency departments and psychopathology (
3,
4), the net contribution of mental illness to global utilization and overcrowding of these facilities is largely unknown.
What is known is that mental illness is highly prevalent, disabling, and costly, in both human and economic terms (
5,
6,
7), constituting the second largest disease burden in the United States (
3). Estimates from both the National Comorbidity Survey (
5) and the National Institute of Mental Health Epidemiologic Catchment Area Program (
8) suggest that 28 to 30 percent of adult Americans suffer at least one mental disorder every year, but fewer than one-third of those affected ever receive specialty mental health services. Studies of U.S. children similarly demonstrate that more than 20 percent of nine- to 17-year-olds have a diagnosable—but seldom-treated—mental disorder (
9). Given these prevalence data and the unprecedented growth in emergency department demand, it is plausible that many patients who use emergency services are experiencing significant primary and comorbid psychopathology (
10,
11).
Although a handful of previous studies have suggested that the numbers of psychiatric emergency visits is increasing (
12), only two have examined the epidemiology of mental health-related emergency visits nationwide across a wide spectrum of disorders. The first, by Sills and Bland (
13), focused solely on children and was largely cross-sectional. The second, by Hazlett and colleagues (
14), examined trends in "psychoses and neuroses" for adults only. Both studies excluded Hispanics, certain demographic groups, psychiatric reason-for-visit codes, and standard classifications of axis I mood and anxiety disorders, seriously undercounting mental health visits. Moreover, previous studies have indiscriminately used
ICD codes outside of the normative
DSM-IV-based system (
15), incorporating such diagnoses as postconcussive syndrome, enuresis, and sexual dysfunction (
13,
14).
A more comprehensive approach using National Hospital Ambulatory Medical Care Survey (NHAMCS) data would include all potentially relevant diagnostic fields, including psychiatric reason-for-visit codes, DSM-based ICD diagnoses, Supplementary Classification of Factors Influencing Health Status and Contact with Health Services (V codes), and external cause-of-injury codes (E codes) for all appropriate mental health-related disorders. Given methodologic, demographic, and chronologic gaps in previous prevalence estimates, and given the fact that record-breaking numbers of patients are seeking emergency services nationwide, we sought to identify recent trends in mental health visits to U.S. emergency departments by using a national probability sample.
Methods
Begun in 1992 as part of the ambulatory component of the National Health Care Survey, the NHAMCS' emergency department survey measures use of emergency health care services by employing a four-stage probability sample of visits to noninstitutional general and short-stay hospitals, excluding federal, military, and Veterans Affairs facilities, in the United States (
16,
17,
18,
19,
20,
21,
22,
23). Conducted annually, the NHAMCS covers geographic primary sampling units, hospitals within primary sampling units, emergency departments within hospitals, and patients within emergency departments. Data are collected by hospital staff during annual, randomly assigned, four-week data periods and are coded by using
ICD-9-CM (
24). We used the most recent emergency department component of the NHAMCS available (1992 to 2001).
To maximize case finding, mental health-related emergency department visits were included if their records met any one of three criteria:
DSM-IV-TR-based, major mental health problems (
ICD-9-CM diagnoses 290.0 to 305, 307 to 310, or 311 to 319.0 or V codes 61.1 to 71.02); National Center for Health Statistics (NCHS)-assigned reason-for-visit classification codes related to mental health (
25) (1100.0 to 1199.9); or injury E codes related to suicide (E950.0 to E959.9). Otherwise, visits that did not meet at least one of the above criteria were deemed non-mental health visits.
ICD-9-CM codes in the range of 290 to 319 were excluded if they lacked corresponding
DSM-based diagnosis—for example, psychosexual disorders (
ICD code 302), sleeping disturbances (code 307.4), physiological malfunction (code 306), postconcussive syndrome (code 310.2), nondependent tobacco use disorder (code 305.1), and enuresis and encopresis (codes 307.6 and 307.7).
Mental health-related visits were assigned specific DSM-IV-compatible categories as follows: mood disorders (ICD or DSM-IV codes 296 to 296.9, 300.4, or 311)—for example, major depressive disorder, depression not otherwise specified, dysthymia, bipolar disorder, other mood disorders, and NCHS reason-for-visit code 1110.0 (depression); anxiety disorders (ICD or DSM-IV codes 300.00 to 300.61 except 300.4 [dysthymia])—for example, generalized anxiety disorder, panic disorder, obsessive-compulsive disorder, posttraumatic stress disorder, acute stress disorder, agoraphobia, anxiety not otherwise specified, and NCHS reason-for-visit code 1100.0 (anxiety and nervousness) and 1105.0 (fears and phobias); psychotic disorders (ICD or DSM-IV codes 295 to 295.9, 297.3, 298.8, or 298.9)—for example, schizophrenia, psychosis, and NCHS reason-for-visit code 1155.0 (delusions or hallucinations); substance-related conditions (ICD or DSM-IV codes 290.44 to 292.94 or 302.89 to 305.98)—for example, alcohol and other substance abuse—and NCHS reason-for-visit code 1145.0 (alcohol-related problems) or 1150.0 (abnormal drug use); suicide attempts or ideation (ICD-9 E codes 950 to 959) and NCHS reason-for-visit code 5820.0 (suicide attempt) or 5820.1 (intentional overdose); miscellaneous disorders (ICD-9 V codes 61.1 to 71.09)—for example, adjustment disorders and problems in living—and NCHS reason-for-visit classification 1130.0 (behavioral disturbances) and 1165 (other symptoms or problems relating to psychological and mental disorders not elsewhere classified).
Absolute numbers of emergency department visits were estimated by using census-based, NCHS-assigned patient weights rounded to the nearest thousand. Emergency department visit rates per population were calculated by using denominator estimates of the civilian, noninstitutionalized U.S. population from the U.S. Census Bureau, which were adjusted for underenumeration (
26).
We analyzed visit rates by age, sex, race or ethnicity (white non-Hispanic, black non-Hispanic, other, and Hispanic). Although NHAMCS data contain imputed ethnicity for 1992 to 1996 in the public use files, we did not include any imputed or missing data in the ethnicity subanalysis. We also analyzed mental health-related visits by insurance status, location in a metropolitan statistical area (MSA), and region of the country (the Northeast, the Midwest, the South, and the West). MSA and U.S. region categories represent standardized geographic divisions defined by the U.S. Census Bureau (
26).
Visits were further analyzed by urgency at triage. For 1992 to 1996, visits were classified as either urgent or nonurgent, but this coding system changed in 1997. For consistency, we coded visits that occurred from 1997 to 2001 as nonurgent or nonemergent if the expected triage time was recorded as more than one or two hours.
Confidence intervals (95 percent CIs) for visit rates were calculated by using the relative standard error of the estimate, controlling for weighting, four-stage sampling, and cluster effects with use of generalized estimating equations from SUDAAN-8.0. In accordance with NCHS recommendations (
27,
28), only estimates for which the relative standard error was less than 30 percent and for which there were more than 29 raw data records in the cell are reported here. The least-squares method of linear regression was used for analysis of trends with use of STATA 7.0, with p<.05 considered statistically significant. Differences in continuous variables were assessed by using two-tailed independent-samples t tests or repeated-measures analysis of variance. Significance testing for multiple comparisons between groups were corrected by using the method of Bonferroni.
Results
Overall trends in use
From 1992 to 2001 an estimated 974 million visits were made to emergency departments in the United States. Of these visits, 52.8 million (CI=49.7 to 55.9 million), or 5.4 percent (CI=5.1 to 5.7 percent), were due primarily to mental health problems, as defined by either the patient's reason-for-visit code (50 percent) or the clinician's diagnostic codes (84 percent); 34 percent of visits met both criteria.
Although the annual number of overall emergency department visits increased by 20 percent over the decade, the per-person trend for mental health-related visits increased by nearly 40 percent, from 17.1 visits per 1,000 persons in 1992 to 23.6 visits per 1,000 persons in 2001 (p for trend<.001). The corresponding proportion of visits due to mental illness increased by 28 percent, from 48.7 per 1,000 emergency department visits in 1992 to 62.5 in 2001 (p for trend=.003).
Mental health case mix
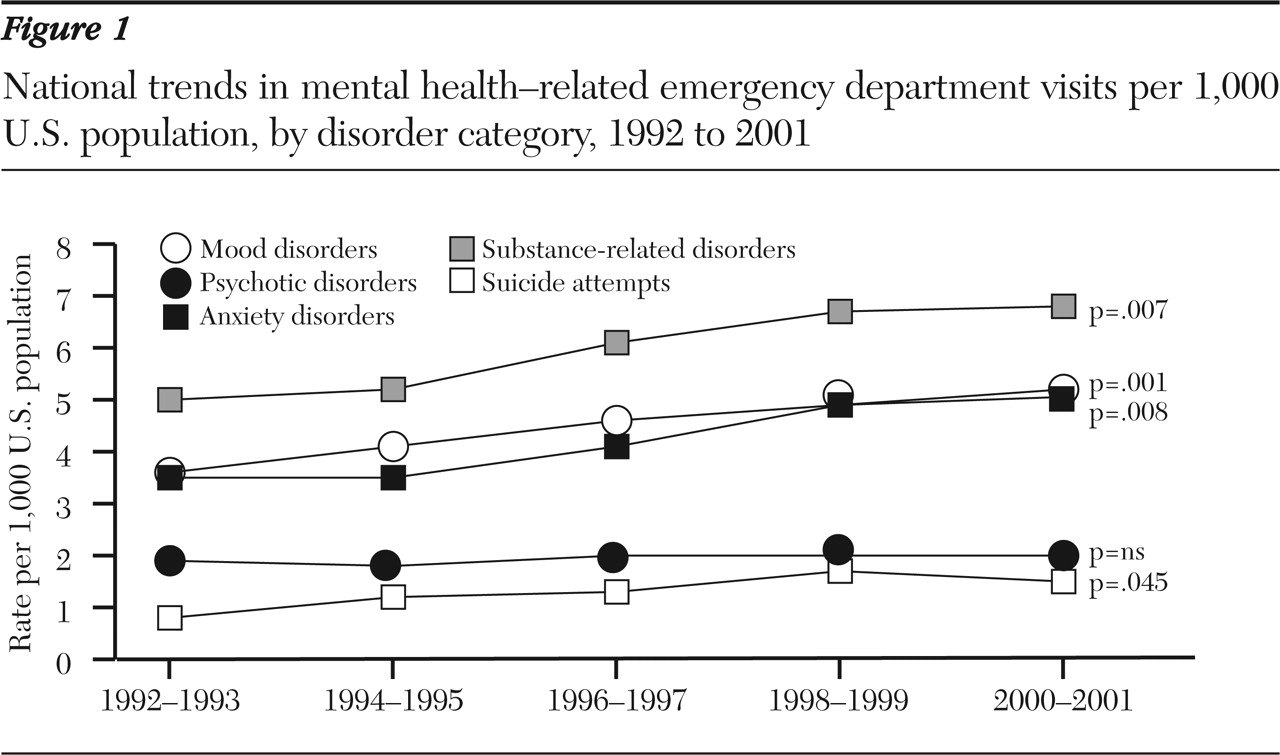
An estimated 17 million visits were for a mental health-related primary complaint (that is, as conveyed to the clinician by the patient), but many more involved a psychiatric diagnosis (that is, the assessment of the patient's condition by the clinician). Among the estimated 53 million mental health-related visits overall, the most common diagnoses were substance-related disorders (30 percent), mood disorders (23 percent), and anxiety disorders (21 percent). Psychoses constituted 10 percent and suicide attempts 7 percent of all documented mental health-related visits. These five major subgroups accounted for 79 percent of all mental health-related visits. The remaining or miscellaneous category includes all other
DSM diagnostic codes and reason-for-visit codes referable to other psychological and mental disorders; miscellaneous mental health-related visits increased significantly over the decade (p=.003). The decade's upward trend in number of visits related to specific mental health problems was significant for all previously identified categories of disorders except psychoses (
Figure 1).
Age, gender, and race or ethnicity
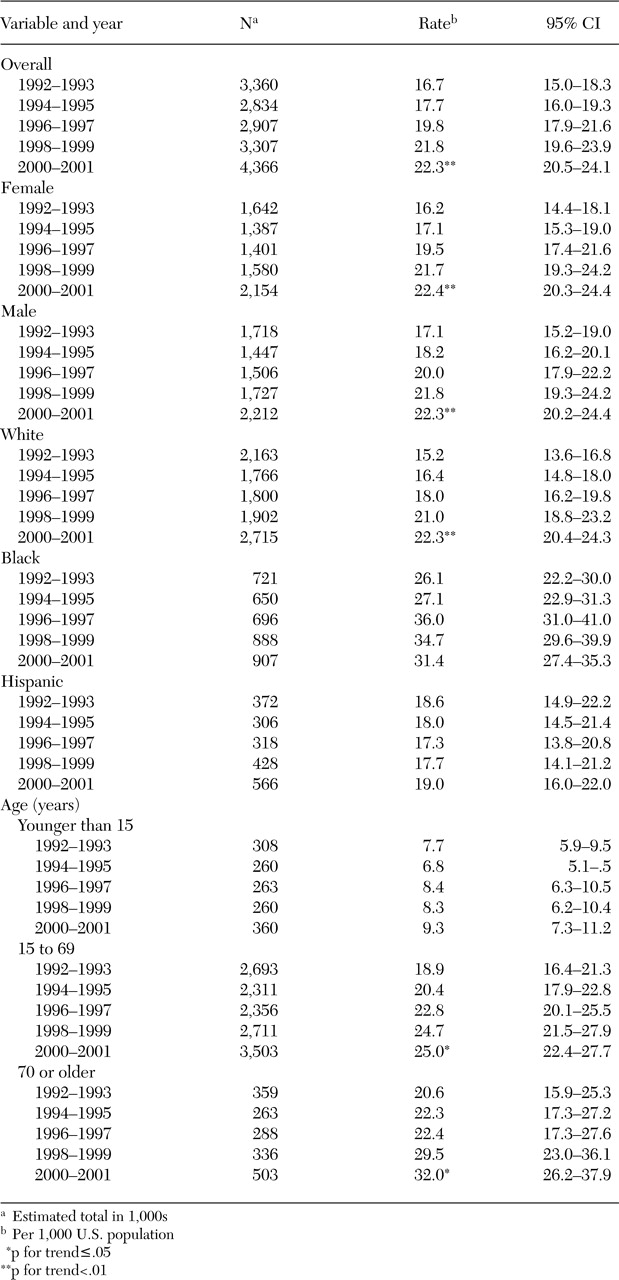
Overall the mean age of patients who made mental health-related visits was 39.5 years, with a significant increase from 38.2 to 40.7 years over the decade (p for trend=.001). Trends in mental health-related visits reveal significant increases for all age strata over 15 years (
Table 1), but the increase was most profound for the over-70 group—an increase from 20.6 to 32.0 visits per 1,000 population and from 46.4 to 64.1 mental health-related visits per 1,000 emergency department visits over the decade (p=.02, for both).
The increasing trend in mental health-related visits was also significant and consistent between the sexes over time, with the number of males escalating from 17.1 to 22.3 per 1,000 and of females increasing from 16.2 to 22.4 per 1,000 over the decade (p for trend=.002 for both).
Table 1 shows that black non-Hispanics had the highest population-based rate of mental health-related visits overall (31.2 per 1,000); non-Hispanic whites had the second highest rate (18.6 per 1,000). An increasing trend for mental health visits by ethnicity was significant for non-Hispanic whites only, for whom all types of mental health-related visits increased except those related to psychoses.
Geographic and regional trends
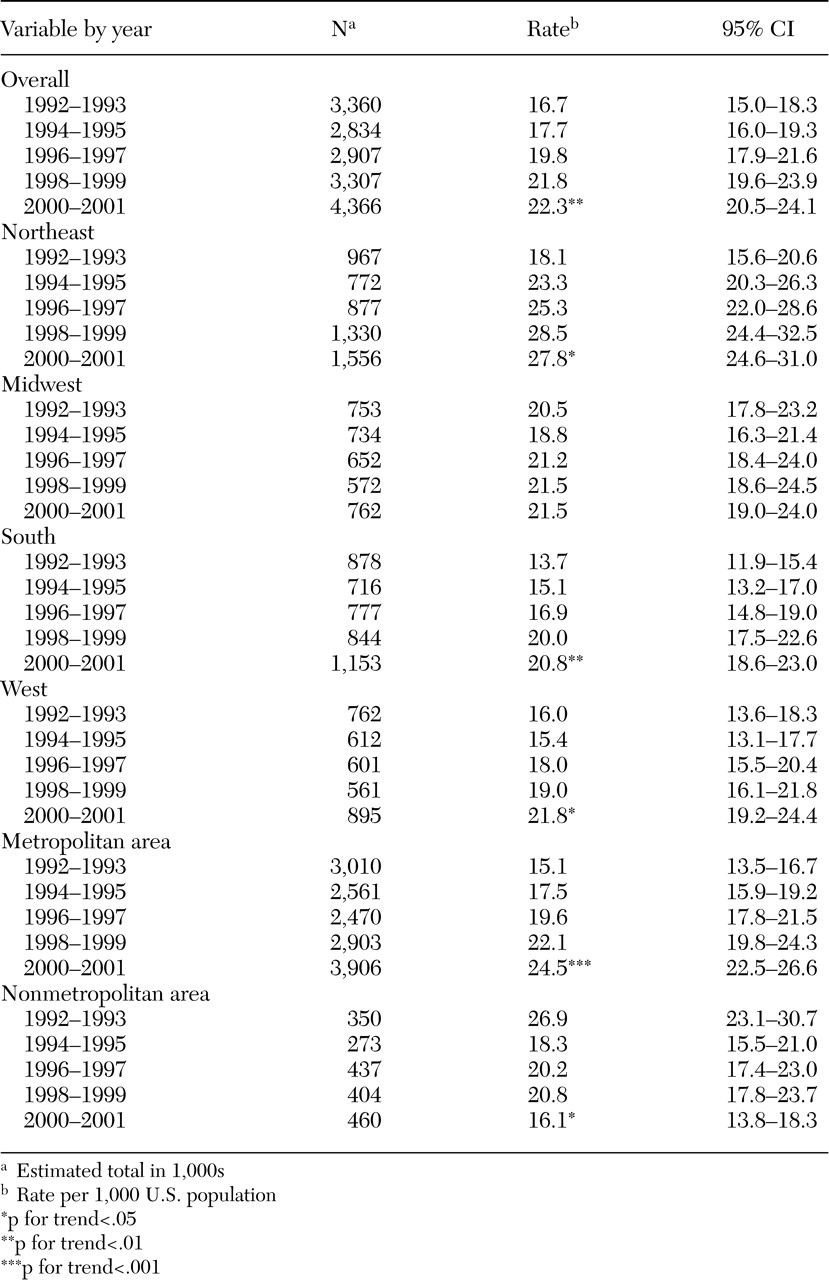
Urban versus rural. Although the overall proportion of mental health-related visits was similar for both metropolitan and nonmetropolitan emergency departments, their trends were reciprocal (
Table 2). Urban-visit population rates increased from 15.4 per 1,000 in 1992 to 25.8 per 1,000 in 2001 (p for trend<.001), in inverse proportion to the falling nonurban rates. By contrast, the population rate of rural visits decreased markedly across the decade from 30.7 to 16.7 visits per 1,000 (p for trend=.035). The decrement in rural visits was especially significant for psychotic disorders (p for trend<.05).
Regional variation. The proportion of mental health-related visits in emergency departments in the Northeast and the West were comparable at 6.6 percent and 6.0 percent of all visits, respectively, and were significantly higher than the 5.0 percent and 4.7 percent rates in the Midwest and the South. Higher rates in the West and the Northeast were due in part to higher rates of substance-related visits. There were also more suicide-related visits in the West than in the South. Per population, the Northeast had significantly more anxiety-related visits than the West and significantly more mood-related visits than either the South or the West.
Over the decade, all regions saw significant increases in population-based mental health-related visits except the Midwest. In population terms, the Northeast saw an increase from 17.2 to 29.2 visits per 1,000 (p for trend=.02). The South and the West also incurred significant increases in mental health visits of 61 percent over the decade (13.7 to 22.1 per 1,000 population) and 34 percent (17.2 to 23.0 per 1,000), respectively (p for trend<.01).
Because case mix did not account for all the variation in regional demand, data were obtained from the American Psychiatric Association and the American Medical Association to determine the density of psychiatrists over each U.S. region for the period 1992 to 2000 (
29). Census data were then used to calculate the number of psychiatrists per 1,000 population over time. Although the trend in the number of practicing psychiatrists per region was flat for the decade, it was highest in the Midwest, at 11.2 per 1,000 population. The South, the West, and the Northeast had fewer at 10, 8.1, and 5.1 psychiatrists per 1,000 population, respectively.
Visit, medication, and disposition trends
In aggregate, no variations in mental health-related visits were observed over the decade by month of the year or day of the week. However, there were variations by time of day: 46 percent of all mental health-related visits occurred between 4 p.m. and midnight, 37 percent between 8 a.m. and 4 p.m., and 17 percent between midnight and 8 a.m. More than half these cases (57 percent) were deemed urgent; this designation was lowest for anxiety (55 percent) and highest for suicide-related visits (77 percent) and did not change over time.
Medication trends
Most patients (61 percent) who were treated during mental health-related visits received medication at an average rate of 1.5 medications per visit. Use of psychotropic drugs increased significantly over the decade, from 20 percent to 31 percent of all mental health-related visits across the decade (p for trend<.001). Antipsychotics, anxiolytics or hypnotics, and antidepressants were given to 11 percent, 18 percent, and 6 percent of patients who made mental health-related visits, respectively. The next most common class of medication used was analgesics, given to 18 percent (CI=16 to 20 percent), but trends for analgesic use (17 to 22 percent, p=.12) did not match the 50 percent increase seen in the use of psychotropic medication over time.
Insurance status
Of all mental health-related visits, 29 percent were funded from the private sector and 37 percent from the public sector. Over the decade, a significantly increasing share of all private-sector and Medicare emergency department visits were mental health related, increasing from 3.4 to 4.5 percent and from 5.8 to 7.8 percent, respectively (p for trend=.01, for both).
The proportion of unfunded or self-pay mental health-related visits ranged from 19 percent to 24 percent throughout the decade and had not increased significantly by the end of 2001 (20 percent).
Discussion and conclusions
In 1980 the National Medical Care Utilization and Expenditure Survey showed that approximately 11 percent of the U.S. population visited an emergency department annually (
30). Twenty years later, the National Health Interview Survey reported that this proportion had doubled (
31). Although overall use of U.S. emergency department services increased by 8 percent from 1992 to 2001, the number of documented mental health-related visits increased at an even faster rate—by 38 percent, from 4,371,112 to 6,721,540 visits across the decade.
Current trends in emergency department oversubscription and overcrowding stem from a complex array of micro- and macroeconomic forces. At the patient level, a lack of insurance, social support, and alternatives to care, coupled with the convenience of 24-hour accessibility to the emergency department, are major incentives for both the worried well and the acutely psychotic patient to rely on emergency-based care (
32,
33).
At the macroeconomic level, there is a parallel reduction in the intensity of treatment that is commonly available for mental illness and in the proportion of the U.S. health care budget spent on mental health care (
34). In addition, under the Emergency Medical Treatment and Active Labor Act (EMTALA), any hospital that accepts Medicare funding must screen and stabilize all patients who present for care, regardless of the patients' ability to pay (
35,
36). Because of this unfunded mandate, many hospitals have closed their emergency departments, resulting in fewer resources and more overcrowding for all concerned (
37,
38). Because patients with mental illness may be particularly challenged to negotiate a health care system that is increasingly crowded (
39), outpatient (
40), and plagued with resource scarcity, the rates of both mental health-related visits and patients who leave the emergency department before being seen have increased significantly over time.
There are many possible explanations for a disproportionate increase in mental health-related emergency visits, including diminishing access to mental health care, increasing rates of mental illness in the overall population, enhanced diagnosis of mental illness through increasing use of board-certified emergency physicians and emergency department-based mental health professionals, shrinking alternative treatment resources, and increasing fragmentation and out-of-pocket payments for mental health care under managed care.
In an unweighted, non-
DSM-based analysis of raw numbers of emergency mental health-related visits, McAlpine and Mechanic (
41) suggested that the uninsured were largely responsible for the increasing burden of such visits. However, our data show that when population rates are examined, the greatest proportional increases in visits over the past decade were actually among individuals who had insurance. Increasing visit rates for insured and uninsured patients are more likely explained by systemwide shifts to managed mental health care and increasing reliance on emergency departments for the only 24-hour universally open-access health care in the United States (
34,
40,
42,
43,
44).
In regional terms, the Northeast experienced an inverse relationship between supply of mental health providers (psychiatrists and psychologists) and demand for emergency department mental health care. The Midwest, having the highest number of psychiatrists per capita, experienced no increase in mental health-related visits across the decade, suggesting possible threshold effects at 11 providers per 1,000 population. Further explication of this phenomenon would require extending Wennberg's analyses of local norms to regional populations (
45,
46), but diminished access to psychiatric services may account for some of the observed regional variation in mental health-related use of the emergency department.
This analysis had several limitations, including the reporting biases resulting from the fact that 20 to 45 percent of U.S. emergency departments are still staffed by non-board-certified emergency physicians or midlevel providers; others have shown that even highly trained physicians are notoriously poor at making accurate mental health diagnoses (
11,
47,
48,
49,
50,
51). Second, the NHAMCS data on mental health diagnoses are obtained by retrospective review of records (
52). In the absence of validated screening instruments, inaccuracies are likely, and only the most obvious diagnoses may ever be recorded. It is also a limitation that we could not determine the frequency of multiple visits. It is well known that a small proportion of patients may account for a large number of visits, a result of both dual diagnoses and recidivism (
53). To control for undercounting, we also used reason-for-visit and injury E codes to attempt to include as many mental health patients as the data would allow. Previous work in assessing occult mental health problems suggests that undercounting is more likely to occur than overcounting in U.S. emergency departments (
49).
Despite its shortcomings, this is one of the first studies to show prevalence and trends in mental illness in a representative national sample of U.S. emergency department visits. Consistent increases in use of emergency departments by mental health patients show no sign of abatement. As the nation's emergency safety net frays in the wake of severe overcrowding, vulnerable persons with mental illness are likely to suffer the most. In addition, an increasing reliance on emergency care has important policy implications for the entire health care system. Future work must build on these national data to find cross-cutting solutions that address important barriers to care for persons with mental illness and the gaps between the fields of emergency medicine and mental health.


