Universal health care insurance was established in Canada to ensure equitable access to health care for all Canadians. In Ontario all legal residents are eligible for the provincial health plan, which fully covers medically necessary health services for both physical and mental problems without copayments and deductibles. In many respects this system is effective. Groups with lower socioeconomic status, which are known to have higher levels of morbidity, also tend to have higher rates of health care use (
1,
2). However, several Canadian studies have shown socioeconomic disparities in rates of use for a variety of health services despite universal coverage (
2,
3,
4,
5).
In the case of mental health care, groups with lower socioeconomic status have greater mental morbidity and therefore greater need for mental health care (
6,
7,
8). Despite the increased need for services in lower socioeconomic status groups, in many settings it is the members of higher socioeconomic groups who receive more services. This disparity has been demonstrated for mental health specialty services in several U.S. health settings (
9,
10,
11,
12,
13) and in a variety of other health systems (
8,
14,
15,
16).
In Canada, the situation is less clear. Under universal coverage of fee-for-service health care in Canada, four studies have reached different conclusions about socioeconomic disparities in mental health service use. Both Lin and colleagues (
17) and Alegria and colleagues (
8) used community survey data to demonstrate that rates of outpatient service use by financially disadvantaged groups were not significantly lower than those of groups that were not financially disadvantaged. Using the same data, Katz and colleagues (
18) demonstrated that lower education levels were associated with lower rates of use of ambulatory mental health services. However, like Alegria and Lin, Katz (
18) found no significant association between income level and level of service use. Finally, Tataryn and colleagues (
19) found evidence of an association between income level and service use. He used administrative data to show that in urban areas of the province of Manitoba, ambulatory psychiatric care was provided more often to residents of wealthier neighborhoods.
The Canadian survey and administrative data used in the previously described papers on mental health service use are more than 15 years old. In the 1990s, significant efforts were made to destigmatize mental illness through public education campaigns. These efforts may have altered patterns of mental health service use over the past decade (
12). We used administrative data from 2000 to test the null hypothesis that individuals from neighborhoods with higher socioeconomic status have no greater use of mental health services than those from neighborhoods with lower socioeconomic status under universal coverage of fee-for-service health care.
Results
There were 1,257 enumeration areas within the geographic boundaries of our study area. We excluded 14 enumeration areas with missing education information and 22 enumeration areas with billing information for fewer than 50 residents, leaving 1,221 enumeration areas for analysis. Each contained a mean±SD of 639±263 residents (range of 97 to 1,549 residents).
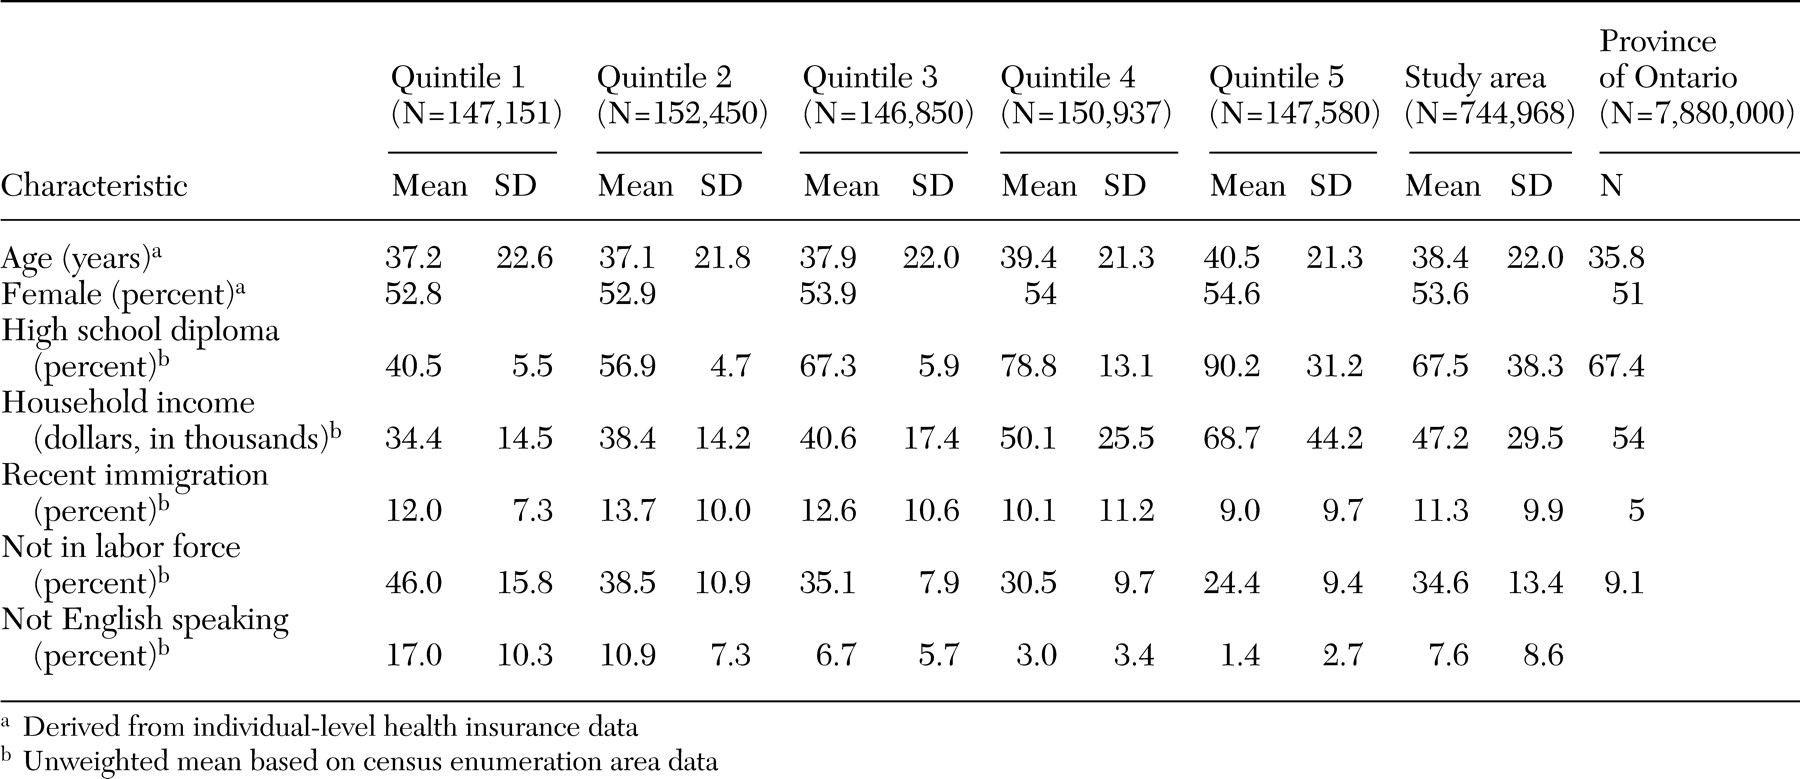
Table 1 shows the demographic characteristics of the study area by quintile and comparison characteristics for the province of Ontario.
The total number of ambulatory claims (including both mental health and non-mental health claims) was 5,832,601, and the total number of individuals who had an ambulatory claim in 2000 was 746,141. The average number of ambulatory health claims per person was 7.8. On average, females had more claims per person (mean of 8.4±9.7 claims) than males (mean of 7.1±9.0 claims). Individuals from the neighborhoods with the highest socioeconomic status had a similar number of claims per person as individuals from the neighborhoods with the lowest socioeconomic status.
In our study area, 36,428 individuals saw a psychiatrist and 135,726 individuals saw a family physician for mental health services. There were 433,882 ambulatory psychiatric claims (mean of 12.0±19.3 per mental health service user who saw a psychiatrist), and 464,436 mental health claims were submitted through a family physician (mean of 3.4±6.6 per mental health service user who saw a family physician). Of the psychiatric claims, 74,769 (17.2 percent) were for psychotic disorders, 352,024 (81.1 percent) were for nonpsychotic disorders, 4,818 (1.1 percent) were for addictions, and 2,271 (.5 percent) were for social problems. Of the mental health claims submitted through a family physician, 21,492 (4.6 percent) were for psychotic disorders, 353,039 (76.0 percent) were for nonpsychotic disorders, 66,190 (14.3 percent) were for addictions, and 23,715 (5.1 percent) were for social problems.
Use of specialty mental health services
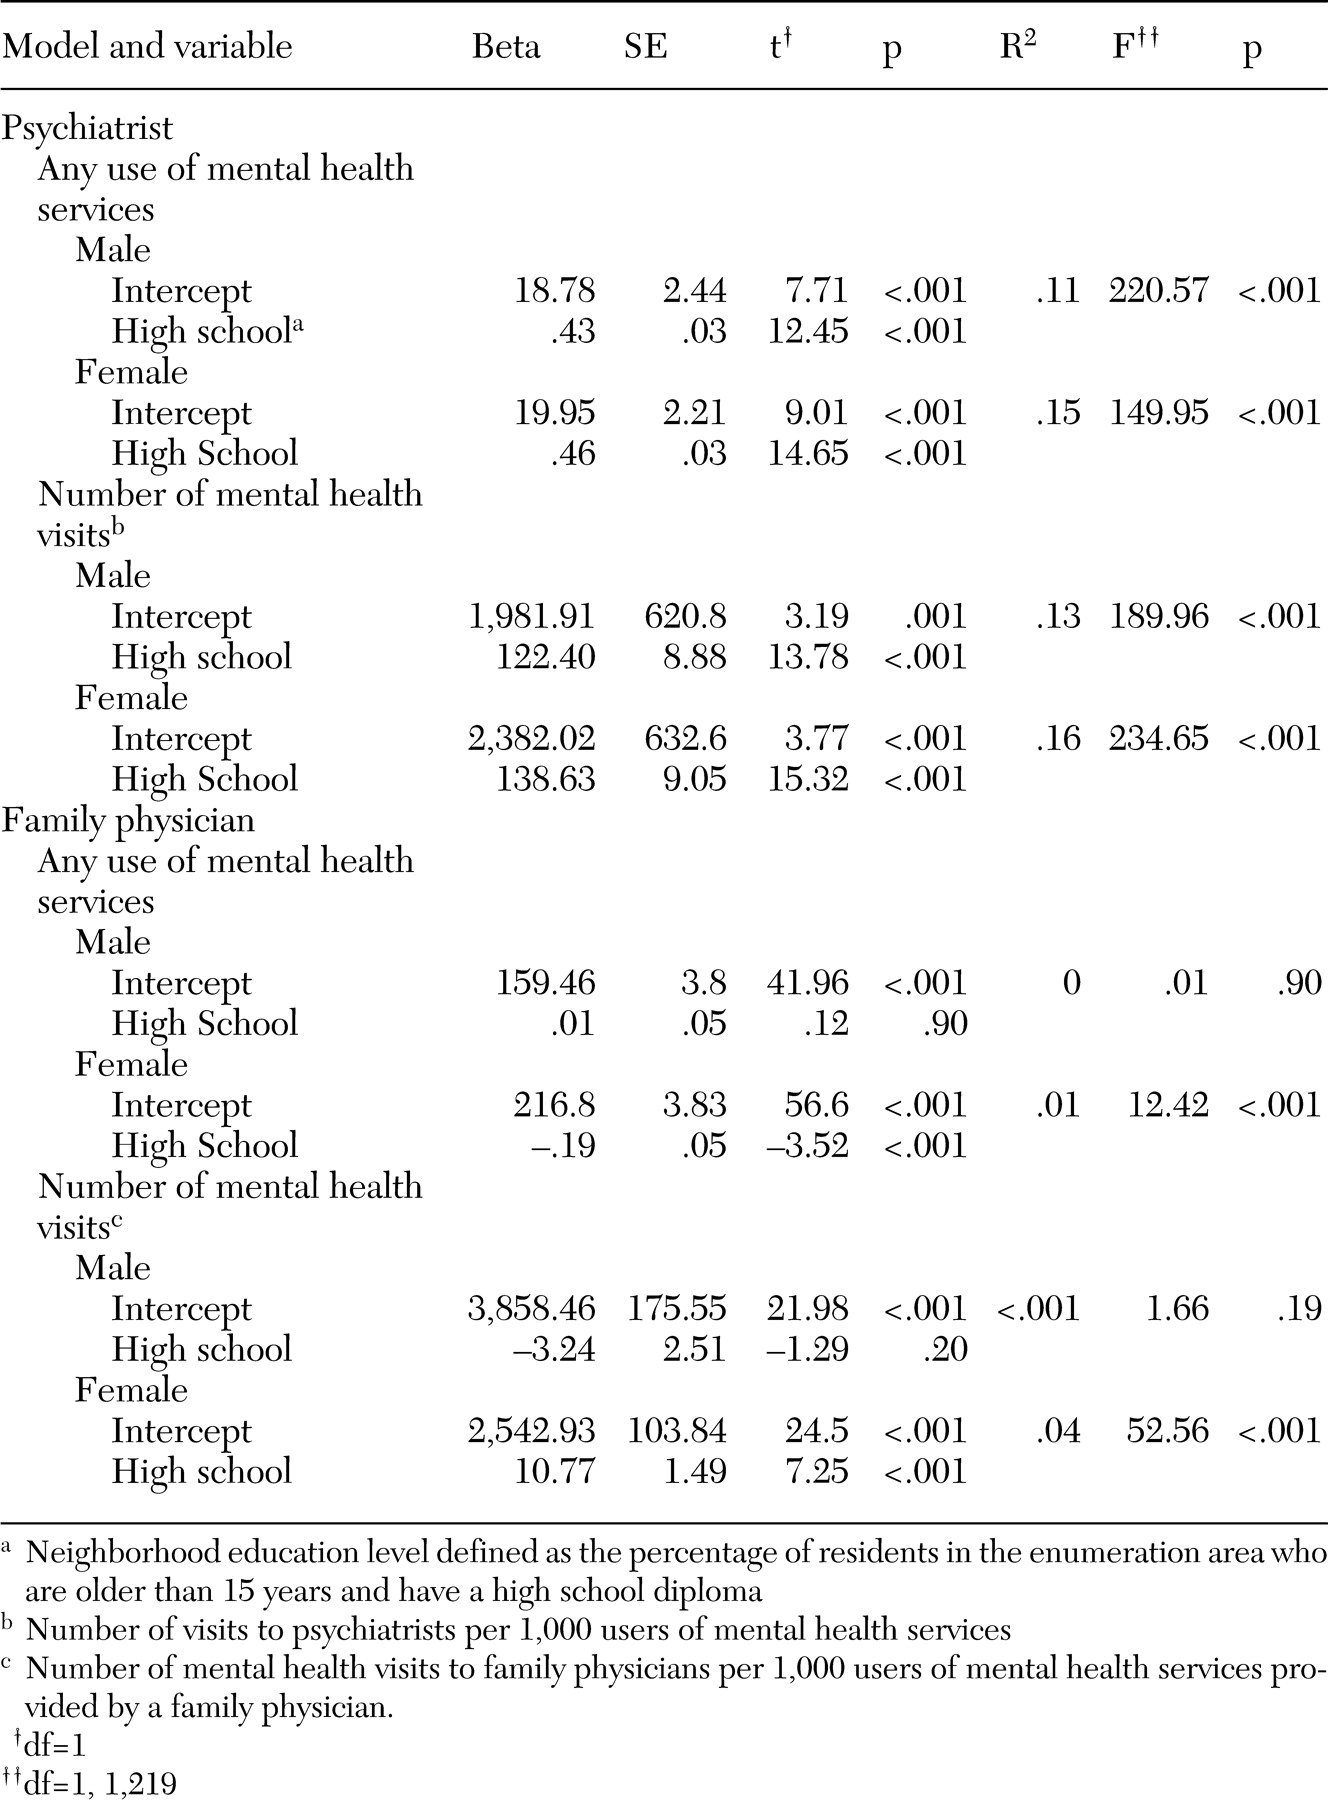
Significant socioeconomic differences were seen for the number of individuals who had any use of psychiatric care. Male and female claimants from the neighborhoods with the highest socioeconomic status were more likely than those from the neighborhoods with the lowest socioeconomic status to see a psychiatrist (rate ratio [RR] for males=1.6, 95 percent confidence interval [CI]=1.4 to 1.7; RR for females=1.6, CI=1.5 to 1.7). This result corresponds to an absolute difference of 21 more males per 1,000 (CI=17 to 25) using psychiatric care and 23 more females per 1,000 (CI=20 to 27) using psychiatric care in the highest education quintile. The results of the regression analyses are summarized in
Table 2. Linear regression confirmed the significance of a gradient across neighborhood education levels for male claimants (R
2=.11, F=220.6, df=1, 1,220, p<.001) and female claimants (R
2=.15, F=150.0, df=1, 1,220, p<.001).
Marked socioeconomic differences were seen in the number of psychiatric claims by both males and females who saw a psychiatrist. After the analyses adjusted for age, psychiatric service users from neighborhoods with the highest socioeconomic status had almost twice as many psychiatric claims as those from neighborhoods with the lowest socioeconomic status (male RR=1.8, CI=1.7 to 2.0; female RR=1.9, CI=1.7 to 2.1). These ratios correspond to an absolute difference of six more visits per male (CI=5 to 7) and seven more visits per female (CI=6 to 8) in the highest education quintile. Linear regression analysis confirmed the significance of the socioeconomic gradient across education levels for both the male claimants (R2=.13, F=190.0, df=1, 1,220, p<.001) and the female claimants (R2=.16, F=234.7, df=1, 1,220, p<.001).
Use of family physicians' mental health services
We did not see marked socioeconomic gradients in mental health service provision by family physicians. No significant rate ratios were found for the highest and lowest education groups for the number of individuals who had any use mental health services provided by family physicians. Linear regression showed a slight negative gradient across education levels only for female claimants for any mental health care provided by family physicians (R2=.04, F=12.4, df =1, 1,220, 1, p<.001).
A significant rate ratio was found only for females for the number of mental health claims submitted by family physicians among users of mental health care provided by family physicians (RR=1.2, CI=1.1 to 1.2). This ratio corresponds to an absolute difference of five more visits per female mental health care user in the highest education quintile (CI=4 to 7). Among users of care, linear regression demonstrated a slight but significant positive socioeconomic gradient across quintiles only for female users of care (R2=.04; F=52.6, df=1, 1,220, p<.001).
Frequency of visits
Among individuals with any mental health service use, those in the highest socioeconomic quintile had more claims per person than those in the lowest socioeconomic quintile: for psychiatrists, Q5=15.6 claims per person (CI=15.1 to 16.1) and Q1=8.2 claims per person (CI=7.9 to 8.6); for family physicians, Q5=3.4 claims per person (CI=3.4 to 3.7) and Q1=3.2 claims per person (CI=3.1 to 3.2).
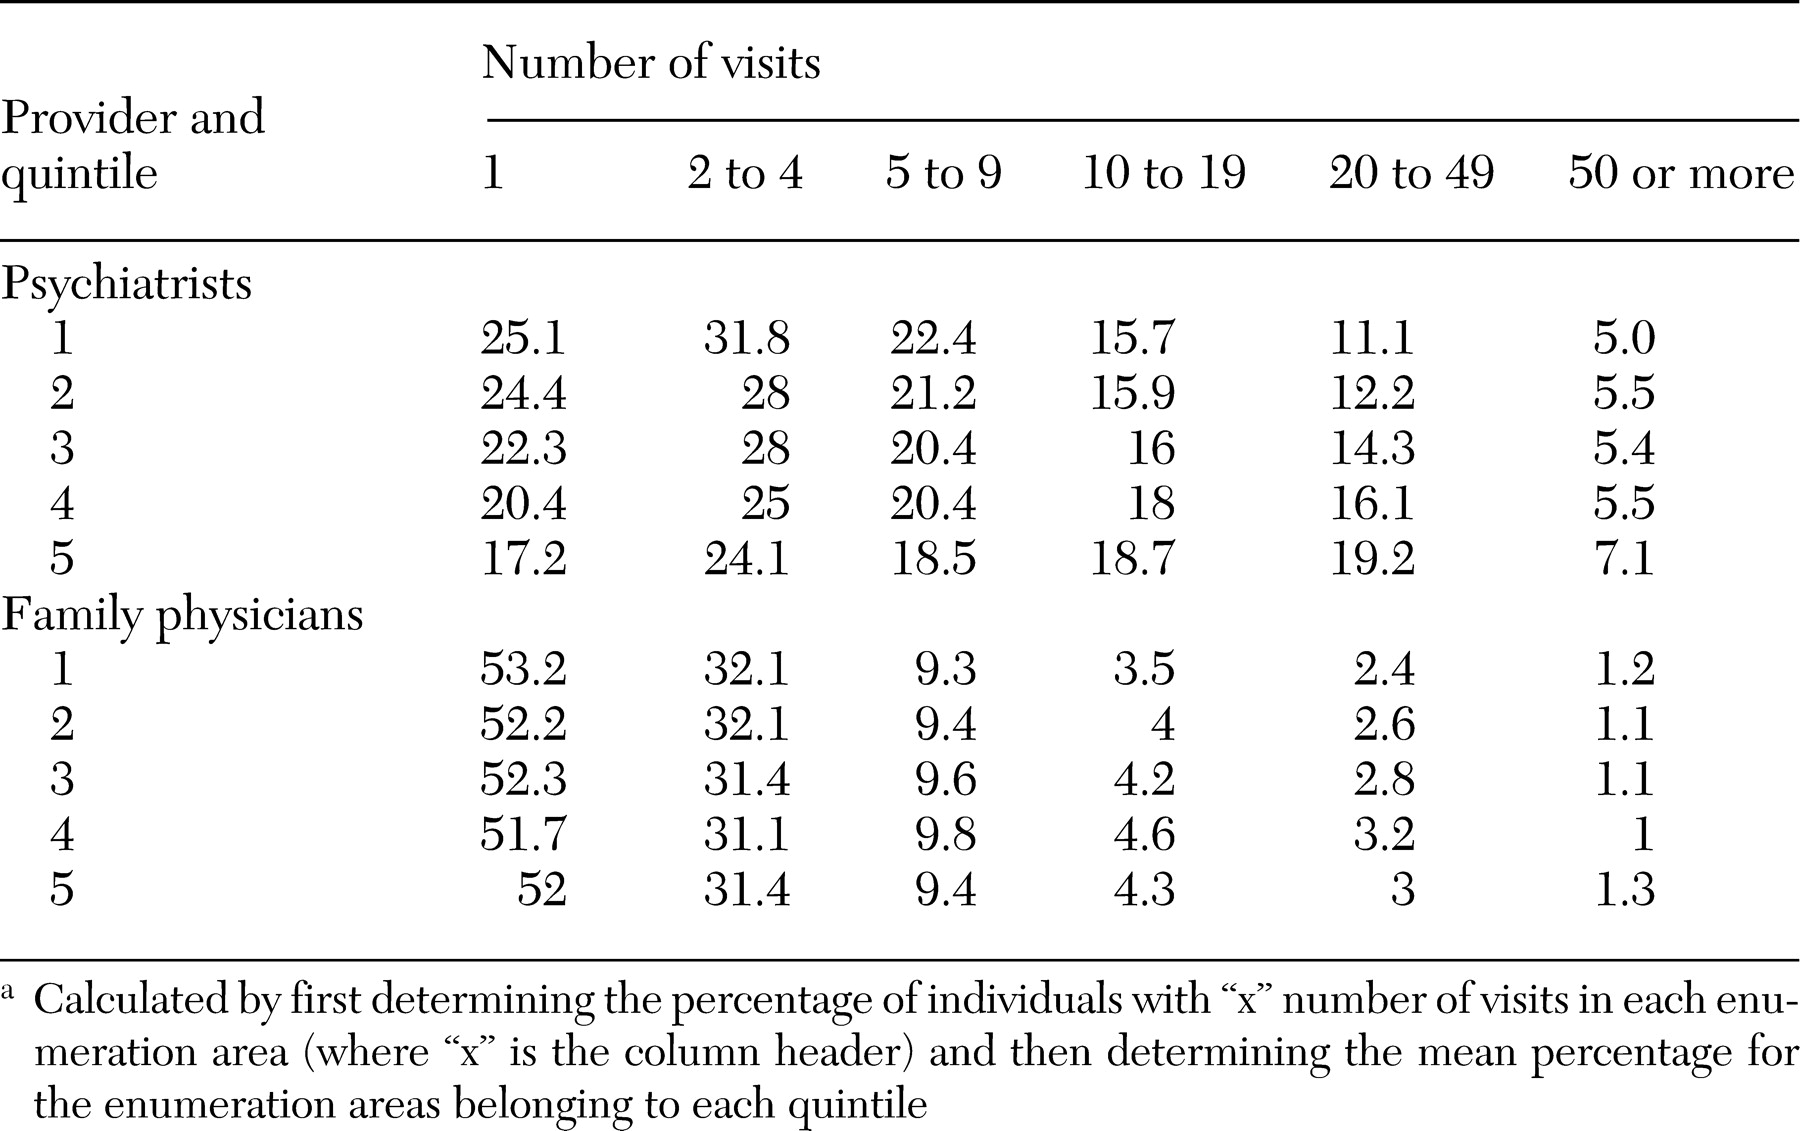
Table 3 shows that individuals from neighborhoods with higher socioeconomic status were more likely to be frequent users of psychiatric care. Among users of care provided by a psychiatrist, the mean percentage of individuals in the lowest socioeconomic neighborhoods who had 20 or more psychiatric claims was 11.6 percent, whereas the mean percentage of those in the neighborhoods with the highest socioeconomic status was 24.1 percent (t=16.1, df=465, p<.001). A much smaller difference was seen for individuals who received mental health care from family physicians—on average 2.6 percent of residents in the neighborhoods with the lowest socioeconomic status and 3.3 percent of residents in the neighborhoods with the highest socioeconomic status had 20 or more claims (t=4.2, df=472, p<.001).
Diagnostic groupings
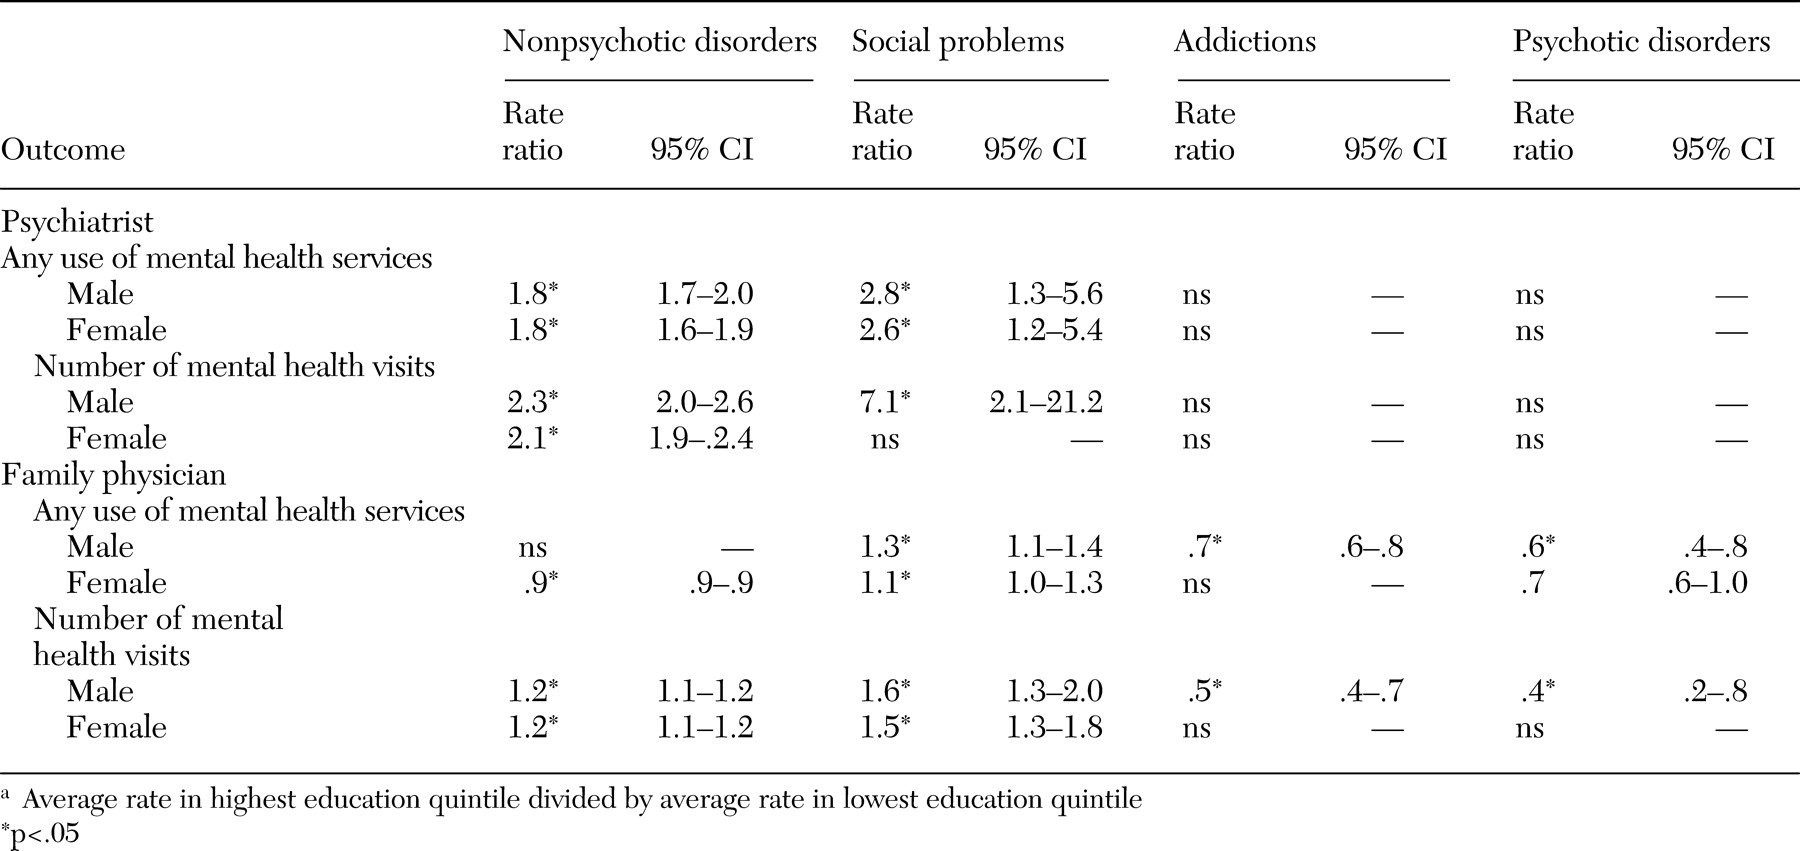
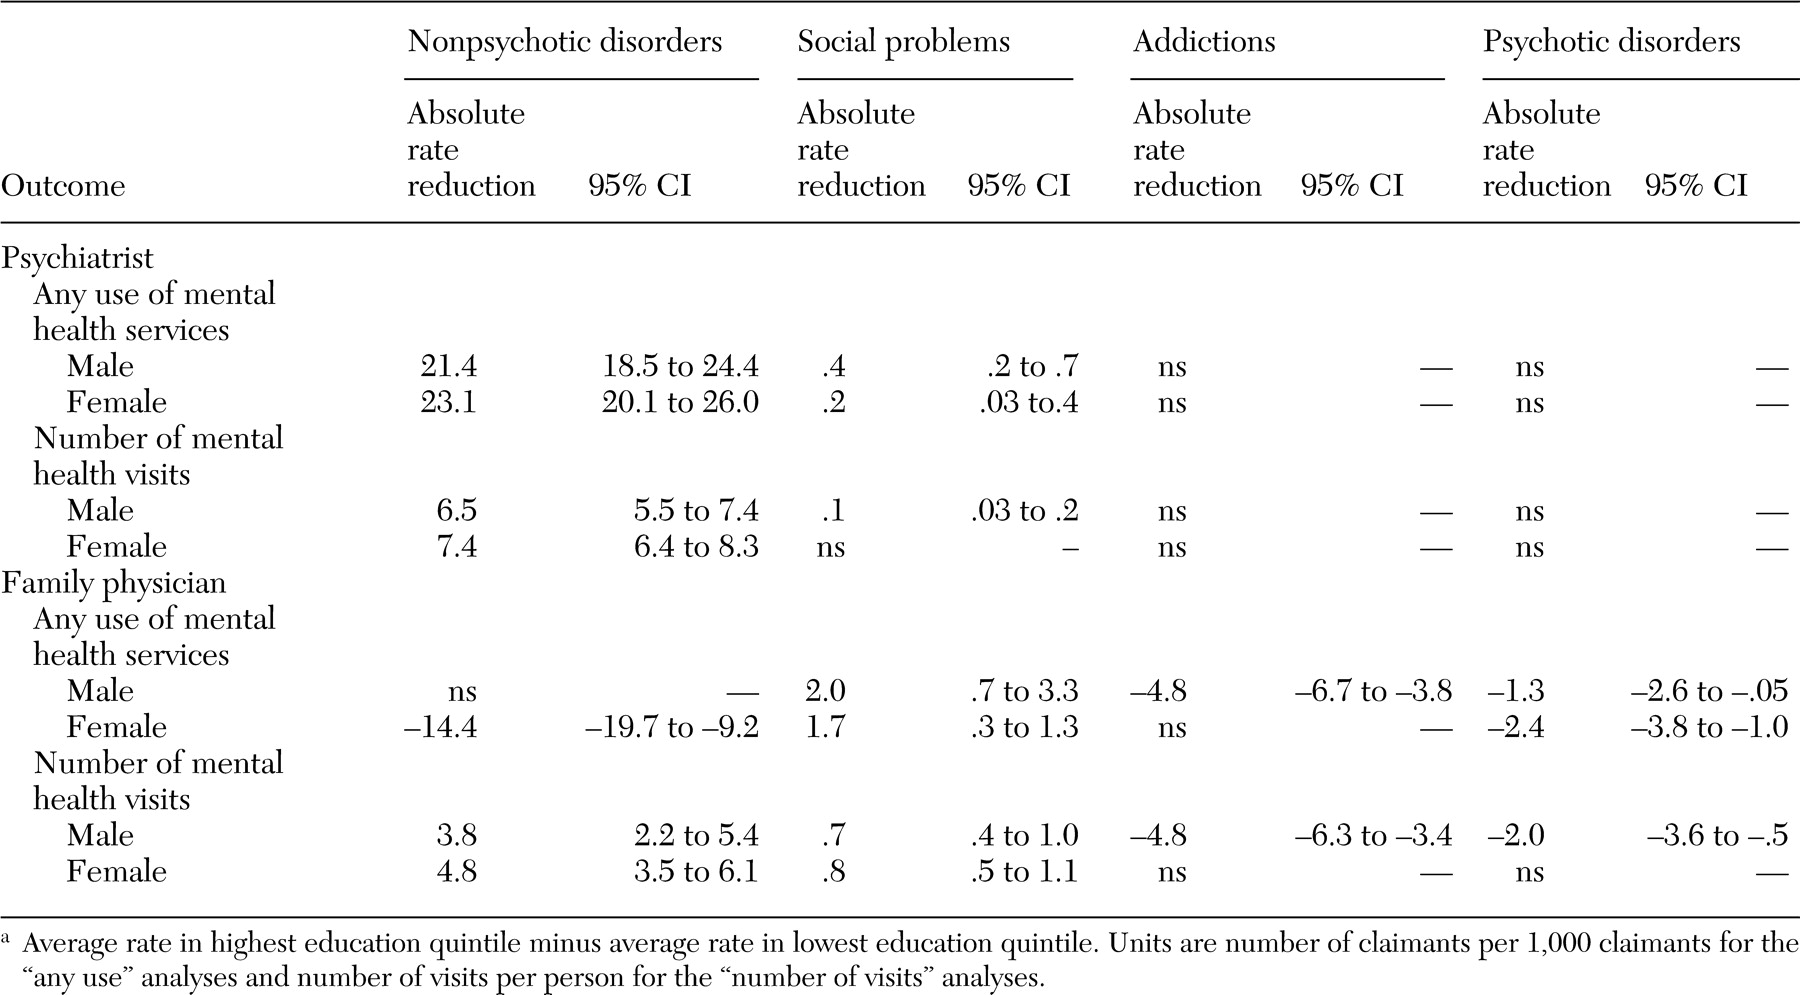
Tables 4 and
5 present the Q5:Q1 rate ratios and absolute rate differences by diagnostic groups. For psychiatrists, strong positive socioeconomic gradients in care were seen for nonpsychotic disorders, such as anxiety and depression, and for social problems but not for psychotic disorders or addictions. For family physicians, the analyses suggest negative socioeconomic gradients for psychotic disorders and addictions and mostly positive socioeconomic gradients for nonpsychotic disorders and social problems.
Income analysis
The Q5:Q1 rate ratios were somewhat lower when socioeconomic status was defined by income rather than by education. However, our conclusions remained the same with this reanalysis. [A table presenting these results is available in the online version of this article at ps.psychiatry online.org.]
Discussion
This study demonstrated marked inequity in the provision of services by psychiatrists under universal health care coverage. If the level of provision of mental health services were an appropriate reflection of service need, we would see a strong inverse association between socioeconomic status and utilization rates of mental health services (
6,
7). The expected inverse gradient is missing for family physicians and is in fact in the opposite direction for psychiatrists. Not only did more individuals from higher socioeconomic status neighborhoods use psychiatric care at least once, they also had higher numbers of claims than individuals from lower socioeconomic status neighborhoods. Claims for nonpsychotic disorders and social problems, which included depression and anxiety disorders, most closely followed this pattern. On the other hand, claims for psychotic disorders and addictions showed an inverse gradient for family doctors and no significant gradient for psychiatrists. This finding suggests that universal health care coverage in our setting is supporting regular psychiatric treatment for individuals with high socioeconomic status and comparatively milder psychiatric disorders to a larger degree than it supports care for disadvantaged groups or those with severe and persistent mental illness.
Several factors may contribute to this pattern. First, initial appointments with psychiatrists usually require a referral from a family physician. Although the evidence for the following theory is conflicting, patients from lower socioeconomic status neighborhoods may be less likely to request a referral to a psychiatrist because of differences in attitudes or perceived stigma associated with seeing a mental health specialist (
29,
30,
31). Second, family physicians may believe that patients with a lower socioeconomic status will not benefit as much from psychiatric referral, although at least some evidence suggests that this belief is unfounded (
32). Third, patient factors that are correlated with socioeconomic status, such as ethnicity, may affect family physicians' propensity to refer to or patients' willingness to accept psychiatric care (
14). In our setting, recent immigrants in a low socioeconomic status group without a good knowledge of English may not be referred because of communication barriers with their family physicians or because no psychiatrist is available who speaks their language. Finally, it might also be the case that family physicians have difficulty finding appropriate psychiatric care for certain marginalized groups (
33).
From our analysis, we cannot ascertain with certainty whether the difference in socioeconomic status in the frequency of care provided by a psychiatrist is patient driven—with individuals with higher socioeconomic status more likely than those with lower socioeconomic status to attend follow-up appointments with psychiatrists (
34,
35)—or provider-driven—with residents with higher socioeconomic status being considered more suitable for treatments that require more frequent visits. Nor can we ascertain with certainty whether this difference represents inadequate service delivery to groups with high morbidity and low socioeconomic status or inappropriate service use by groups with low morbidity, high socioeconomic status.
In 1997, Katz and colleagues (
36) reported "little evidence [in Ontario] of excessive use of services by persons with low mental morbidity and impairment, at least relative to the United States." However, the socioeconomic gradients seen in our study were most marked among individuals who had 20 or more psychiatric visits. No published literature convincingly argues for the appropriateness of frequent visits only in the higher socioeconomic strata. Moreover, except for personality disorders (
37), the evidence supporting the usefulness of frequent, long-term psychiatric treatment of any type is not strong. For example, long-term psychodynamic psychotherapy is ineffective for schizophrenia (
38), and clinical practice guidelines agree about the weak evidence base for this therapy for treating depression (
39,
40). Studies of manualized therapies such as cognitive-behavioral therapy most often use interventions comprising fewer than 20 visits. For studies that demonstrate improvement with long-term psychiatric treatment, the frequency of the interventions did not exceed 20 visits per year (
41).
Our findings contrast with Ontario surveys that did not show marked socioeconomic status gradients in mental heath care (
8,
17,
18). One study measured any use of mental health care but not frequency of use (
8), and two measured frequency of use and relied on patient self-report for this measurement (
17,
18). Self-report has been shown to overestimate the frequency of mental health visits among individuals with high levels of distress. This bias could have obscured differences in socioeconomic status in analyses that used survey data (
42,
43). Because those studies were provincewide, it is also possible that the socioeconomic status gradients we found are limited to urban settings.
Unlike the previous studies that used survey data, socioeconomic status in this study was attributed by area rather than at the individual level. The areas used, however, were small and homogeneous, making it unlikely that a few individuals with low socioeconomic status who were residing in areas of high socioeconomic status were responsible for the patterns that we found. It is also the case that socioeconomic status gradients in service use at the neighborhood level have importance, above and beyond individual-level gradients, for understanding and planning health service delivery and for health policy (
22).
Using administrative rather than survey data, we may have missed some mental health care by lower socioeconomic status groups. The most marginalized groups may be involved in community programs that provide counseling from social workers, nurses, or psychologists or use complementary or alternative types of care. However, in our setting most community nonphysician mental health workers charge patients directly for their services or are paid privately through employees' health insurance plans, and consequently individuals who use these services tend to be of above average income and education level (
44).
Our denominators included only individuals who had recent contact with the fee-for-service health system. Individuals who have not used any care in our study year were not included in our rates. If individuals who are not actively using health care are more likely to be from neighborhoods with higher socioeconomic status, then rates in that group could be falsely elevated. Because of this uncertainty, we need to be cautious in our interpretation of our conclusions. The gradients that we have found may be less steep when measured at a population level.
A final caution relates to the accuracy of our diagnostic groupings. Although we have reported the sensitivity and specificity of our primary measure, which uses a broad definition of mental health visit, we cannot assume similar accuracy when we use groups of codes to identify visits related to specific diagnostic groups. Consequently, the analyses that we have reported on the basis of diagnostic groupings should be viewed as exploratory.
