Abstract

Human brain maturation is a complex, lifelong process that can now be examined in detail using neuroimaging techniques. Ongoing projects scan subjects longitudinally with structural magnetic resonance imaging (MRI), enabling the time-course and anatomical sequence of development to be reconstructed. Here, we review recent progress on imaging studies of development. We focus on cortical and subcortical changes observed in healthy children, and contrast them with abnormal developmental changes in early-onset schizophrenia, fetal alcohol syndrome, attention-deficit–hyperactivity disorder (ADHD) and Williams syndrome. We relate these structural changes to the cellular processes that underlie them, and to cognitive and behavioral changes occurring throughout childhood and adolescence.

Introduction

The dynamic course of brain maturation is one of the most fascinating aspects of the human condition. Although brain change and adaptation are part of a lifelong process, the earliest phases of maturation— during fetal development and childhood—are perhaps the most dramatic and important. Indeed, much of the potential and many of the vulnerabilities of the brain might, in part, depend on the first two decades of life.
The cortex and subcortical gray-matter nuclei develop during fetal life in a carefully orchestrated sequence of cell proliferation, migration and maturation. This leads to a human brain with ~100 billion neurons at birth. However, the brain of a newborn child is only one-quarter to one-third of its adult volume, and it continues to grow and specialize according to a precise genetic program, with modifications driven by environmental influences, both positive and negative. With stimulation and experience, the dendritic branching of neurons greatly increases, as do the numbers of synaptic connections. As layers of insulating lipids are laid down on axons through the process of myelination, the conduction speed of fibers that interconnect different brain regions increases ~100-fold. This exuberant increase in brain connections is followed by an enigmatic process of dendritic ‘pruning’ and synapse elimination, which leads to a more efficient set of connections that are continuously remodeled throughout life.

Synaptic changes and myelination

When Huttenlocher began to demonstrate this succession of events in the human brain, magnetic resonance imaging (MRI) was still in its infancy. His histological work in the 1980s paved the way in showing that the time-course for synaptic blooming and pruning in the human brain varies enormously by brain region. For example, in the visual cortex, synaptic overproduction reaches a maximum at about the fourth postnatal month. Then synapse elimination starts, and this continues until preschool age, by which time synaptic density has reached the adult level. But in the medial prefrontal cortex, an area of the brain involved in executive, attentional and regulatory functions, the peak occurs at 3–4 years of age, and substantial decline does not occur until mid-to-late adolescence (1).
Early work by Yakovlev and Lecours documented the progression of myelination in the developing human brain (2). More recent work by Benes et al. with much larger samples showed similar results, with myelination continuing well into the third decade of life (3). Interestingly, the spatial and temporal pattern of these cellular changes seemed to parallel developmental changes in synaptic density. Simply put, myelination of the most dorsal regions of the brain responsible for higher cognitive functions seemed to continue well into adolescence, and more ventral and deep brain structures—some of which are responsible for relatively more primitive functions—were myelinated earlier.
However, the sequence of myelination might be more complex than this. A problem with many interpretations of the work by Yakovlev and Lecours (2), and of similar studies of myelogenesis, is that dorsal and ventral systems do not ultimately myelinate to the same degree: on average, dorsal cortex, at its most mature, is less myelinated than ventral cortex. Therefore, if myelination took the same time-course, then at any given time areas that myelinate more fully would appear more myelinated than those that myelinate less. Therefore, when the degree of myelination is observed on histologically stained sections or in MRI scans of the brain, one must also consider the ultimate extent of myelination for each system. Recent research studying patterning molecules, and rates of proliferation and neuronal migration, show a much more complex pattern of cortical maturation, occurring primarily from a rostral-lateral-ventral pole toward a dorsal-medial-caudal pole (reviewed in (4)).
This histological evidence suggested that brain development is a dynamic process of progressive and regressive changes. But histology gave only very fragmented evidence for late brain maturation, given the dearth of post-mortem data from childhood and adolescent years. By contrast, MRI can non-invasively document these large-scale processes of brain development, can provide insight into the sequence and timing of these developmental processes in longitudinal experiments, and can document how they occur in living subjects.

Initial brain-imaging studies

The first quantitative structural brain-imaging studies in normal children using MRI were conducted in the late 1980s and early 1990s. Terry Jernigan and colleagues showed that young adults actually had less cortical gray matter than children, despite the fact that adults had somewhat larger overall total brain volumes (5). They found that gray-matter volumes generally declined after age 7, perhaps because the advancement of white matter (i.e. myelination) throughout childhood began to overtake the overall rate of brain volume expansion, causing a net decrement in the amount of tissue appearing gray (or unmyelinated) on MRI. They then determined that the timing of gray-matter loss was different for different brain regions: loss was first observed in the deep motor nuclei in early childhood, then in the parietal and frontal lobes at around puberty (6). Although MRI did not assess synaptic density per se, this was the first in vivo evidence to support the post-mortem findings of Huttenlocher and of Yakovlev and Lecours.

Anatomical parcellation and mapping

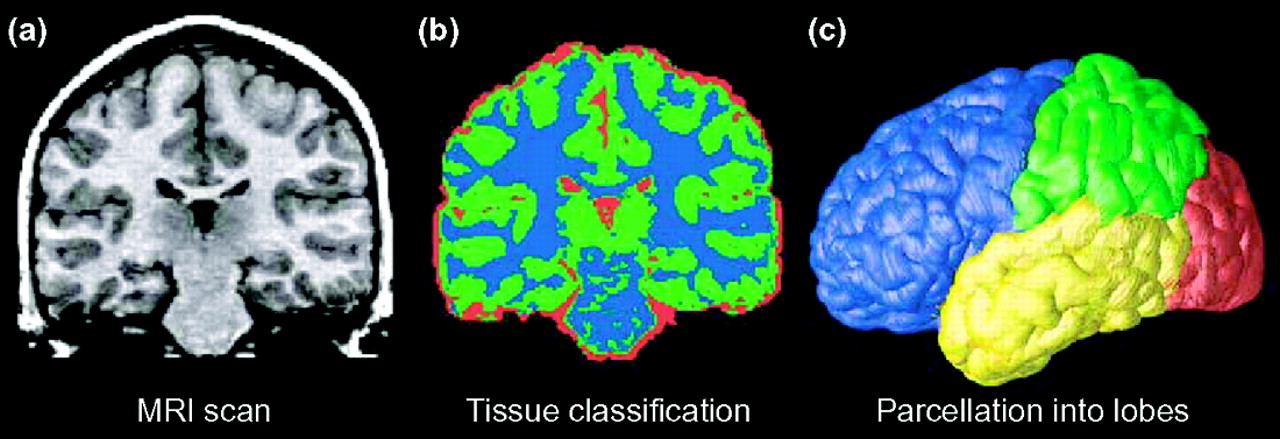
The aforementioned studies used a method called volumetric parcellation. In this approach, the brain is subdivided into several, separate anatomical regions with different functions (e.g. the frontal lobe, the deep motor nuclei or the hippocampus), and their volumes are measured (Figure 1). Parcellation enables the compilation of growth curves that document how regional volumes vary with age. Results are typically illustrated using scatterplots but regional measurements are limited by anatomical structures (i.e. sulcal landmarks) and can also be reliably visualized and defined using MRI.
In the late 1990s, a few teams began to make composite 3D maps of developing brain structures (4, 712) showing, for example, the average pattern of age-related change in gray-matter thickness between childhood and young adulthood. More recently, these mapping techniques have become more popular because they provide more visual detail and group statistics regarding the rates of change and their regional variation. Time-lapse animations also can be computed to illustrate the changes.
Many of the basic functions of the brain, such as vision, hearing, speech, planning and emotional control are primarily handled in the cortex, so much of the work mapping brain development has focused on the cortex, although some groups have studied subcortical gray matter. The goal of cortical mapping is to create group average maps of cortical features of interest such as gray-matter thickness, gray-matter density, cortical shape, average sulcal patterning and hemispheric asymmetries, all of which change during development (for methods, see (13)). Next, statistics are defined that help localize age effects on these measurements, such as localized reductions or increases in gray-matter density or thickness, and brain growth.

Changes in gray and white matter

The earliest cross-sectional pediatric brain MRI studies of normal developmental changes showed that gray-matter volumes generally declined after 6–7 years of age and continued to decrease during adolescence, whereas white-matter volumes increased linearly over time. However, in one of the first studies to compile growth curves for the volumes of different lobes of the brain as subjects aged (i.e. studies that were longitudinal rather than cross-sectional) (14), there was a clear linear increase in white matter up to age 20, whereas there were non-linear changes in cortical gray matter. Giedd et al. demonstrated a pre-adolescent increase, with developmental curves peaking at ~12 years for the frontal and parietal lobe, and at ~16 years for the temporal lobe. After that, gray-matter loss occurs.
More recently, another developmental study quantified human cortical development by measuring gray-matter density in each lobe, point by point (4). This map was constructed from serial brain MRI scans of 13 children followed over a ten year period. Children were scanned every two years for eight years from the time they were recruited, and were given a structured diagnostic interview at each visit to confirm lack of a psychiatric disorder.
This study measured which brain regions change between 4 and 21 years of age and illustrated these statistics as a time-lapse movie. This revealed a shifting pattern of gray-matter loss, appearing first (at ~4–8 years of age) in dorsal parietal and primary sensorimotor regions near the interhemispheric margin, and spreading laterally and caudally into temporal cortices and anteriorly into dorsolateral prefrontal areas. The first areas to mature were those with the most basic functions, such as those processing the senses and movement. Areas involved in spatial orientation and language (parietal lobes) followed, around the age of puberty (11–13 years). Areas with more advanced functions—integrating information from the senses, reasoning and other ‘executive’ functions (e.g. prefrontal cortex)—matured last, in late adolescence. This sequence also provided evidence that phylogenetically older cortical areas mature earlier than the more recently evolved higher-order association cortices, which integrate information from earlier maturing cortex.

Cortical thickness

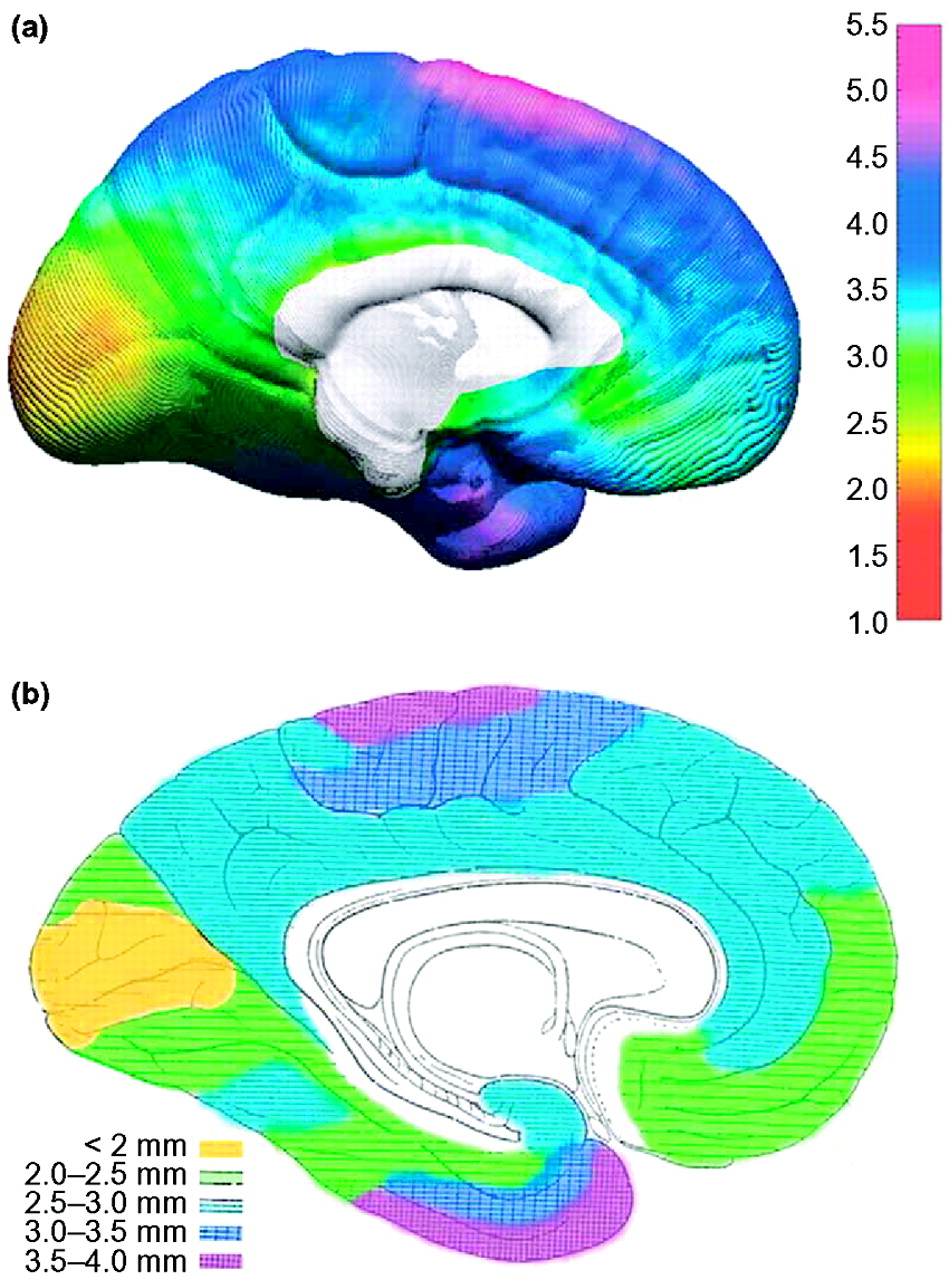
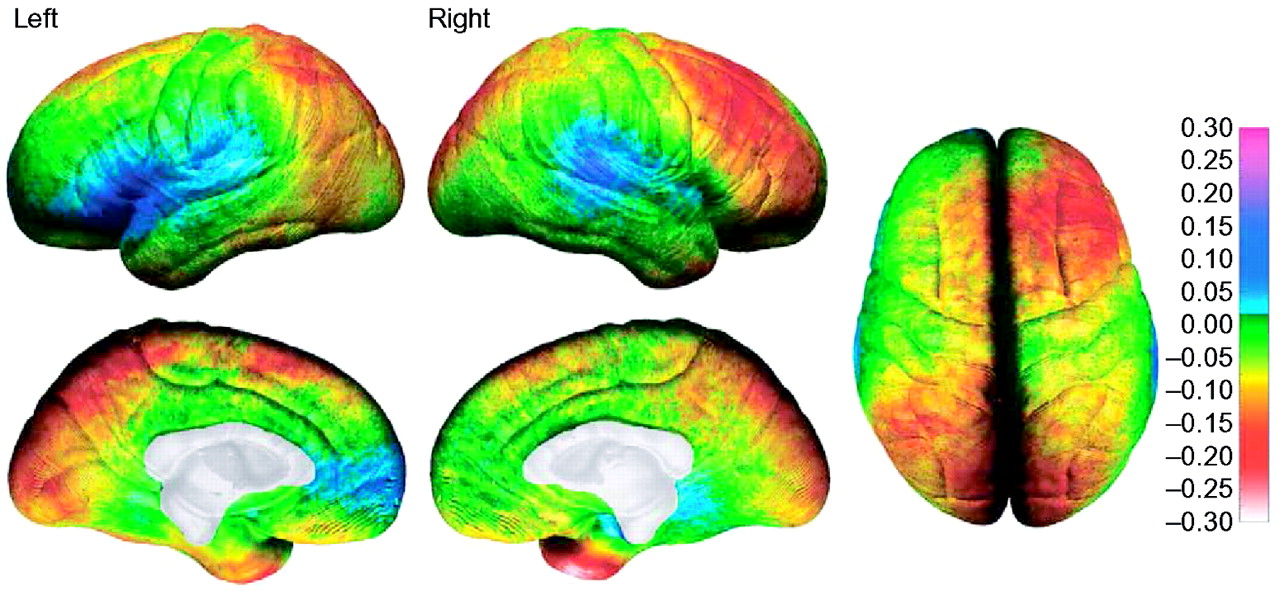
In another longitudinal study, changes in cortical thickness were measured (in millimeters) in a group of 45 normally developing children studied between 5 and 11 years of age (12). Each child was studied twice with a two-year scanning interval. Maps of cortical thickness were created for each child, and the average cortical-thickness maps were remarkably similar to maps created from postmortem data by von Economo (15). The average cortical thickness for the normally developing children and from the post-mortem data are shown in Figure 2. As can be seen on the medial brain surface, the cortex is thickest in the most dorsal aspects of the frontal and parietal lobes (~4–5 mm), and thinnest in the visual cortices of the occipital lobes surrounding the calcarine sulcus (2.0–2.5 mm). These data revealed cortical thinning of ~0.15–0.30 mm per year in normally developing children, most prominently in right dorsal frontal and bilateral parietal regions. Cortical thickening was also observed with increases of ~0.10–0.15 mm per year in the classical language regions of the temporal and frontal lobes (Figure 3). The brain grew at a rate of ~0.4–1.5 mm per year in many regions, most prominently in the frontal and occipital regions. This pattern of results is similar to those observed in cross-sectional and longitudinal data of normal brain maturation (4, 16), but the new methods enabled changes in cortical thickness to be assessed in millimeters for the first time. Additionally, this study confirmed that dynamic but distinct changes occur in posterior temporal and frontal language regions, where gray matter continues to increase in thickness. We speculate that cortical changes in these regions could be related to changing language abilities that continue after 5 years of age (e.g. changes in reading ability) (12); functional and structural imaging studies are underway to test these hypotheses.

Cognitive correlates

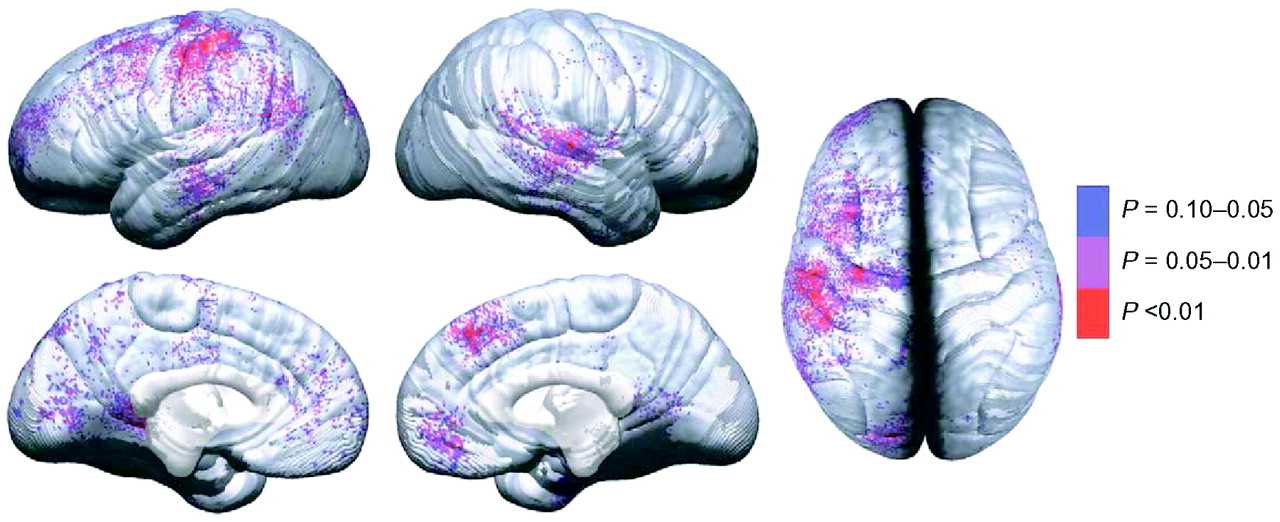
Changes in cortical thickness during normal development relate to cognitive changes as children and adolescents mature. In the same 45 normally developing children already described, cortical thinning in the left dorsal frontal and parietal lobes correlated with improved performance on a test of general verbal intellectual functioning (12, 17). Greater left hemisphere gray-matter thinning was associated with improved performance on the vocabulary subtest of a standardized IQ measure (17) (Figure 4). When permutation analyses were conducted to correct for multiple comparisons in the brain-behavior analyses, change in cortical thickness was correlated with change in the behavioral measure only in dorsal frontal and parietal cortex of the left hemisphere. Cortex in these regions tends to thin with increased age. Thus, the results of negative relationships between cortical thickness and vocabulary improvements are consistent with what would be expected. Considering these data, it seems reasonable to speculate that the brain changes are related to cognitive changes during development, although few studies have addressed this issue.

Cortical changes throughout life

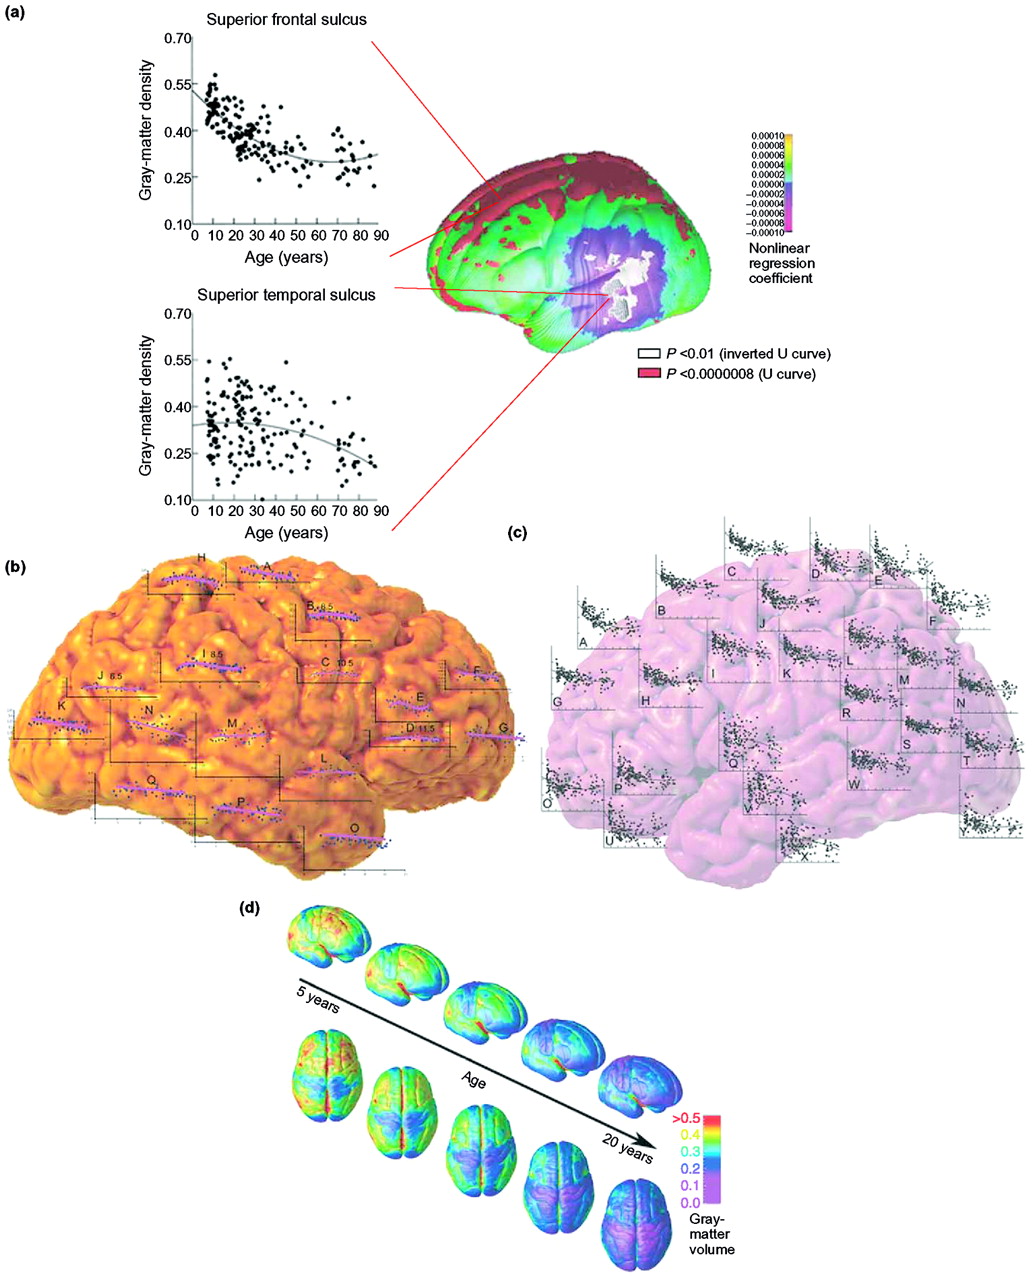
The brain-mapping studies of normal brain maturation described here have been limited by the age ranges of the subjects studied. They have clearly shown regional and temporal patterns of dynamic maturational change continuing through childhood and adolescence. However, they could not enable conclusions to be made about the endpoint in cortical sculpting (which probably results from increased myelination and synaptic pruning) because they did not assess individuals >30 years of age. This issue was addressed in a study of a large sample of normal individuals (n = 176) across the span of life (7–87 years of age) (11). Significant, non-linear age effects were observed over large areas of the most dorsal aspects of the frontal and parietal regions on both the lateral and interhemispheric surfaces and in the orbitofrontal cortex. Scatter-plots of these effects revealed a dramatic decline in gray-matter density between 7 and 60 years of age, with little or no decline thereafter. A sample scatterplot of the quadratic effect of age on gray-matter density at one brain-surface point on the superior frontal sulcus is shown in Figure 5, and is similar to plots from the dorsal frontal and parietal regions. Notably, the most lateral aspects of the brain in the posterior temporal and inferior parietal lobes bilaterally showed a distinct pattern of gray-matter change, one in which the non-linear age effects were inverted relative to the age effects in more dorsal cortices. A subtle increase in gray-matter density was observed until ~30 years of age, and it then remained stable until a precipitous decline in later decades. As these data illustrate, the trajectory of maturational changes might continue beyond adolescence and into young adulthood, and can be assessed only using an extended age range. The question of when brain maturational changes traverse into the more degenerative changes of aging becomes even more poignant when considering these data (for a detailed discussion, see (18)). The last systems to mature are also among the first to degenerate in disorders such as Alzheimer’s disease; their high degree of plasticity throughout life might make them more vulnerable to neurodegeneration (1920).

Subcortical changes during development

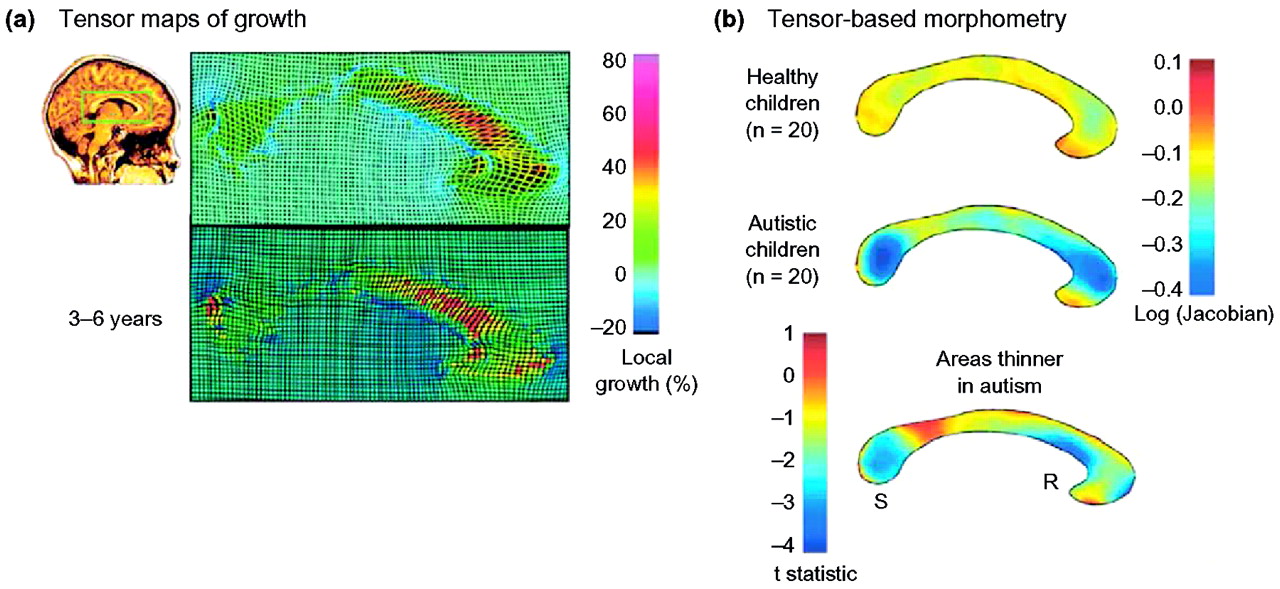
Most brain-mapping studies of development have focused on the cortex, but developmental changes in subcortical structures have also been characterized. For example, one study mapped a front-to-back wave of growth through the corpus callosum at 3–15 years of age (22) (Figure 6). The continuous myelination of interhemispheric fibers results in increased axonal conduction speed and transmission of information between the brain hemispheres. Perhaps the main surprise from the subcortical studies is the progressive volume loss in the deep gray-matter nuclei—especially the caudate—at around puberty. In contrast to the basal ganglia, temporal lobe gray-matter structures (the amygdala and hippocampus) seem to increase in volume during childhood and adolescence.

Relationship to cellular changes

We cannot conclude directly what cellular changes are involved in the dynamic maturational processes described here. MRI measures changes in the volume and density of brain structures, but lacks the resolution to characterize the cellular mechanism (e.g. dendritic remodeling, cell death, synaptic pruning or myelination) of such changes. Moreover, gray-matter volume and thickness reflect not only the dendritic and synaptic processes that occur in neurons but also the complex architecture of neurons, glia (i.e. myelin) and vasculature. However, we can say that the gray-matter changes described in this review correlate well with the post-mortem sequence of regionally variable increased synaptic pruning and myelination during adolescence and early adulthood.

Fetal and neonatal MRI

Mapping fetal and neonatal brains presents another set of practical and technical challenges. Aside from the obvious difficulty in obtaining motion-artifact-free images, at these ages the degree of myelination produces considerably less contrast in images obtained using the most commonly applied T1 and T2 weighted pulse sequences. Nevertheless, considerable insight into the earliest myelination and differentiation of the telencephalon and diencephalon can be seen by imaging from fetal stages in utero through the first six months after birth (23). These imaging results are consistent with post-mortem measures of increased myelination before birth (2426). A general caudal-to-rostral progression can be appreciated in this age group. Furthermore, morphological differentiation of several structures such as the internal capsule (a fan-like structure of white matter separating the lentiform nucleus from the caudate and dorsal thalamus) precedes changes in white-matter, often by many months. Utilizing specific magnetic resonance pulse sequences to identify white matter, in an approach called diffusion tensor imaging (DTI), can also help characterize the changes associated with myelination. Neil et al. (27) found dramatic and generalized changes in water apparent diffusion coefficients and diffusion anisotropy. These diffusion parameters, measurable using DTI, are locally sensitive to the degree of myelination (which provides resistance to water diffusion) and to fiber orientation (which constrains the principal directions of water diffusion to be aligned with axons). Gilmore et al. (28) found significant increases in fractional anisotropy in the anterior and posterior regions (genu and splenium) of the corpus callosum during development that reflect underlying changes to water content and cytoarchitecture during maturation.

Developmental disorders

Statistical maps can also be created to assess group effects such as brain structure differences between healthy children and those with neuropsychiatric disorders such as schizophrenia, bipolar illness or attention-deficit–hyperactivity disorder (ADHD), those with genetic disorders of brain development such as Williams syndrome (WS; a mental retardation disorder), and those exposed to teratogens during brain development, such as children with fetal alcohol syndrome (FAS). The resulting maps can reveal where in the brain differences are located, how significant they are, and— depending on the study design—whether they are stable or progressive (29).
Statistically significant reductions or increases in measured gray- or white-matter structures are commonly found in children with developmental disorders, and different brain abnormalities have been observed in different disorders. However, most of the abnormalities observed in the quantitative MRI studies of children with developmental disorders have been relatively subtle. That is, the brain structural abnormalities could not typically be observed within individual children, but rather only when studied in groups of children with a particular disorder compared with non-affected or medication-matched controls.

Childhood-onset schizophrenia

Beginning in 1992, scientists led by Judith Rapoport at the National Institute of Mental Health employed MRI technology to scan a group of ~50 teenagers repeatedly as their schizophrenia developed and a group of >500 healthy children as controls. The collected data were analyzed using brain-mapping methods developed to detect subtle changes in the cortex (30). Healthy subjects lost gray matter at a subtle rate of 1–2% per year in the parietal cortices, with very little detectable change in the other lobes of the brain. By contrast, the childhood-onset schizophrenia patients showed a rapid progressive loss of gray matter in superior frontal and temporal cortices, reaching 3–4% per year in some regions. This pattern was seen in both boys and girls. Early deficits in parietal brain regions that support language and associative thinking spread forwards into the temporal lobes, supplementary motor cortices and frontal eye fields. The deficits spread anatomically over a period of 5 years, consistent with the characteristic neuromotor, sensory and visual search impairments in the disease. In temporal cortices, including primary auditory regions, severe gray-matter loss was absent at disease onset but later became pervasive. Patients with the worst brain tissue loss also had the worst symptoms, which included hallucinations, delusions, bizarre and psychotic thoughts, hearing voices and depression.
The notion of schizophrenia as a dynamically emerging disease of neurodevelopment is still controversial. The spreading patterns of deficits corroborate the idea that the normal developmental process of dendritic and synaptic pruning might be abnormally accelerated or derailed in schizophrenia (31). Even so, they might represent a separate process entirely that begins in adolescence—twins studies have hinted that the earliest deficits, occurring in the parietal cortex, might have a non-genetic trigger (32). Some histological studies suggest that there is decreased neuropil in schizophrenia, but autopsy material is scarce and findings are inconsistent. As in normal development, the observed cortical changes might also be glial or vascular in origin, rather than purely neuronal (33). Intracortical contrast might also be affected by changes in myelination (34), and by changes in lipid metabolism during the use of atypical antipsychotic agents. It is possible that in schizophrenia, changes in gray-matter density also reflect, at least in part, increasing intracortical myelination. Still, four dimensional maps such as these offer a biological marker of disease progression for drug trials, where brain mapping can assess how well antipsychotic medications oppose advancement of the disease (35).

Williams syndrome

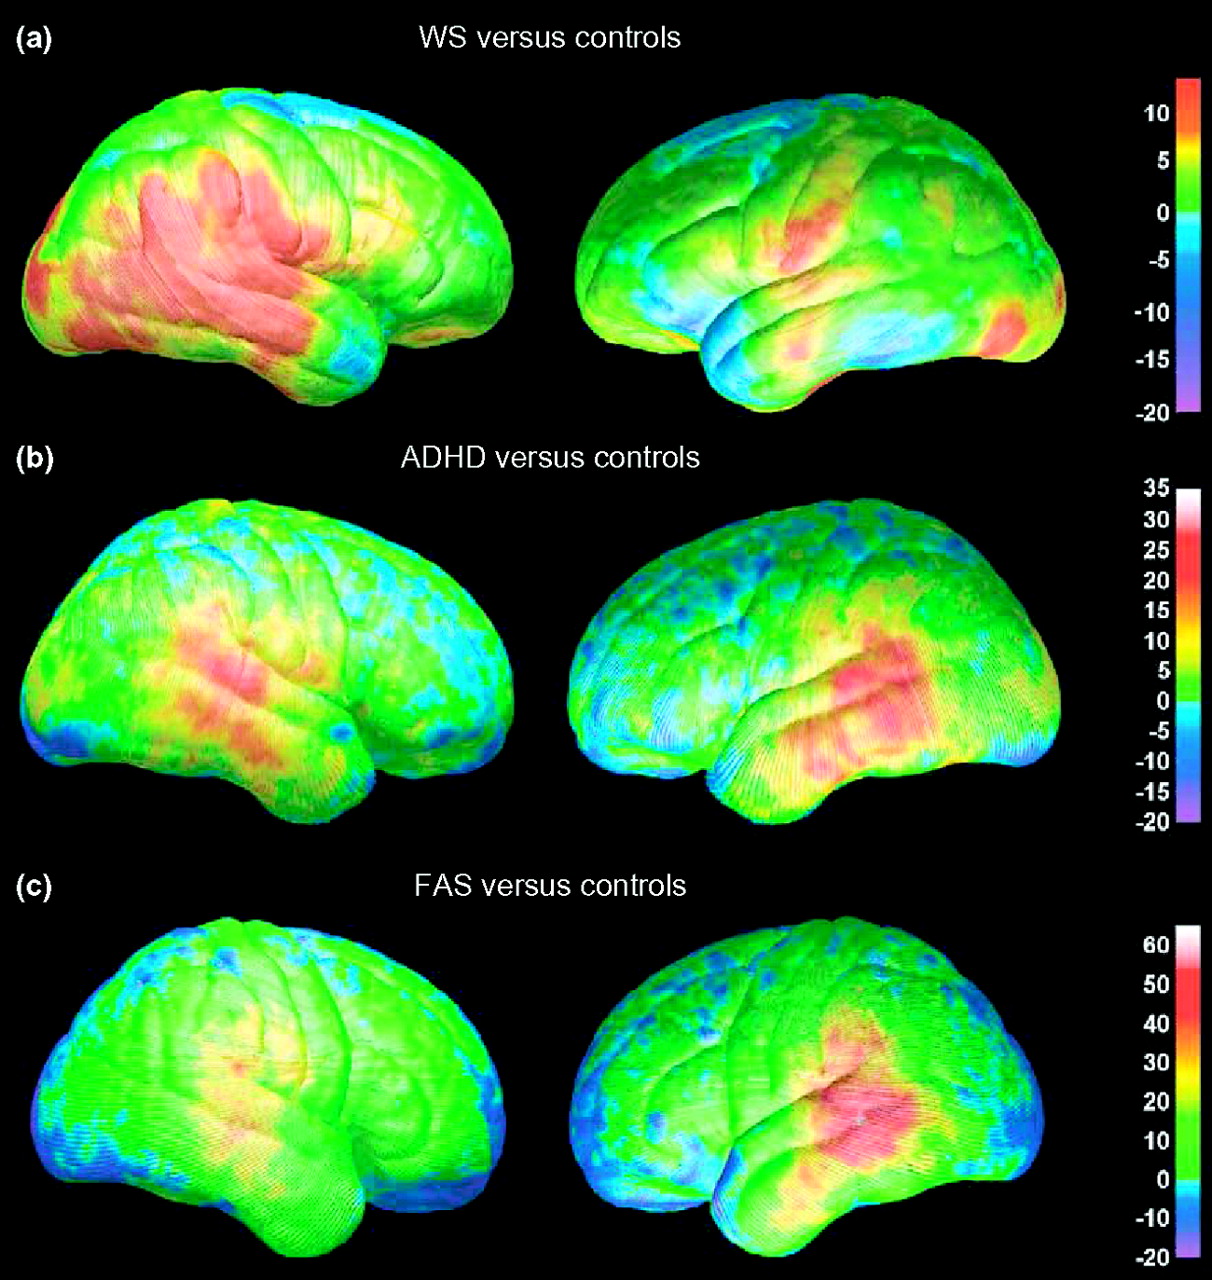
Brain imaging has also helped to identify circumscribed alterations in brain structure that are associated with developmental disorders that have genetic causes. Williams syndrome (WS), for example, is a developmental disorder associated with a deletion of ~20 genes in the 7q11.23 region of chromosome 7. WS subjects have mild to moderate mental retardation, but have remarkable proficiencies in language skills, social drive and musical ability. Figure 7 shows a range of brain regions affected by this genetic deletion: in general, the cortex is thinner, except in perisylvian language regions, where it is thicker by 5–10%; cortical complexity is also significantly increased (36). In post-mortem data from WS subjects, Holinger et al. (37) observed larger cells in Heschl’s gyrus in the primary auditory area—a finding congruent with the cortical thickening seen here. WS subjects also have disproportionately reduced white matter, so cortical cells fitting over a smaller white-matter area can ‘pile up’, and the cortex can thicken owing to a crowding effect. Some Wnt signaling genes, which direct early cell differentiation and segmentation, are in the deleted 7q11.23 chromosomal region, suggesting a genetic basis for the cortical dysmorphology observed on MRI. Other genes deleted in WS might normally contribute to fissure formation in the human cortex, and their absence might account for the abnormal cortical thickening. Ongoing work is examining the changes in folding complexity in the same regions that show thickened cortex, to ensure that this thickening is not simply a consequence of increased gyrus formation (e.g. microgyria often appears as thickened cortex, when in fact it is thinner, four-layered cortex). If cortical thickness and complexity were positively correlated in general, the frontal and parietal regions of greater gyrification found in studies of WS (e.g. (38)) would be expected to show greater cortical thickness, but this was not found. There is, therefore, no simple relationship between thickness and complexity, and careful study of these measures in larger samples is warranted. Alternatively, the cortical thickening might represent an adaptive response to the genetic deletion, perhaps even from increased use or overuse of specific cortical networks. Identification of such neuroanatomical characteristics of WS is important for better understanding of the scope and timing of the cortical anomaly in WS.

Attention-deficithyperactivity disorder

ADHD is a much more common, and less debilitating, disorder of childhood than childhood-onset schizophrenia and WS. Nonetheless, volumetric structural brain-imaging studies of ADHD patients have demonstrated subtle reductions in total brain volume, and in volumes of the right frontal lobe and caudate nucleus (39, 40). To further understanding of brain abnormalities in ADHD, brain mapping studies were conducted in 27 children and adolescents with ADHD and in 46 age-matched and gender-matched control subjects (41). As predicted, abnormal morphology was observed in the frontal cortices of ADHD subjects, with reduced regional brain size localized primarily to inferior portions of dorsal prefrontal cortices bilaterally. Brain size was also reduced in anterior temporal cortices bilaterally. Gray-matter density was prominently increased in large portions of the posterior temporal and inferior parietal cortices bilaterally (Figure 7). The etiology and cognitive and behavioral sequelae of this increased gray-matter density and regionally reduced brain size are not yet understood, but these regions of the brain are known to be part of an action-attention network probably involved in the symptomatology of ADHD (discussed in (41)).

Fetal alcohol syndrome

Brain mapping has also identified anomalies in developmental disorders with known environmental causes. Fetal alcohol syndrome (FAS) is a severe neurodevelopmental disorder observed in children whose mothers abused alcohol during pregnancy (42, 43). Not all women who abuse alcohol during pregnancy have children with FAS, but it is quickly becoming more evident from animal and both postmortem and in vivo human studies that the brain is especially vulnerable to the teratogenic effects of alcohol. Children with FAS display prenatal growth deficiency, developmental delay, craniofacial anomalies (i.e. microcephaly, epicanthal folds and short palpebral fissures) and limb defects. Cognitive deficits in these children are significant and mental retardation is frequently observed, but a clear neuropsychological profile has yet to be discovered (44).
In vivo quantitative MRI studies have confirmed brain morphological abnormalities in children prenatally exposed to alcohol. In addition to the microcephaly frequently observed in these children, volumetric MRI studies have shown that within the cortex, only the parietal lobes were significantly reduced in volume above and beyond the generalized brain size reduction. White-matter hypoplasia (i.e. incomplete development) was more significant than gray-matter hypoplasia, and hippocampal volume was relatively intact (45). These volumetric findings prompted use of cortical mapping techniques to assess brain abnormalities on a more local level. Localized abnormalities in brain size and gray-matter density were identified in a group of 21 children, adolescents and young adults with severe prenatal alcohol exposure compared with 21 age-matched and gender-matched non-exposed subjects (46). The resulting brain maps con-firmed parietal lobe size reductions observed in the volumetric studies, and revealed frontal lobe size reductions that had not been previously observed. In fact, frontal lobe abnormalities were predicted given these children’s deficits on neuropsychological tests of executive functioning (47). Furthermore, gray-matter density increases were observed bilaterally in the inferior parietal and posterior temporal lobes (Figure 7). These mapping studies suggest that brain growth continues to be adversely affected long after the pre-natal insult of alcohol exposure to the developing brain, and the regions most prominently affected are consistent with the behavioral and neuropsychological deficits in these children.

Similarities among the developmental disorders

It is interesting to note the regional correspondence of gray-matter density abnormalities observed in three of the four neurodevelopmental disorders reviewed here. As shown in Figure 7, gray-matter density increases were observed in perisylvian (language) cortices in ADHD (41), WS (36) and FAS (46). The magnitude of increase in gray matter relative to their respective control groups varies across the disorders, with maxima of ~30% in ADHD, 10% in WS and 50% in FAS. The spatial extent of these gray-matter density increases also varies across the disorders, and is bilateral in ADHD and FAS, but more prominent in the right hemisphere in WS. These disorders are distinct in terms of their etiologies and neurocognitive deficit profiles, although various levels of language impairment are observed in all three disorders. Facial dysmorphology is present in both FAS and WS. Of particular relevance might be that ADHD diagnoses are common among children with FAS (48) and WS (49). Perhaps the similar profile of gray-matter density abnormalities observed in these three groups are related to the common symptoms of ADHD. Functional and structural imaging studies evaluating children that have ADHD, WS with ADHD, WS without ADHD, FAS with ADHD, and FAS without ADHD might yield interesting results, although they would be difficult given the relative rarity of WS in particular. These examples are illustrative only and summarize visualizations derived from different studies (e.g. case-control studies of FAS, WS and ADHD). Further studies are required in which the magnitudes and spatial patterns of the effects in the different patient groups are directly compared. Such direct comparisons would have to take into account possible confounding factors, because the children were assessed on different scanners at different imaging centers.

Genetic influences on the developing brain

In the quest to understand what factors contribute to the trajectory of brain development in normally developing children and those with neurodevelopmental disorders, genetic and imaging methods can be combined to answer questions about the influence of genes and environment on brain structure—the so-called nature–nurture debate. With this in mind, twins or family members with different degrees of genetic affinity can be compared. Of course, influences of nature and nurture in the determination of individual brain structure are not independent. Nonetheless, twin designs can reveal the degree to which heredity is involved.

Twin studies

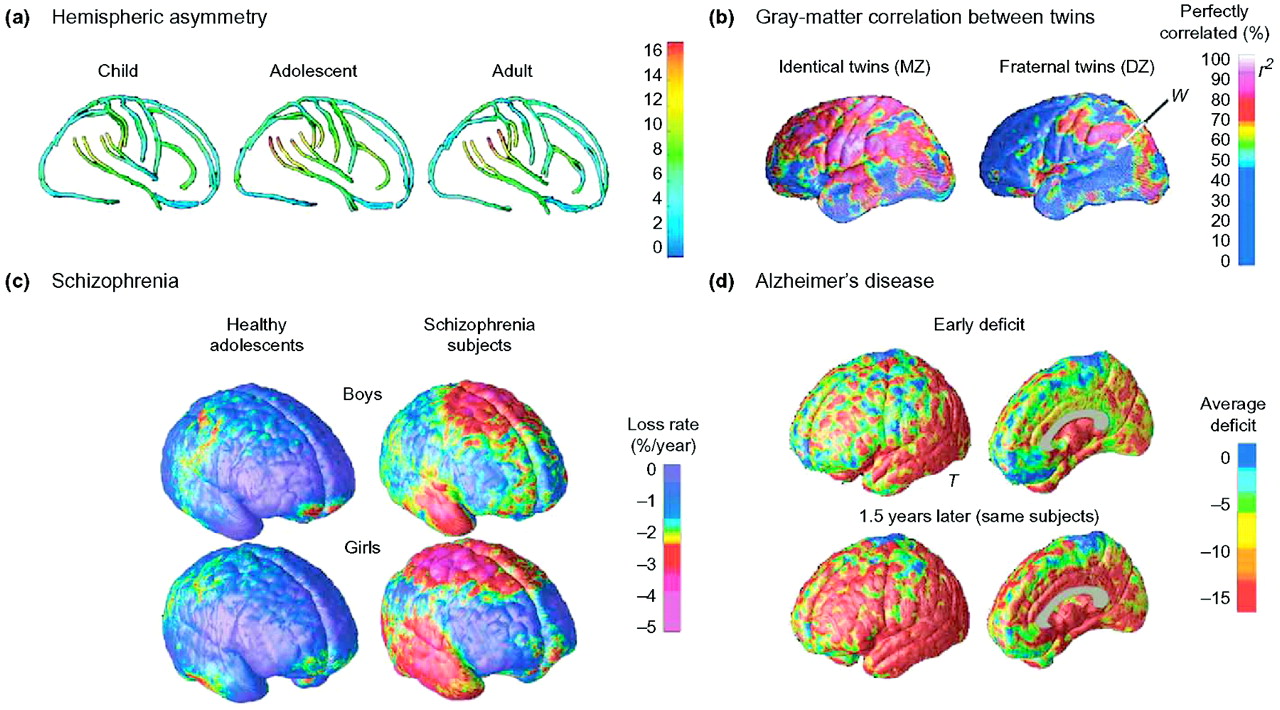
Probably the best known twin database is the Finnish twin registry, which covers information on twin births in Finland from 1940 and has been a resource to many epidemiological studies recognized worldwide. These data enabled investigation of which brain regions develop under tight genetic control and which are more influenced by the environment. Before that, twins had been studied using MRI and some similarities in the volumes of brain structures had been noted in identical twins, with weaker resemblance in fraternal twins. In 2001, utilizing this database, the first study of twins using brain mapping revealed aspects of brain structure that are largely inherited (50).
Forty healthy adult subjects, consisting of ten monozygotic and ten dizygotic twin pairs (five male pairs and five female pairs in each group) were drawn from a twin cohort consisting of all the same-sex twins born in Finland between 1940 and 1957 for which both members of each pair were alive and still residing in Finland. All the subjects were scanned and 3D maps of gray matter and models of cortical surface anatomy were derived. Monozygotic pairs were then matched with the dizygotic pairs. Gray-matter volumes in the frontal parts of the brain were more closely matched in the identical twins than in twins who were less similar genetically. One interpretation of the findings is that areas of the brain involved in process and rule learning (e.g. frontal lobe structures) are under more tight genetic control, at least in terms of gross structural development, than areas of the brain that map life experience and content (the temporal and parietal lobes).
The finding that the gross anatomy of the frontal cortex develops under such strong genetic control is also of practical use for genetic studies of disease. These genetically mediated structural differences have even been linked, using genetic brain-mapping methods, with known genetic markers that are overrepresented in patients with frontal lobe deficits (51).

Limitations of brain-imaging studies
As we have shown, MRI used in both cross-sectional and longitudinal studies gives precious data on normal and pathological brain development. Key information is now coming from the large-scale analysis of data from children scanned longitudinally using MRI. Moreover, advances in MRI techniques other than anatomical MRI are now offering additional perspectives on the functional development of the brain. Functional MRI studies are now emerging as a tool to study brain development, as are fiber-mapping studies using DTI to track connections and how they develop during maturation.
However, several limitations need to be acknowledged. Some are technical. For example, because it requires considerable statistical power to detect systematic differences in brain structure, sample size is a major issue, especially when rare disorders are considered. MRI data can be heterogeneous. Scan databases are only now becoming large enough to stratify images of brain development by symptom profiles, therapeutic response and currently identified risk factors.
MRI has some limits in resolving distinctions between gray and white matter that are relevant when assessing maturational changes. Recent algorithms for measuring cortical thickness (13) rely on definition of a boundary between gray and white matter, or at least on a proportion of tissue identified as gray matter (in the case of gray-matter density). As gray matter becomes more myelinated, the border between gray and white changes, and can be displaced toward the pia. One factor in the cortical thinning seen in adolescence is not absolute diminution of the cortical gray matter, but rather a change in the gray–white segmentation boundary because of increasing intracortical myelin with age, which might shift the gray–white junction further into the cortical mantle. Other anatomical features might also affect the accurate segmentation of gray and white matter on magnetic resonance images. The inner band of Baillarger, for instance, is so richly myelinated that in brain sections it is visible with the naked eye, close to the gray–white interface in layer 5b; this might affect the ability to define an accurate cortical boundary in conventional magnetic resonance images. Further studies with improved tissue classification algorithms, tissue relaxometry and high-field imaging (providing increased resolution and contrast-to-noise ratio) are likely to resolve some of these limitations.
Other issues concern the interpretation given to some data. The key question is: what does a change in the volume of a brain region mean, especially when one considers pathology (Figure 8)? Even if the volume and shape of brain structures are determined, to identify the underlying cellular cause of these differences one must rely on using additional sources of information, such as post-mortem tissue. Nevertheless, these MRI studies are likely to help us better understand the links between changes in the brain and cognitive development, in addition to the clinical course of development and treatment of illnesses.
Figure 1. Typical processing steps in an analysis of MRI brain scans
(a) Atypical coronal section from a T1-weighted MRI scan of the brain. (b) The result of applying a tissue-classification approach to classify image voxels as gray matter (green), white matter (blue) or cerebrospinal fluid (CSF; red). Non-brain tissues such as scalp and meninges surrounding the brain have been digitally edited from the image. (c) Parcellation of the brain into the frontal lobe (blue), parietal lobe (green), occipital lobe (red) and temporal lobe (yellow). This subdivision of anatomy is performed with the aid of a cortical surface model on which sulcal landmarks separating the lobes can be reliably identified. Once partitioned in this way, the volumes of each tissue type in the major lobes can be computed and growth curves established for each major lobe. The quantity of gray and white matter in the brain and of CSF in the ventricles and cortical sulci can be computed and compared across subjects and overtime. Maps of these tissue types (b) can be used to calculate shape, size and other statistics, and can also be subdivided into smaller regions to determine the amount of each tissue type in each lobe (c).
Figure 2. Cortical thickness maps
(a) An in vivo average cortical-thickness map created from 45 normally developing children at their first scan (12). The brain surface is color coded according to the bar on the right, where thickness is shown in millimeters. The average thickness map can be compared to an adapted version of the 1929 cortical thickness map of von Economo (15) (b). Color coding has been applied over his original stippling pattern, respecting the boundaries of his original work, to highlight the similarities between the two maps. Reproduced, with permission, from (12).
Figure 3. Annualized rate of change in cortical thickness
The average rate of change in cortical thickness is shown in millimeters according to the color bar on the right (maximum gray-matter loss is shown in shades of red and maximum gray-matter gain is shown in shades of blue). Forty-five children were studied twice (two-year scan interval) between 5 and 11 years of age. Reproduced, with permission, from (12).
Figure 4. Brain-behavior maps for vocabulary and cortical thickness
P values are for negative correlations between change in cortical thickness (time 2 minus time 1, as shown in figure 2 of (12)) and change in vocabulary raw scores (time 2 minus time 1). Negative P values (i.e. regions where greater thinning was associated with greater vocabulary improvement) are color-coded, and regions in white showed no significant association. Positive correlations were not significant in the permutation analyses for any of the regions of interest, and are not shown here. Reproduced, with permission, from (12).
Figure 5. Mapping brain change overtime
Brain changes in development can be identified by fitting time-dependent statistical models to data collected from subjects cross-sectionally (i.e. across a group of subjects at a particular time), longitudinally (i.e. following individual subjects as they aged), or both. Measurements such as cortical thickness are then plotted onto the cortex using a color code. (a,b) Trajectory of gray-matter loss over the human lifespan, based on a cohort of 176 subjects aged 7–87 years (11). Plots superimposed on the brain in (b) show how gray-matter density decreases for particular regions; (a) highlights example regions in which the gray-matter density decreases rapidly during adolescence (the superior frontal sulcus) or follows a more steadily declining time-course during lifespan (the superior temporal sulcus). (c,d) Trajectory of cortical gray-matter density in 13 children scanned longitudinally every two years for eight years (4). The units used in (a) and (d) are gray-matter density, which is defined as the proportion of tissue segmenting as gray matter within a 15-mm-diameter sphere centered at each point on the cortical surface. This widely-used measure ranges from 0 to 1, and is highly correlated with cortical thickness (52).
Figure 6. Tensor maps of growth and tensor-based morphometry
(a) The corpus callosum (indicated by a green box) of a healthy three-year-old girl in a sagittal section from a 3D MRI scan. Using a follow-up scan thee years later, an elastic deformation field is computed that digitally aligns, or warps, the anatomy of the earlier time-point to match its shape at the later time point. The amount of local stretching of the anatomy is color-coded, indicating fastest growth rates (red) in the anterior corpus callosum. In a related approach (b), maps can be compiled to represent the average expansion factor required to deform an average corpus callosum shape elastically onto each subject in a set of healthy children and matched autistic children. This identifies areas of the corpus callosum that are thinner in autistic children, pinpointing where abnormal white-matter growth might lead to the disorder in early childhood. The letters ‘S’ and ‘R’ denote the splenium and rostrum of the corpus callosum, respectively. Data in (a) is adapted, with permission, from (22); (b) is adapted, with permission, from (53).
Figure 7. Differences in gray-matter density between subjects with three neurodevelopmental disorders
The percentage differences in gray-matter density between subjects with Williams syndrome (WS) (a), attention-deficit–hyperactivity disorder (ADHD) (b), fetal alcohol syndrome (FAS) (c) and their respective normally developing control groups are color-coded. In all maps, warmer colors represent positive differences, indicating an increase in the patient group (arbitrarily coded as 1) relative to the control group (arbitrarily coded as 0), with red representing the largest group difference. Note that the maximum value varies on the three color bars, depending on the maximum group difference from each comparison. Adapted, with permission, from (36, 41, 46).
Figure 8. Statistical maps of cortical structure. Various maps can be made that describe different aspects of cortical anatomy
These include maps of gyrus-pattern asymmetry (a) and how strongly genes and environmental influence brain structure (b). Panel (a) shows the increasing gyrus-pattern asymmetry in groups of children, adolescents and adults (55). In these maps, the differences in asymmetry in the three age groups can be evaluated as the angle of the left relative to the right Sylvian fissure in each age group. Note the angle is larger in the adults than in the children. The color coding enables the displacement in millimeters between the left and right hemisphere within each age group to be visualized. Asymmetry measures can also be extended to rest of the cortical surface and expressed in millimeters. Panel (b) shows correlations in gray matter for groups of identical (monozygotic, MZ) and fraternal (dizygotic, DZ) twins. Some brain regions develop under tight genetic control, and these include many frontal and temporal lobe regions, such as the dorsolateral prefrontal cortex and temporal poles (red). Other regions are more strongly influenced by the environment as they develop (i.e. a greater proportion of the inter-subject variance is explained by non-genetic factors). (c) Average maps of gray-matter loss rates for healthy boys and girls, scanned longitudinally over five years. Also shown are maps of the considerably faster loss rates in age-matched and gender-matched subjects with childhood-onset schizophrenia scanned at the same ages and intervals. The frontal cortex underwent a selective rapid loss of gray matter (up to 3–4% per year faster in patients than controls). These changes might be, in some respects, an exaggeration of changes that normally occur in adolescence (10,54). By contrast, deficits occurring as Alzheimer’s disease progresses are shown (d) by comparing average profiles of gray-matter density between 12 Alzheimer’s disease patients (mean age 68.4 ± 1.9 years) and 14 age-matched controls (mean age 71.4 ± 0.9 years). In Alzheimer’s disease, gray-matter loss sweeps forward in the brain from limbic to frontal cortices in concert with cognitive decline, but in the schizophrenia patients (c), the frontal cortices lose gray matter the fastest. The letters ‘W’ and ‘T’ denote Wernicke’s area and the temporal cortex, respectively.

Footnote

(Reprinted with permission from Trends in Neurosciences March 2006; 29(3):148–159 )

References

1.
Huttenlocher, P.R. (1979) Synaptic density in human frontal cortex–developmental changes and effects of aging. Brain Res. 163, 195–205
2.
Yakovlev, P.I. and Lecours, A.R. (1967) The myelogenetic cycles of regional maturation of the brain. In Regional Development of the Brain in Early Life (Minkowski, A, ed.), pp. 3–70, Blackwell Scientific
3.
Benes, F.M. et al. (1994) Myelination of a key relay zone in the hippocampal formation occurs in the human brain during childhood, adolescence, and adulthood. Arch. Gen. Psychiatry 51, 477–484
4.
Gogtay, N. et al. (2004) Dynamic mapping of human cortical development during childhood and adolescence. Proc. Natl. Acad. Sci. 101, 8174–8179
5.
Jernigan, T.L. and Tallal, P. (1990) Late childhood changes in brain morphology observable with MRI. Dev. Med. Child Neurol. 32, 379–385
6.
Jernigan, T.L. et al. (1991) Maturation of human cerebrum observed in vivo during adolescence. Brain 114, 2037–2049
7.
Paus, T. et al. (1999) Structural maturation of neural pathways in children and adolescents: in vivo study. Science 283, 1908–1911
8.
Sowell, E.R. et al. (1999) In vivo evidence for post–adolescent brain maturation in frontal and striatal regions. Nat. Neurosci. 2, 859–861
9.
Sowell, E.R. et al. (1999) Localizing age–related changes in brain structure between childhood and adolescence using statistical parametric mapping. NeuroImage 9, 587–597
10.
Thompson, P.M. et al. (2001) Mapping adolescent brain change reveals dynamic wave of accelerated gray matter loss in very early-onset schizophrenia. Proc. Natl. Acad. Sci. U. S. A. 98, 11650–11655
11.
Sowell, E.R. et al. (2003) Mapping cortical change across the human life span. Nat. Neurosci. 6, 309–315
12.
Sowell, E.R. et al. (2004) Longitudinal mapping of cortical thickness and brain growth in normal children. J. Neurosci. 24, 8223–8231
13.
Thompson, P.M. et al. (2004) Mapping cortical change in Alzheimer’s disease, brain development, and schizophrenia: special issue on mathematics in brain imaging. NeuroImage 23(Suppl 1), S2–S18
14.
Giedd, J.N. et al. (1999) Brain development during childhood and adolescence: a longitudinal MRI study. Nat. Neurosci. 2, 861–863
15.
Von Economo, C.V. (1929) The Cytoarchitectonics of the Human Cerebral Cortex, Oxford Medical Publications
16.
Sowell, E.R. et al. (2001) Mapping continued brain growth and gray matter density reduction in dorsal frontal cortex: inverse relationships during postadolescent brain maturation. J. Neurosci. 21, 8819–8829
17.
Wechsler, D. (1991) Manual for the Wechsler Intelligence Scale for Children, 3rd edn, The Psychological Corporation
18.
Sowell, E.R. et al. (2004) Mapping changes in the human cortex throughout the span of life. Neuroscientist 10, 372–392
19.
Mesulam, M.M. (2000) A plasticity–based theory of the pathogenesis of Alzheimer’s disease. Ann. N. Y. Acad. Sci. 924, 42–52
20.
Thompson, P.M. et al. (2003) Dynamics of gray matter loss in Alzheimer’s disease. J. Neurosci. 23, 994–1005
21.
Toga, A.W. and Thompson, P.M. (2003) Temporal dynamics of brain anatomy. Annu. Rev. Biomed. Eng. 5, 119–145
22.
Thompson, P.M. et al. (2000) Growth patterns in the developing brain detected by using continuum-mechanical tensor maps. Nature 404, 190–193
23.
Martin, E. et al. (1988) Developmental stages of human brain: an MR study. J Comp Assist Tomogr. 12, 917–922
24.
Grodd, W. (1993) Normal and abnormal patterns of myelin development of the fetal and infantile human brain using magnetic resonance imaging. Curr. Opin. Neurol. Neurosurg 6, 393–397
25.
Hansen, P.E. et al. (1993) MR imaging of the developing human brain, part 1. Radiographics 13, 21–36
26.
Wang, Z. et al. (1998) The research of myelinization of normal fetal brain with magnetic resonance imaging. Chin. Med. J. (Engl.) 111, 71–74
27.
Neil, J. et al. (2002) Diffusion tensor imaging of normal and injured developing human brain—a technical review. NMR Biomed. 15, 543–552
28.
Gilmore, J.H. et al. (2004) 3 Tesla magnetic resonance imaging of the brain in newborns. Psychiatry Res. 132, 81–85
29.
Toga, A.W. et al. (2001) Probabilistic approaches for atlasing normal and disease-specific brain variability. Anat. Embryol. (Berl.) 204, 267–282
30.
Thompson, P.M. et al. (2001) Mapping adolescent brain change reveals dynamic wave of accelerated gray matter loss in very early–onset schizophrenia. Proc. Natl. Acad. Sci. U. S. A. 98, 11650–11655
31.
Feinberg, I. and Guazzelli, M. (1999) Schizophrenia—a disorder of the corollary discharge systems that integrate the motor systems of thought with the sensory systems of consciousness. Br. J. Psychiatry 174, 196–204
32.
Cannon, T.D. et al. (2002) Cortex mapping reveals regionally specific patterns of genetic and disease–specific gray–matter deficits in twins discordant for schizophrenia. Proc. Natl. Acad. Sci. U. S. A. 99, 3228–3233
33.
Weinberger, D.R. and McClure, R.K. (2002) Neurotoxicity neuroplasticity, and magnetic resonance imaging morphometry: what is happening in the schizophrenic brain? Arch. Gen. Psychiatry 59, 553–558
34.
Bartzokis, G. et al. (2003) White matter structural integrity in aging and Alzheimer’s disease: a magnetic resonance imaging study. Arch. Neurol. 60, 393–398
35.
Lieberman, J.A. et al. (2005) HGDH Study Group (2005). Antipsychotic drug effects on brain morphology in first–episode psychosis. Arch. Gen. Psychiatry 62, 361–370
36.
Thompson, P.M. et al. (2005) Abnormal cortical complexity and thickness profiles mapped in Williams syndrome. J. Neurosci. 25, 4146–4158
37.
Holinger, D.P. et al. Relative sparing of primary auditory cortex in Williams syndrome. Brain Res. (in press)
38.
Schmitt, J.E. et al. (2002) Increased gyrification in Williams syndrome: evidence using 3D MRI methods. Dev. Med. Child Neurol. 44, 292–295
39.
Filipek, P.A. et al. (1997) Volumetric MRI analysis comparing subjects having attention–deficit hyperactivity disorder with normal controls. Neurology 48, 589–601
40.
Semrud-Clikeman, M. et al. (2000) Using MRI to examine brain–behavior relationships in males with attention deficit disorder with hyperactivity. J. Am. Acad. Child Adolesc. Psychiatry 39, 477–484
41.
Sowell, E.R. et al. (2003b) Cortical abnormalities in children and adolescents with attention deficit hyperactivity disorder. Lancet 362, 1699–1707
42.
Jones, K.L. and Smith, D.W. (1973) Recognition of the fetal alcohol syndrome in early infancy. Lancet 2, 999–1001
43.
Jones, K.L. (1975) The fetal alcohol syndrome. Addict. Dis. 2, 79–88
44.
Mattson, S.N. and Riley, E.P. (1998) A review of the neurobehavioral deficits in children with fetal alcohol syndrome or prenatal exposure to alcohol. Alcohol. Clin. Exp. Res. 22, 279–294
45.
Archibald, S.L. et al. (2001) Brain dysmorphology in individuals with severe prenatal alcohol exposure. Dev. Med. Child Neurol. 43, 148–154
46.
Sowell, E.R. et al. (2002) Regional brain shape abnormalities persist into adolescence after heavy prenatal alcohol exposure. Cereb. Cortex 12, 856–865
47.
Mattson, S.N. et al. (1999) Executive functioning in children with heavy prenatal alcohol exposure. Alcohol. Clin. Exp. Res. 23, 1808–1815
48.
O’Malley, K.D. and Nanson, J. (2002) Clinical implications of a link between fetal alcohol spectrum disorder and attention-deficit hyperactivity disorder. Can. J. Psychiatry 47, 349–354
49.
Bawden, H.N. et al. (1997) Treatment of children with Williams syndrome with methylphenidate. J. Child Neurol. 12, 248–252
50.
Thompson, P.M. et al. (2001) Genetic influences on brain structure. Nat. Neurosci. 4, 1253–1258
51.
Cannon, T.D. et al. (2003) Early and late neurodevelopmental influences in the prodrome to schizophrenia: contributions of genes, environment, and their interactions. Schizophr. Bull. 29, 653–669
52.
Thompson, P.M. et al. (2004) Structural abnormalities in the brains of human subjects who use methamphetamine. J. Neurosci. 24, 6028–6036
53.
Leow, A. et al. (2005) Brain structural mapping using a novel hybrid implicit/explicit framework based on the level–set method. Neuro-Image 24, 910–927
54.
Sowell, E.R. et al. (2002) Mapping sulcal pattern asymmetry and local cortical surface gray matter distribution in vivo: maturation in perisylvian cortices. Cereb. Cortex 12, 17–2654

Information & Authors

Information

Published In

History

Published online: 1 August 2006
Published in print: August 2006

Authors

Details

Metrics & Citations

Metrics

Citations

Export Citations

If you have the appropriate software installed, you can download article citation data to the citation manager of your choice. Simply select your manager software from the list below and click Download.

For more information or tips please see 'Downloading to a citation manager' in the Help menu.

Format
Citation style
Style
Copy to clipboard

View Options

View options

PDF/EPUB

View PDF/EPUB

Get Access

Login options

Already a subscriber? Access your subscription through your login credentials or your institution for full access to this article.

Personal login Institutional Login Open Athens login
Purchase Options

Purchase this article to access the full text.

PPV Articles - Focus

PPV Articles - Focus

Not a subscriber?

Subscribe Now / Learn More

PsychiatryOnline subscription options offer access to the DSM-5-TR® library, books, journals, CME, and patient resources. This all-in-one virtual library provides psychiatrists and mental health professionals with key resources for diagnosis, treatment, research, and professional development.

Need more help? PsychiatryOnline Customer Service may be reached by emailing [email protected] or by calling 800-368-5777 (in the U.S.) or 703-907-7322 (outside the U.S.).

Media

Figures

Other

Tables

Share

Share

Share article link

Share