CBT INTEGRITY
Average adherence ratings (1–7) across the group CBT sessions ranged from 6.2 to 6.9, with a total average of 6.5 (SD = 0.3), indicating excellent adherence overall. Also, there were no differences in group CBT adherence ratings between PDA + C (M = 6.53, SD = 0.33) and PDA (M = 6.52, SD = 0.45). As expected, the average number of CBT strategies per session targeting panic disorder in the individual treatment case notes was significantly higher in PDA (M = 2.14, SD = 0.97) than PDA + C (M = 0.31, SD = 0.98), t(32) = 5.44, p < 0.001. Consistent with our design, the average number of CBT strategies per session targeting comorbid disorders in the individual treatment case notes was significantly higher in PDA + C (M = 1.80, SD = 1.23) than PDA (M = 0.20, SD = 0.59), t(32) = 4.8, p < 0.001. The two treatment conditions did not differ in averaged credibility ratings (0–8 point scale): PDA + C M = 6.1 (SD = 1.5), PDA M = 6.2 (SD = 1.0), t(33) = −0.3 ns.
BASELINE
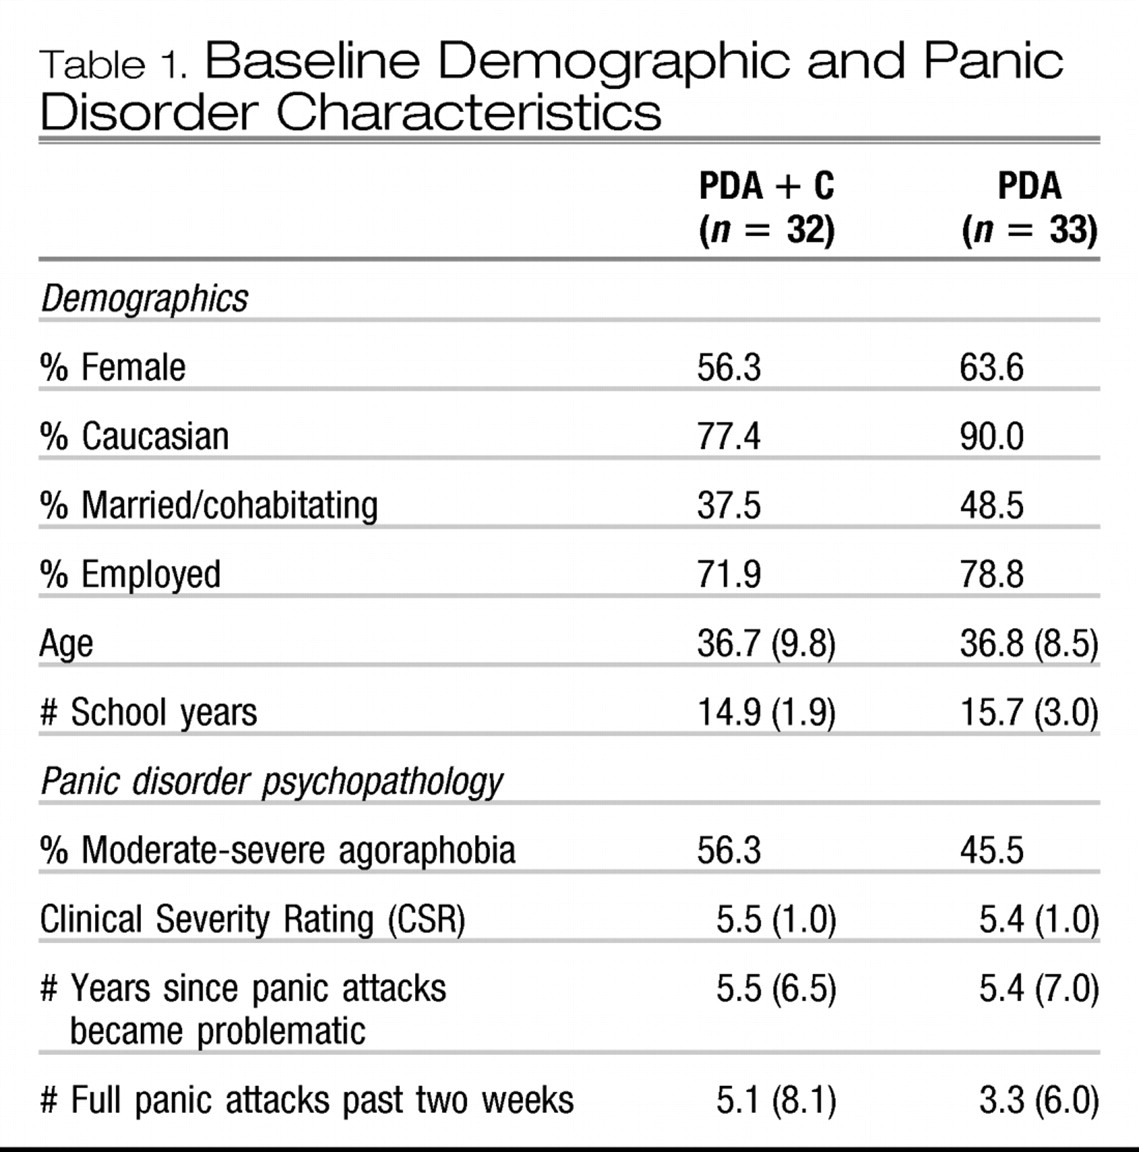
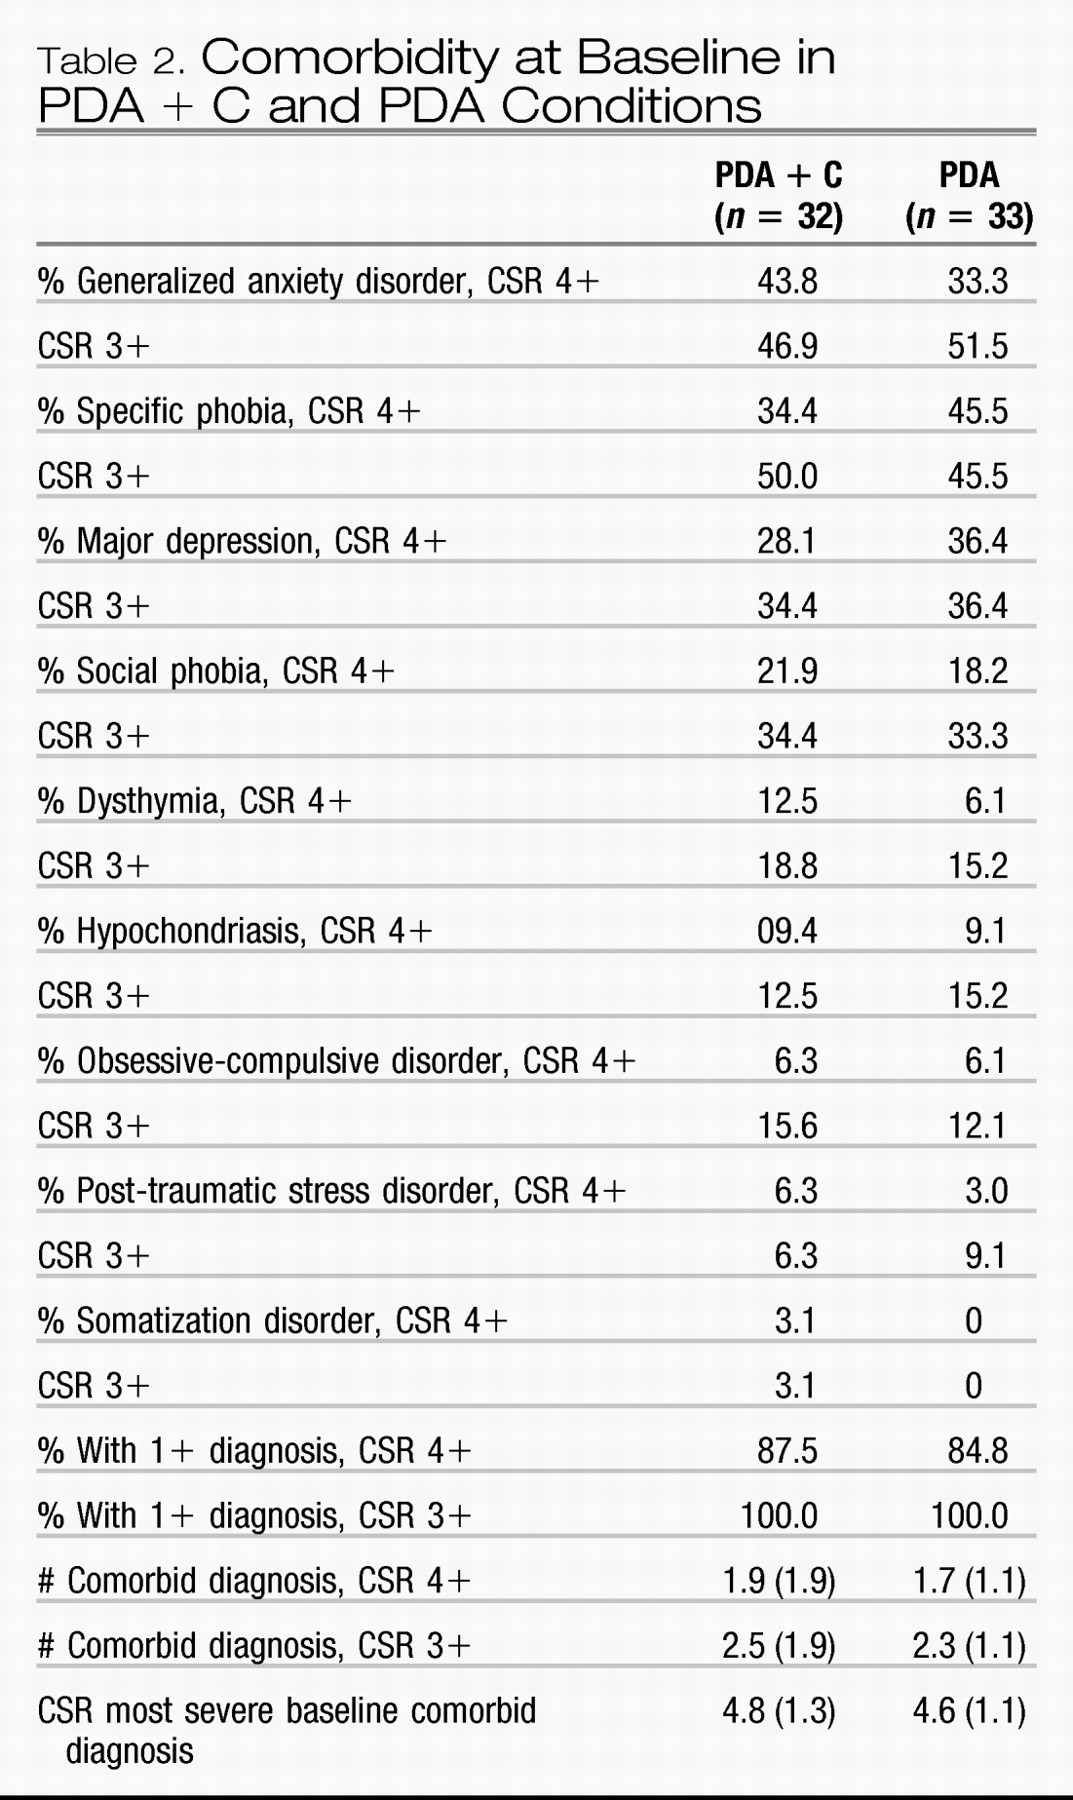
PDA + C and PDA groups did not differ on any demographic, diagnostic, self-report or medication variables (see
Tables 1 and
2). The average CSR rating for panic disorder/agoraphobia was 5.5 (SD = 1.0) and 51% of the entire completer sample was diagnosed with moderate to severe levels of agoraphobia. Overall, participants averaged 4.2 (SD = 7.1) panic attacks in the last 2 weeks, and 5.4 years (SD = 6.7) since panic attacks became problematic.
Rates of comorbid diagnoses with CSR values of 4 or higher for the entire sample were as follows (rates for diagnoses with CSR values of 3 or higher are in parentheses): generalized anxiety disorder, 38.5% (49.2%); specific phobia, 43.1% (47.7%); major depression, 32.3% (33.8%); social phobia, 20% (33.8%); dysthymia, 9.2% (16.9%); hypochondriasis, 9.2% (13.8%); obsessive compulsive disorder, 6.2% (13.8%); posttraumatic stress disorder, 4.6% (7.7%); and somatization, 1.5% (1.5%). Rates did not differ between the treatment conditions for any comorbid diagnosis (see
Table 2). Overall, 86.2% met criteria for at least one anxiety or mood comorbid disorder with a CSR of 4 or higher, as did 100% with a CSR of 3 or higher. Four (12.5%) PDA + C participants and five (15.2%) PDA participants had baseline comorbid diagnoses with CSR values of 3, ns. The average
number of comorbid diagnoses with CSRs of 4 or higher was 1.8 (SD = 1.6) and the average total number of comorbid diagnoses, including those with CSR = 3, was 2.4 (SD = 1.5); these mean values did not differ between treatment conditions. The average CSR of the most severe comorbid diagnosis at baseline was 4.7 (SD = 1.2) and again there were no differences between conditions. Which particular comorbid diagnosis was most severe at baseline did not differ between the groups; generalized anxiety disorder (PD + C = 11, PDA = 12), specific phobia (PDA + C = 9, PDA = 9), depression/dysthymia (PDA + C = 10, PDA = 10), social phobia (PDA + C = 4, PDA = 6), hypochondriasis (PDA + C = 3, PDA = 3), obsessive compulsive disorder (PDA + C = 2, PDA = 1) and posttraumatic stress disorder (PDA + C = 1, PDA = 1).
9EFFECT OF TREATMENT UPON PANIC DISORDER/AGORAPHOBIA
The overall statistical approach involved repeated measures ANOVAs, followed by linear and quadratic within subject contrasts to evaluate patterns of change from baseline, to post-treatment and follow-up between the two treatment conditions. Categorical data were analyzed using Fisher exact tests. Bonferroni corrections were not applied due to the risk of Type II error in small sample sizes (e.g.,
Legendre & Legendre, 1998).
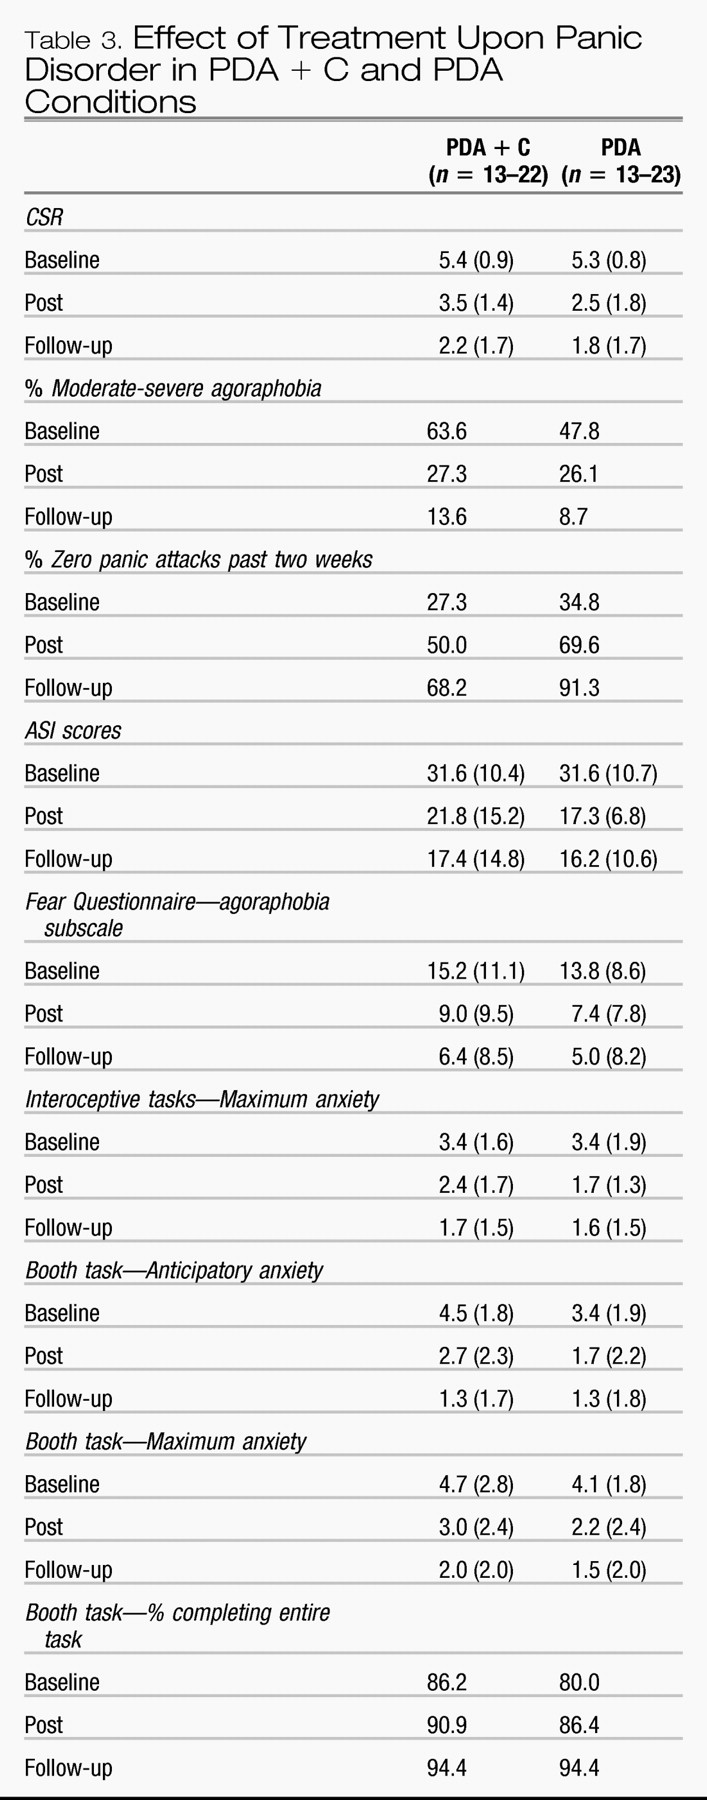
Three participants completed treatment but failed to complete post assessment (1, PDA + C; 2, PDA) and seven failed to complete follow-up assessments (5, PDA + C; 2, PDA). Hence, final sample sizes were 22 for PDA + C and 23 for PDA. Additional participants failed to complete the self-report battery across all three assessments; final sample sizes were 17 for PDA + C and 18 for PDA for questionnaire data. Means and standard deviations are shown in
Table 3. Those who completed treatment but failed to complete either post or follow-up assessments did not differ from those who completed treatment and all three assessments on any diagnostic or questionnaire measure.
CSRs associated with panic disorder declined significantly over time,
F(2, 86) = 109.5,
p < 0.001, ES = 0.72, although the effects for Condition and Condition × time were non-significant (ES = 0.05). The percentage of participants rated as moderately to severely agoraphobic also decreased from 55.6% to 26.7% at post and 11.1% at follow-up, and there were no differences between treatment conditions. The percentage of those with zero panic attacks in the last two weeks increased over time (see
Table 3), with a trend for proportionately more of PDA reporting zero panic attacks at follow-up,
X2(1) = 3.8,
p = 0.05. High end-state functioning was operationalized as panic disorder/agoraphobia CSR of 0–2, none to mild agoraphobia, and zero panic attacks. Proportionately more of PDA (47.8%) reached high end-state at post-treatment than PDA + C (18.2%),
X2(1) = 4.5,
p < 0.05, although proportions did not differ at follow-up, at which time 61% of the PDA and 55% of PDA + C reached high end-state status. The same pattern of results was obtained when analyses were restricted to participants with comorbid diagnoses associated with CSR values of 4 or higher at baseline (PDA,
n = 18; PDA + C,
n = 18).
Scores on the ASI and FQ-A each declined significantly over time,
F(2, 68) = 34.9,
p < 0.001, ES = 0.51, and
F(2, 68) = 50.66,
p < 0.001, ES = 0.60, but the effects for condition (ES = 0.00 and 0.01) and Condition × Time (ES = 0.00) were non-significant. Means and standard deviations are shown in
Table 3.
Anticipatory and maximum anxiety ratings averaged across the three interoceptive tasks correlated strongly (coefficients ranged from
r = 0.75 to 0.87, and averaged
r = 0.81). Hence, only the maximum anxiety ratings were analyzed. In contrast, anticipatory and maximum anxiety ratings were less strongly correlated for the booth task (coefficients ranged from 0.51 to 0.84, and averaged 0.65). Hence, booth task anticipatory and maximum anxiety ratings were analyzed separately. Behavioral approach test data were obtained from 13 PDA + C and 17 PDA participants across all three assessments. The effect of Time was significant in each case; interoceptive tasks maximum anxiety,
F(2, 56) = 28.39,
p < 0.001, ES = 0.50; booth task anticipatory anxiety,
F(2, 56) = 24.10,
p < 0.001, ES = 0.46, and booth task maximum anxiety,
F(2, 56) = 31.97,
p < 0.001, ES = 0.53). Means and standard deviations are shown in
Table 3. However, effects were not significant for Condition (ES = 0.01–0.05) or Condition × Time (ES = 0.01–0.06). Almost all participants completed each interoceptive task at baseline and therefore duration was not analyzed. However, the proportion who endured the full ten minutes in the booth increased over time, from 85.3% at baseline to 94.4% at follow-up, without differences between conditions.
Intent-to-treat:
Intent-to-treat analyses were conducted by carrying forward baseline diagnostic data for participants who dropped during treatment or who completed treatment but failed to complete post assessments (n = 13), and carrying forward post-treatment data for participants who failed to complete follow-up assessments (n = 7), yielding sample sizes of PDA + C = 32 and PDA = 33. The CSR values declined over time, F(2, 128) = 76.4, p < 0.001, ES = 0.54. There was no effect of condition (ES = 0.02) or Condition × Time (ES = 0.02), although the quadratic effect of the interaction was significant, albeit yielding a small effect size, F(1, 64) = 4.3, p < 0.05, ES = 0.06, due to a trend towards greater reductions in CSR values by post-treatment in the PDA condition, t(64) = 1.8, p < 0.08. The percentage who remained moderately to severely agoraphobic in the entire intent-to-treat sample was 29.2% at post and 18.5% at follow-up. Corresponding numbers for zero panic attacks were 60% at post and 73.8% at follow-up; there were no differences between conditions. However, significantly more PDA (36.4%) than PDA + C (12.5%) participants met criteria for high end-state at post-treatment, X2(1) = 3.9, p < 0.05, although no differences were apparent at follow-up, at which time 44.6% of the entire sample met criteria for high end-state functioning. Again, the pattern of results did not differ when analyses were restricted to participants with baseline comorbid diagnoses associated with CSR values of 4 or higher.
EFFECT OF TREATMENT UPON COMORBID CONDITIONS
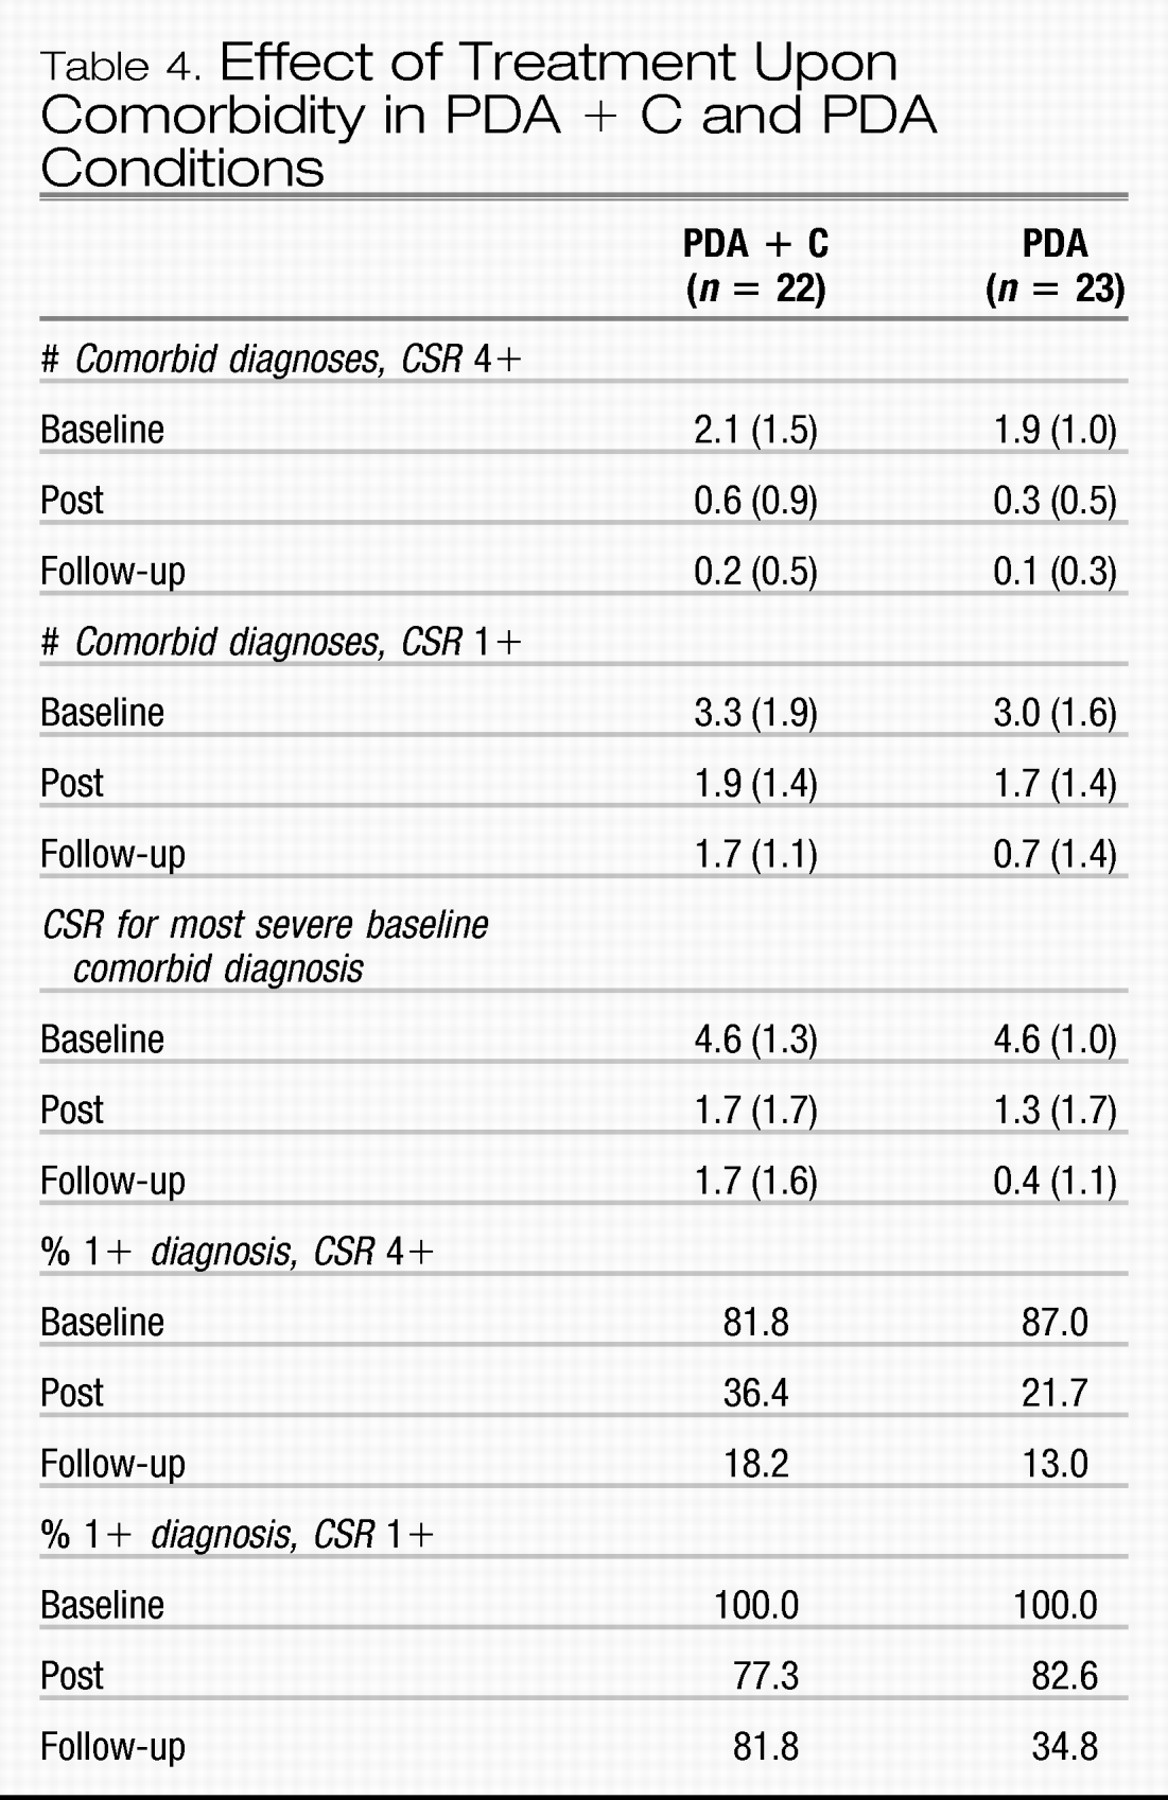
The number of comorbid conditions with CSRs of 4 or higher declined over time,
F(2, 86) = 72.0,
p < 0.001, ES = 0.63, but the effects of condition (ES = 0.03) and Condition × Time (ES = 0.01) were not significant. Means and standard deviations are shown in
Table 4. The total number of comorbid conditions (including diagnoses with CSRs = 1–3) also declined over time,
F(2, 86) = 31.6,
p < −0.001, ES = 0.42, but again with no effects of condition (ES = 0.05) or Condition × Time (ES = 0.03). The proportion of participants with any comorbid diagnosis with CSRs of 4 or higher reduced from 84.4% at baseline to 28.9% at post-treatment, and 15.6% at follow-up, with no differences between conditions. However, the proportion of participants with any comorbid diagnosis of clinical (CSR 4 +) or subclinical (CSR 1–3) severity reduced from 100% at baseline to 80% at post, and 57.8% at follow-up, with proportionately fewer PDA participants having any such diagnoses at follow-up (34.8%) than PDA + C (81.8%),
X2(1) = 10.2,
p < 0.01. Most importantly, CSR values for the most severe baseline comorbid diagnosis not only declined over Time,
F(2, 86) = 99.1,
p < 0.001, ES = 0.70, but in a way that tended to differ between the conditions,
F(2, 86) = 3.0,
p < 0.06, ES = 0.07, and specifically due to a significant Condition × Time linear interaction effect,
F(1, 43) = 6.1,
p < 0.05, ES = 0.11. Whereas both conditions decreased from baseline to post-treatment, PDA showed a pattern of continuing reduction from post to follow-up,
t(22) = 2.5,
p < 0.05, while PDA + C showed no further improvement from post to follow-up. The pattern of results did not differ when analyses were restricted to participants with comorbid diagnoses associated with CSR values of 4 or higher at baseline.
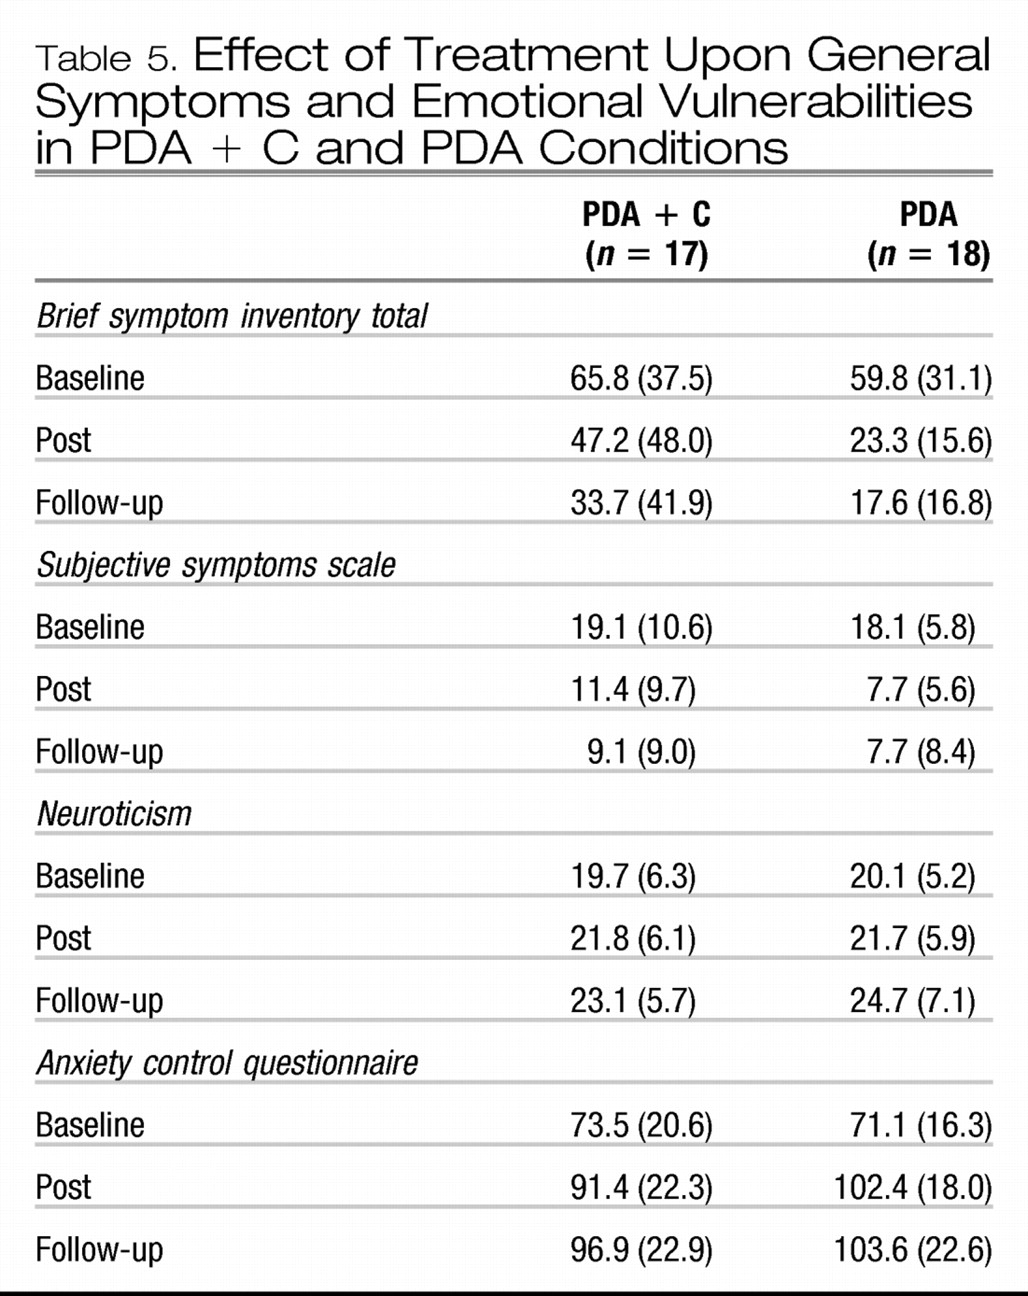
Scores on the BSI declined over time,
F(2, 66) = 29.0,
p < 0.001, ES = 0.47, as did scores on the SSS,
F(2, 66) = 33.7,
p < 0.001, ES = 0.51. Although the Condition × Time interaction terms were not significant for SSS (ES = 0.02) or BSI (ES = 0.06), the quadratic interaction effect was significant for BSI,
F(1, 33) = 4.0,
p = 0.05, ES = 0.10), due to lower severities at post-treatment in PDA vs. PDA + C,
t(19.9) = 2.23,
p < 0.05. Means and standard deviations are shown in
Table 5.
Scores on the NEO increased significantly over time,
F(2, 64) = 11.5,
p < 0.001, ES = 0.23, as did scores on the ACQ,
F(2, 64) = 32.9,
p < 0.001, ES = 0.51. Although trends indicated greater increases in ACQ by post and follow-up in the PDA group, neither the interaction terms nor the linear and quadratic contrasts were significant (ES = 0.04–0.06) (means and SD's are shown in
Table 5).
The intent-to-treat analyses replicated the overall reductions in the number of comorbid diagnoses with CSR values of 4 or higher, F(2, 126) = 77.7, p < 0.001, ES = 0.55, and with CSR values of 1 or higher, F(2, 126) = 29.7, p < 0.001, ES = 0.32, without interaction effects (ES = 0.02 and 0.03). In addition, the intent-to-treat analyses rendered the Condition × Time interaction effect for the CSR for the most severe baseline comorbid diagnosis a trend only, with a very small effect size, F(2, 126) = 2.4, p = 0.1, ES = 0.04. However, the linear contrast effect for the interaction term showed a trend to significance, F(1, 63) = 3.9, p = 0.05, ES = 0.07, due to a lower CSR value at post-treatment in the PDA group, t(64) = 2.5, p < 0.05, and due to the CSR value continuing to decrease from post to follow-up within the PDA group, t(32) = 2.4, p < 0.05, but not within the PDA + C group. The percentage of the entire intent-to-treat sample with at least one comorbid diagnosis with CSR of 4+ was 43.1% at post and 35.4% at follow-up, with no differences between conditions. However, the percentage with at least one comorbid diagnosis of any severity at follow-up remained significantly different between conditions in the intent-to-treat sample (PDA + C = 87.5%, PDA = 51.5%), X2(1) = 9.9, p < 0.01. The pattern of results was replicated when analyses were restricted to participants with CSRs of 4 or higher for baseline comorbid diagnoses.
PREDICTORS OF COMORBIDITY AT FOLLOW-UP
Hierarchical linear regressions were used to evaluate predictors of CSR values of the most severe baseline comorbid diagnosis at follow-up. All variables were first centered. Severity of the most severe comorbid diagnosis at baseline was entered on the first step; changes in panic disorder CSR, BSI and SSS values from pre- to post-treatment were entered on the second step using a forward stepwise approach; and post-treatment measures of emotional vulnerability (NEO, ACQ) were entered on the third step, again using a forward stepwise approach. After controlling for CSRs for the most severe comorbidity at baseline, R2 = 0.002, β = 0.047, ns, only scores on the ACQ at post-treatment, R2 = 0.15, β = −0.38, p < 0.05, F(1, 38) = 6.4, p < 0.05, added significantly to the CSR value of the comorbid diagnosis at follow-up. The same result was obtained when the sum of CSR values of all comorbidity at baseline was entered on step 1, to predict the sum of CSR values of all comorbidity at follow-up.
