This review will examine the clinical role of the electrophysiological evaluation of brain function in children and adolescents with learning and attention disorders. The focus will be on computerized methods of quantifying EEG features and the clinical utility of comparing features obtained from specific patient populations against normative values. The current status of quantitative EEG (QEEG) studies will be reviewed with the goal of extracting information that would be useful to the practicing clinician.
Although some controversy exists over the routine use of QEEG in neurological and psychiatric patients, even the most critical reviews indicate that QEEG can be an adjunct to conventional EEG interpretation. These selective reviews of the literature conclude that QEEG may be useful in patients with possible cardiovascular disease or dementia, although QEEG is considered to be under investigation in patients with postconcussion syndrome, mild to moderate head injury, learning and attention disorders, schizophrenia, and mood disorders.
1,2 Two recent papers used more extensive literature citations and concluded that QEEG can play an important role in patients with suspected cardiovascular accidents and those with possible dementia, learning and attention problems, mood disorders, and postconcussion syndrome, as well as in mild to moderate head injury cases.
3,4The possible clinical uses of QEEG were described in a recent position paper of the American Medical Electroencephalographic Association,
5 and a more recent review prepared for the American Psychiatric Electrophysiological Association summarized evidence for the clinical utility of QEEG in dementia, mood disorders, mild head injury, learning disabilities and attention disorders, and schizophrenia.
3 The clinical roles included the detection of organicity as the underlying cause of brain dysfunction, along with possible roles in differential diagnosis and epileptic source localization. To this list we add possible roles in determining appropriate medication selection, in following treatment response, and in delineating the underlying etiology of learning and attention disorders.
Within this review, QEEG studies will be examined as they relate to these clinical uses, omitting studies of epileptic source localization that are beyond the scope of this paper. In addition, because appropriate use of QEEG requires an adequate examination of the collected EEG via conventional methods (visual inspection) prior to quantification, relevant EEG studies and their clinical utility will also be examined.
FINDINGS FROM AUTHORS' NEUROMETRIC QEEG STUDIES OF ADHD/ADD AND LEARNING DISORDERS
Several relevant neurometric QEEG studies were reviewed in preceding sections of this paper.
14,17,24–26,44 In the remainder of this article we review our own previously published studies using neurometric QEEG in the evaluation of children with learning and attention problems
49,50,51 and present previously unpublished results that 1) evaluate the nature of QEEG abnormalities in ADHD as a function of age, 2) use cluster analysis techniques to describe QEEG based neurophysiological subtypes of learning and attention disorders, and 3) use variable resolution electromagnetic tomography (VARETA)
52 to examine the cortical and subcortical neuroanatomical structures implicated as dysfunctional in each of these subtypes.
The populations of children and the QEEG recording technique involved in our previously published studies and in the new findings to be presented are described below in the Methodology section. A summary of all EEG and QEEG studies included in this section and the preceding review of attention disorders can be found in
Table 2A and Table 2B.
Methodology
Normal Population:
All QEEG measures were compared against a data base of 310 normal children between the ages of 6 and 16 years. All “normal” subjects were free of neurological or medical disease, had no history of head injury, or drug or alcohol abuse, were of normal IQ, showed evidence of normal functioning at home and school for the past 2 years, and had not taken any prescription medication for at least 90 days prior to evaluation.
Attention Disorder Population:
All children were referred to the Developmental Paediatrics and Learning Disorders Clinic in Sydney, Australia. Children with histories of epilepsy, drug abuse, head injury, or psychotic disorders were excluded. In the initial visit each child underwent a QEEG and a clinical evaluation by a behavioral neurologist. At this time, the Conners' parent/teacher rating scale and the DSM-III rating scales of inattention, impulsivity, and hyperactivity, measures of reading and math achievement, and the Wechsler IQ test for children were also obtained. The resultant sample consisted of 268 children with normal IQ and 76 with IQ scores between 65 and 85. Within this sample of children, 179 reached DSM-III criteria for ADHD, and 165 for ADD without hyperactivity. A learning disorder secondary to the attention disorder was found in 97 (54.2%) of the ADHD children and 103 (62.4%) of the ADD children. Repeat behavioral and QEEG evaluations were obtained on 130 of these children 6 to 10 months after the initiation of treatment with either methylphenidate or dextroamphetamine.
Learning Disorder Population:
The children with specific learning disorders were obtained from the previously described studies of John and associates.
14 Children with problems with hyperactivity were excluded, and all had been selected by their respective school systems because of learning problems. These children had no known neurological disorder. The majority of these children would meet current diagnostic criteria for specific developmental learning disorder. This sample included 127 children (mean age=11.4 years) whose learning disorder occurred in only one academic area and who had normal full-scale IQ scores, and 115 children (mean age=11.8 years) whose learning disorder spanned two or more academic areas and who had full-scale IQ scores between 65 and 84.
QEEG Data Acquisition:
Patients were seated comfortably in a sound- and light-attenuated room during the evaluation. One to two minutes of artifact-free eyes-closed resting EEG was extracted from 20 to 30 minutes of continuous EEG. Monopolar recordings were obtained by using the 19 electrodes of the International 10/20 System referred to electrodes placed on linked earlobes. Bipolar features were constructed by computer during offline analysis. Bipolar locations included left and right frontal/temporal, temporal, central, and parietal/occipital regions. QEEG features computed were absolute and relative power, mean frequency, and inter- and intrahemispheric coherence and asymmetry. Each feature was calculated for the delta, theta, alpha, beta, and total frequency bands for each of the 19 monopolar and 8 bipolar derivations, and compared with the normal data base of children by using Z-scores after age-regression and appropriate mathematical transformations to ensure the Gaussianity of each extracted QEEG measure.
Previously Published Findings
This section summarizes the findings from our previously published research involving children with attention and learning problems as described above.
49–51 The majority of ADHD and ADD children in both the normal and low IQ groups showed QEEG abnormalities when compared with the normal data base. QEEG frequency abnormalities occurred in more than 80% of this population, theta and alpha excess being the most prevalent abnormal finding. Frontal and central regions were the most likely to be involved, and when the abnormality was generalized, its magnitude was usually greatest in these regions. Both interhemispheric and intrahemispheric abnormalities were often present. They included 1) hypercoherent theta or alpha activity between left and right frontal recordings and between frontal and temporal recordings within each hemisphere; 2) decreased coherence or incoherence between left and right posterior temporal and parietal regions; 3) frontal/posterior power asymmetry within each hemisphere reflecting increased frontal power; and 4) left/right hemisphere power asymmetry in posterior temporal and parietal regions, with the right hemisphere most likely to show a power excess. Two major subtypes of QEEG abnormality were identified involving theta and/or alpha excess accompanied by either normal or decreased alpha mean frequency. QEEG indices of a maturational lag (i.e., a
Z-score that would be normal at a younger age) accounting for the neurophysiological abnormality were present in about 7% of the ADHD/ADD children and were localized mainly in posterior regions. However, QEEG indications of a deviation from normal development (i.e., score not normal at any age) were much more prevalent; they were present in about 35% of these children and were localized mainly to frontal and central regions.
50We used stepwise multivariate discriminant procedures to examine the sensitivity and specificity of several two-way comparisons.
49,50 A discriminant function was developed that distinguished normal from ADHD/ ADD children with a sensitivity of 93.7% and a specificity of 88.0%, using QEEG features that reflected the abnormalities described above. QEEG differences between the normal and low-IQ ADHD/ADD children and between the ADHD and ADD children were present but minimal in comparison to the differences between the normal and ADD/ADHD populations. The presence or absence of a secondary learning disorder did not contribute to any of the QEEG differences observed. However, when the ADHD/ADD population was compared with a population of children who had a learning disorder not secondary to an attention problem, QEEG differences were found. ADHD/ADD children could be distinguished from children with learning disorders with a sensitivity of 97.0% and a specificity of 84.2%.
QEEG also proved useful in the management of treatment response to stimulant medication.
49,51 Within the ADHD/ADD population, QEEG differences were found between those who showed a short-term (initial response to one dose) positive response to treatment with dextroamphetamine or methylphenidate and those who did not benefit. Although the sensitivity and specificity levels of this discriminant function were modest (68.7% and 67.5%), the function was very accurate (84.8%) in classifying children who had shown a previous negative response to either dextroamphetamine or methylphenidate. Pre-treatment QEEG and behavioral measures showed a sensitivity of 83.1% and a specificity of 88.2% in predicting long-term treatment response to either dextroamphetamine or methylphenidate. Within our ADHD population, 93.7% of the children with alpha excess, 83.3% of those with beta excess, and 75% of those with theta excess showed a positive long-term response to stimulants. None of the ADHD children with an alpha or beta excess showed a negative response to either stimulant, whereas 17.5% of the children with a theta excess showed a negative response to treatment with dextroamphetamine. Within our population of ADD children, 66.7% of the beta excess, 54.5% of the alpha excess, and 33.3% of the theta excess children showed a positive response to stimulant therapy. None of the ADD children with a beta excess showed a negative response to either stimulant, although 1 of 8 ADD children with an alpha excess treated with methylphenidate showed a negative long-term response. In contrast, the likelihood of a negative response to either dextroamphetamine or methylphenidate reached 30% for the children with theta excess. These results and those reported by Monastra et al.
40 begin to answer earlier critical questions raised by Levy and Ward about the sensitivity and specificity of QEEG studies for aiding in the diagnosis of ADHD and the possible prediction of medication response in ADHD.
53New QEEG Findings
In this section, two issues are examined that were not completely addressed by our studies described above. The first involves whether QEEG abnormalities in ADHD/ADD children reflect a delay in normal brain maturational processes or instead represent a deviation from normal development. The second issue involves identification of the neurophysiological subtypes that can be seen in the ADHD/ADD and learning disorder populations and an examination of how these subtypes might be related to the basic neurophysiological, neurochemical, and neuroanatomical systems that are involved in attention and learning.
ADHD/ADD: Maturational Lag or Developmental Deviation?
As stated previously, the neurometric QEEG features of maturational lag and developmental deviation indicated that a developmental deviation was present in 35% of our sample and was localized mainly to frontal and central regions, whereas signs of maturational lag were localized in mainly posterior regions and were present in only 7%. To seek further evidence of maturational lag as the underlying neurophysiological mechanism involved in ADHD/ADD, the QEEGs of our ADHD/ADD population were assessed as a function of age. Multiple analyses of variance (ANOVAs) were used to compare relative power, absolute power, mean frequency, power asymmetry, and coherence values across four age ranges: 5–7, 8–10, 11–13, and 14–17 years. The degree of QEEG abnormality remained stable, with no significant systematic decreases in the degree of abnormality occurring across this age span. Thus, when QEEG values are age-regressed, the pattern of normal versus ADHD/ADD differences remains constant from the early school years into late adolescence.
Neurophysiological Subtypes in ADHD/ADD and LD Populations:
Cluster analyses procedures were used to identify the major neurophysiological subtypes within our population of 344 ADHD/ADD and 245 LD/SLD children. In order to comply with the statistical assumptions underlying cluster analyses, we preselected QEEG features and limited the number entered into the analyses in a systematic fashion. The QEEG variables chosen were those for which the highest ANOVA values were obtained when comparing the ADHD/ADD children with normal subjects, the LD/SLD children with normal subjects, and the ADHD/ADD with the LD/SLD children. Further, we selected those variables that showed the greatest variance across the entire population of children. Cluster analyses were performed using 35 QEEG variables that met these criteria. These analyses included measures of relative and absolute power, mean frequency, and interhemispheric and intrahemispheric power asymmetry and coherence. An iterative approach was taken as we examined cluster solutions starting at three clusters and progressing until the next new structure failed to further subdivide the population into clusters with more than 10 members. Thus we examined three-, four-, five-, and six-cluster solutions. The five-cluster solution showed the most clearly defined cluster structure, since the three- and four-cluster solutions contained one very large cluster and the six-cluster solution introduced a new cluster with only 8 members. The cluster analyses were performed on split-half replications of our database as well as on the entire database. The split-half results both were optimal for five clusters and replicated each other and the cluster analysis performed on the entire data set. Thus, the results obtained from the entire data set are presented here.
The significant QEEG findings that distinguish each of these clusters from the normal population follow. Cluster 1 was characterized by a generalized excess of alpha and deficit of delta absolute and relative power, frontal theta and alpha hypercoherence, and parietal and posterior temporal power asymmetry. Cluster 2 was characterized by a generalized excess of theta absolute and relative power, decreased alpha mean frequency, and frontal theta hypercoherence. Cluster 3 was characterized by a generalized deficit of theta, alpha, and beta absolute power, a generalized excess of delta and deficit of alpha relative power, frontal alpha incoherence, and normal power asymmetry values. Cluster 4 was characterized by excess frontal/central delta and theta and a generalized deficit of alpha absolute power; generalized delta and theta excess and an alpha deficit of relative power; decreased theta and alpha mean frequency; frontal and central alpha incoherence; and frontal, central, and temporal power asymmetry. Cluster 5 was characterized by essentially normal QEEG findings, although there was a nonsignificant frontal elevation of delta absolute and relative power.
In this five-cluster solution, more than 98% of the ADHD/ADD children were placed into clusters 1 or 2 (note that in the split-half replication, cluster solutions the figures were 98.6% and 92.1%, respectively). The children with learning disorders were evenly distributed across the five clusters in all cases. Long-term stimulant treatment response data were available on 49 ADD/ADHD children from cluster 1 and on 59 ADD/ ADHD children from cluster 2. Within cluster 1, 75.5% showed a positive response to stimulants,18.4% no measurable change, and 6.1% a negative response. Within cluster 2, 50.8% showed a positive response to stimulants, with 33.9% showing no change, and 15.2% showing a negative response. This finding supports the notion that the two clusters of ADD/ADHD children represent two different neurophysiological subtypes. In addition, as stated previously, a discriminant function has been calculated by using a combination of behavioral and QEEG measures that has high sensitivity and specificity for estimating the likelihood that a positive treatment response will be obtained to stimulant therapy.
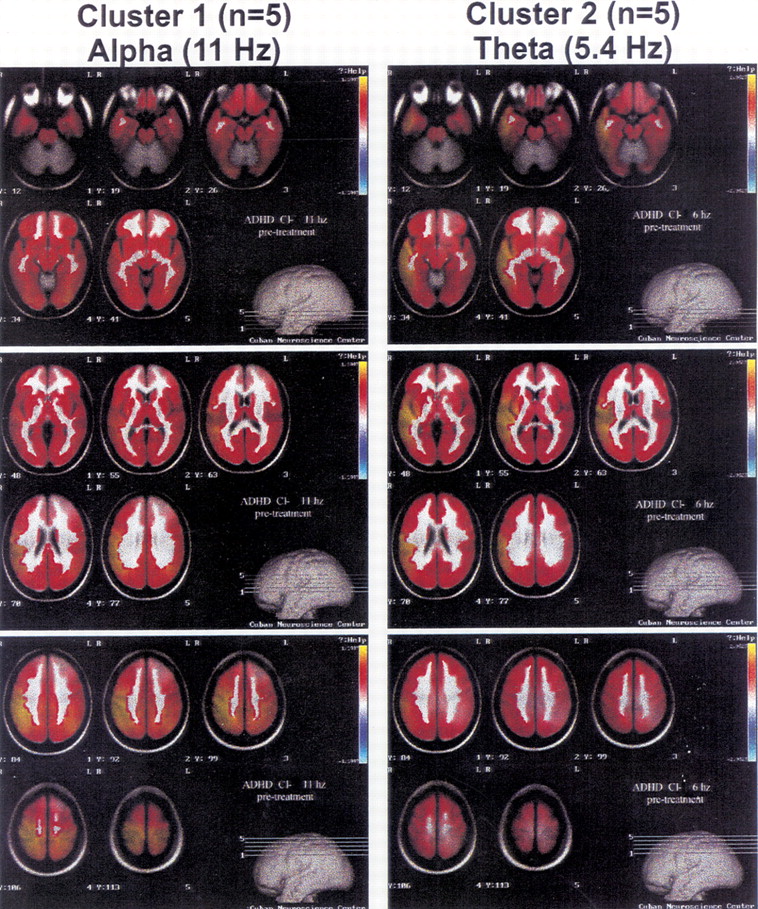
51Variable Resolution Electromagnetic Tomography (VARETA)
We used VARETA
54 in an exploratory fashion to localize possible neural sources of the absolute power frequency abnormality that was most deviant for clusters 1 and 2, which included 98% of the ADHD/ADD children. At the present time, technical problems prevent us from examining the VARETA results for the LD/SLD children. VARETA was accomplished by applying a mathematical inverse solution to the EEG data at the selected frequency.
52 The power localized in each voxel of the inverse solution was log- and
Z-transformed relative to age-appropriate normative distributions of voxel power at each frequency and depicted on slices obtained from a probabilistic MRI atlas,
54a color-coded for statistical significance.
55Figure 1 presents the VARETA images for the average of the 5 children closest to the centroid of clusters 1 and 2, respectively. The three panels on the left side of the figure present average VARETA images from the children in cluster 1 at 11 Hz, and the three panels on the right the images from cluster 2 children at 5.4 Hz. VARETA images from cluster 1 show primarily cortical abnormalities that are maximal and appear to originate in the right parietal cortical region. VARETA images from cluster 2 show primarily temporal cortical and hippocampal abnormalities. VARETA images at 5.4 Hz for cluster 1 and at 11 Hz for cluster 2 were within normal limits and are not presented.
PROPOSED NEUROPHYSIOLOGICAL MODEL OF ADHD/ADD
The results of the cluster analyses described above indicate that the major QEEG frequency abnormalities seen in ADHD/ADD involve excess of theta or alpha absolute and/or relative power. Further, evidence exists that two different but interconnected neural systems are involved in the generation of EEG within the theta and alpha frequency bands.
69,70 Theta appears to be generated within the septal-hippocampal pathway, whereas the alpha frequency involves thalamocortical and cortical-cortical circuitry. Within the theta generating septal-hippocampal pathway, the septal nucleus and the nucleus accumbens receive inhibitory modulation through dopaminergic innervation from the ventral tegmental area, via dopamine D
2 receptors.
71,72 Cholinergic efferents modulate hippocampal and cingulate cortex, with these hippocampal pathways acting to regulate the septal nucleus. Thus, a theta excess can occur with an overactivation of the septal-hippocampal pathway or secondarily via disinhibition from negative dopaminergic regulation.
73 Within the thalamocortical alpha-generating pathway, several different perturbations can result in an alpha excess. This thalamic pathway receives positive modulation from the midbrain reticular formation via acetylcholine, and negative regulation through the nucleus reticularis of the thalamus via gamma-aminobutyric acid, with further modulation via the dopaminergic striatal/nigral system. Disregulation of this system can lead to an alpha excess by 1) hyperactivation of the thalamus that may be secondary to overstimulation of the midbrain reticular formation due to decreased modulation via the dopaminergic nigral system or 2) hypoactivation of the prefrontal cortex and a resulting disinhibition from nucleus reticularis. Thus, both theta and alpha excess might result from low dopamine levels, and our QEEG findings, as well as the neuroimaging studies described above, are in agreement with the dopaminergic theory of ADHD expressed by Levy,
74 which conceptualizes ADHD as a disorder of the polysynaptic dopaminergic circuits between prefrontal and striatal centers of activity. These findings are also compatible with the neurophysiological model of ADHD proposed by Niedermeyer and Naidu,
75 which also emphasizes prefrontal, frontal, and striatal and thalamic interconnections.
The pharmacological literature also supports the hypothesis that ADHD is a heterogeneous disorder that can result from disturbances in the neurophysiological systems involved in the generation of the theta and alpha frequency bands. Children with ADHD often show differential responses to treatment with dextroamphetamine versus methylphenidate. Recently Lin et al.
76 reported that in cats, although both stimulants activate the whole brain, dextroamphetamine has a greater influence on the stria terminalis and methylphenidate is more active in the mediofrontal cortex, which contains the cingulate gyrus. These sites are part of the two systems hypothesized as being involved in the generation of the theta and alpha frequency bands. Behavioral and neurophysiological studies of the localization of attention processes indicate that the septal/hippocampal circuit in conjunction with the prefrontal cortex provides for mechanisms of selective attention and general expectancy processes,
77 with thalamic nuclei part of the cortical-limbic-reticular network of attention function.
78,79 Our findings involving the localization of QEEG frequency abnormality mainly to frontal and central cortical regions often accompanied by posterior interhemispheric coherence and symmetry abnormality, taken in conjunction with the MRI and PET findings described above, are in agreement with current neuroanatomical theories of attention processes.
80,81 These theories suggest that attentional processes involve the right hemisphere and are divided into an anterior system (involving cingulate cortex) that serves executive and control functions and a posterior system (localized in the parietal, posterior temporal, and occipital cortex) that is responsible for selective and shifting attention .
The above-mentioned studies indicate substantial agreement across QEEG, MRI, and PET imaging studies, as well as across behavioral, pharmacological, and neuroanatomical studies, on the nature of cortical and subcortical disturbances in function that characterize children with attention and learning problems. In our opinion, attention deficit disorder cannot be conceptualized as a single disease entity with a very narrow phenotype and a distinct etiology. Rather, it represents a spectrum of disorders that may be represented by different neurophysiological subtypes present within the population of children with attention and learning problems.
QEEG may prove to be the most clinically relevant imaging technique for use in children with attention and learning problems. It has several advantages over other neuroimaging techniques, including the following: QEEG is less expensive, less invasive, easier to perform, and has the largest patient data base indicating the presence of different subtypes of attention and learning disorders that maybe differentially amenable to various treatment approaches. Further, with the emergence of EEG biofeedback treatment techniques, a direct application of QEEG for determining QEEG biofeedback treatment parameters may be possible.