Deception is a common human practice and is not always pathologic or self-serving. People often mislead others to gain an advantage or to protect themselves or others. Since there are multiple forms of deception, we restricted the definition for this paper to “the purposeful misleading of another.” In addition, deception is a prominent feature of a number of medical conditions, including antisocial personality disorder, malingering, factitious disorders, and addiction disorders.
1 A better understanding of the brain regions involved in deception might help understand the brain basis of these neuropsychiatric disorders.
Because of the prevalence of deception, there are many legal, political, and industrial settings where society could benefit from its accurate detection. Since antiquity, people have sought to accurately detect deception.
2 The development of equipment to measure psychophysiologic functions enabled investigators in the late 19
th century to study the peripheral physiologic changes that were associated with deception. This led to the development of more sophisticated peripheral measuring techniques and data analysis, including the polygraph.
3The present day polygraph records electrodermal skin conductance, blood pressure changes, respiration, and peripheral vasomotor activity. Although there are a number of different testing techniques that use the polygraph, they all examine the autonomic response to relevant versus irrelevant questions. A greater autonomic response to the relevant questions versus the irrelevant or control questions is interpreted as an attempt to deceive.
2 In recent years, the polygraph has been used extensively to evaluate deception. The polygraph, however, has several significant limitations, including the ability of persons being tested to develop countermeasures.
4,5 Another fundamental problem with the polygraph is that it measures non-specific peripheral changes in arousal and not deception itself.
6 The predictive value of the polygraph has been found to be poor in many screening and investigative situations,
7 and the scientific evidence regarding the polygraph's validity is significantly lacking.
8 Further, there is a dearth of knowledge regarding the neurobiologic basis of the polygraph. Interestingly, despite its unproven ability, the polygraph continues to be used in job screening and criminal investigations.
Some other techniques have been investigated to predict deception—all of which use peripheral measures. These include measuring pupillary size response to visual stimuli that are mock crime scene related,
9 using voice analysis, facial and hand movement cues to identify subjects who are lying or being truthful,
10 observing verbal cues to detect a true life tale versus a fabricated one,
11 attempting to detect deception in and out of hypnosis,
12 and using high-definition thermal imaging techniques to detect periorbital changes in people trying to deceive.
13 One of the few methods to measure actual brain activity to detect deception involves examining the amplitude of the P300 component of event-related brain potentials.
14 Even if it proves effective, however, this technique has limited utility since it is only applicable when attempting to detect guilty knowledge. These various techniques have been employed with variable success in several types of deception. Better methods directly measuring brain activity are needed.
Over the past decade, researchers using functional MRI and positron emission tomography (PET) have successfully delineated the brain changes involved in response inhibition (Go/No-Go),
15 divided attention (the Stroop Task),
16,17,18 anxiety,
19,20 emotion-related learning with reward and punishment,
21 and differentiating components of cognitive control such as performance monitoring.
22 Although these cognitive and emotional processes may or may not be involved with deception, these studies do provide a reasonable expectation that functional MRI in its current use is sensitive enough to detect brain changes involved with deception. In addition, our lab and others
23 have recently developed the expertise to acquire electrodermal activity (an important component of polygraphs) during functional magnetic resonance imaging (fMRI) scanning.
24To our knowledge, no neuroimaging studies to detect deception had appeared in the literature when we began this work. Several related studies, however, have occurred since the publication of our initial abstract.
25,26,27 Spence et al. used questions regarding recent memories and found that incorrect (deceptive) answers resulted in significant activation of the bilateral ventrolateral prefrontal cortices.
25 Another group using playing cards and a guilty knowledge paradigm found significant activation in the anterior cingulate cortex, superior frontal gyrus, and left motor, premotor and anterior parietal cortex.
26 A third group used pairs of subjects with one of the subjects periodically giving deceptive information to his/her partner while being scanned. During the deceptive time periods, they found increased activity in the bilateral lateral prefrontal and premotor cortices, the left parietal cortex and bilateral precuneus.
27 The diversity in paradigms makes any conclusions very difficult. None of these studies, however, have employed the combination of measures used in this study: blood oxygen level dependent (BOLD), fMRI and electrodermal activity (EDA). We began this work with the idea that with a better understanding of the neural circuitry involved during deception; more accurate detection of deception might be achieved. Functional brain imaging has the potential to identify brain regions specific to deception and not just measure arousal. In addition, identifying specific brain abnormalities present in psychiatric disorders in which deception is prominent may result in better evaluations and more effective treatments for these disorders.
Since we did not have any prior studies on which to base our predictions, we chose cognitive and emotional processes that we thought might be involved with deception. Using BOLD fMRI, we tested whether brain regions activated during response inhibition (related to the orbitofrontal cortex (OFCx),
15 divided attention (involving the anterior cingulate (AC),
16,17,18 and anxiety (involving the amygdala)
19 were activated during an act of deception. We investigated the brain changes initially as a group and then for individuals. In order to investigate the correlates of brain activation and psycho-physiologic parameters during deception, we investigated the relationship between EDA (a primary component in polygraph) and BOLD-fMRI signal changes. We hypothesized that the same brain regions activated during deception (OFCx, AC, amygdala) would also correlate with EDA changes.
Methods
Subjects
Ten healthy adults (8 men, 2 women) were recruited and consented for the study, which was approved by the Medical University of South Carolina Investigational Review Board. One woman we scanned had a variation in her exposure paradigm. Thus, we chose not to include the other woman and restrict our analysis to a single gender. Subjects were required to be 18 to 40 years old and right-handed and score at least 9 out of 12 on the Annett Handedness Rating Scale.
28 They also had to be able to read and write English and possess the capacity to provide informed consent. Potential subjects were excluded if they had a history of any current or past Axis I Psychiatric Disorder (except simple phobia), including substance abuse/dependence as determined by the Structured Clinical Interview for DSM-IV Axis I Disorders (SCID-I), a history of neurologic disease, a currently unstable medical condition, any psychotropic medication taken within 5 half-lives of procedure time, caffeinism, nicotine use, any metal implants (not including dental fillings) making an MRI unsafe, irremovable medical devices such as pacemakers or fixed hearing aids, presence of shrapnel, previous inability to tolerate MRI procedure, or claustrophobia severe enough to induce substantial anxiety in closed spaces.
Procedure
After written consent was obtained, subjects were evaluated with SCID and Annett Handedness scales.
28 The subjects underwent a physical exam and review of current and past medical history.
On a subsequent visit, the subjects were escorted to two rooms: one was referred to as the truth room and the other the deception room. The order was randomized with one-half of the subjects going to the truth room first and the other half going to the deception room first. Within each room, subjects were instructed to find under which of five objects a fifty-dollar bill was hidden. They were to remember the location of the money and leave it in place. The subjects were then placed in the MRI scanner with goggles to view pictures of objects in the truth and deception rooms. Electrodermal electrodes were attached to the left hand, and the data (sampling rate 100 per second) were recorded using LabView 5.0.1 on a G4 Macintosh (For details see Shastri, 2001).
The images were acquired using a Picker Edge 1.5T MRI scanner equipped with an actively shielded magnet and high performance whole-body gradients (27 mT/m, 72 T/m-sec). A 15-slice TE20 structural scan was obtained to evaluate structural pathology. The BOLD fMRI consisted of 15 coplanar axial slices covering the entire brain and positioned parallel to the anterior commissure-posterior commissure line using a sagittal scout image. Each fMRI volume consisted of BOLD weighted axial scans and used an asymmetric-spin gradient echo, echo-planar (EPI) fMRI sequence (tip angle=90° TE 45.0 ms; TR 3000 ms; fifteen 8 mm thick / 0 mm gap axial slices; FOV 300 × 300 mm; in-plane resolution 2.109 × 2.109 mm; through-plane resolution 8 mm; frequency selective fat suppression). Given these parameters, for the fMRI, a set of fifteen 8 mm thick / 0 mm gap axial slices covering the entire brain was obtained every 3 seconds.
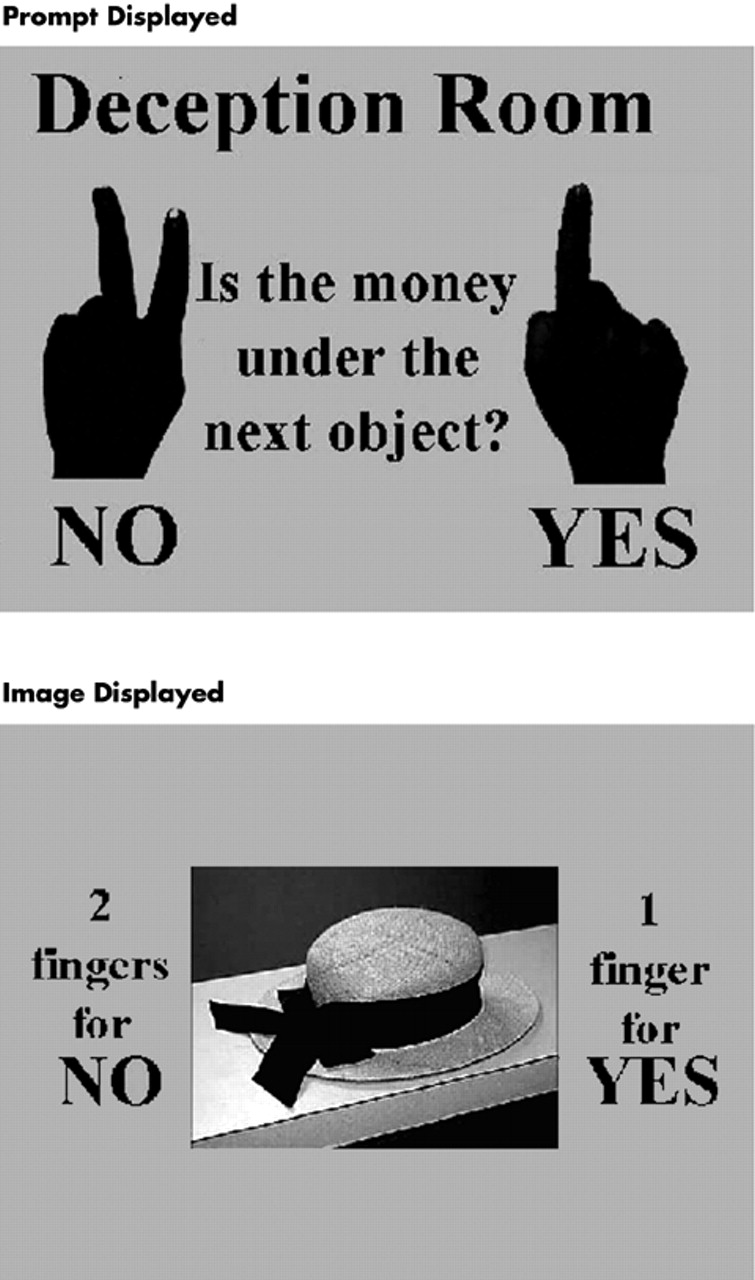
While the BOLD fMRI scans were being acquired, a modified Control Question Test paradigm was utilized and required subjects to give both truthful and deceitful answers about the location of the money. Through video goggles connected to a computer, the subjects were shown prompt screens and then pictures of the objects in the rooms where the money had been hidden (
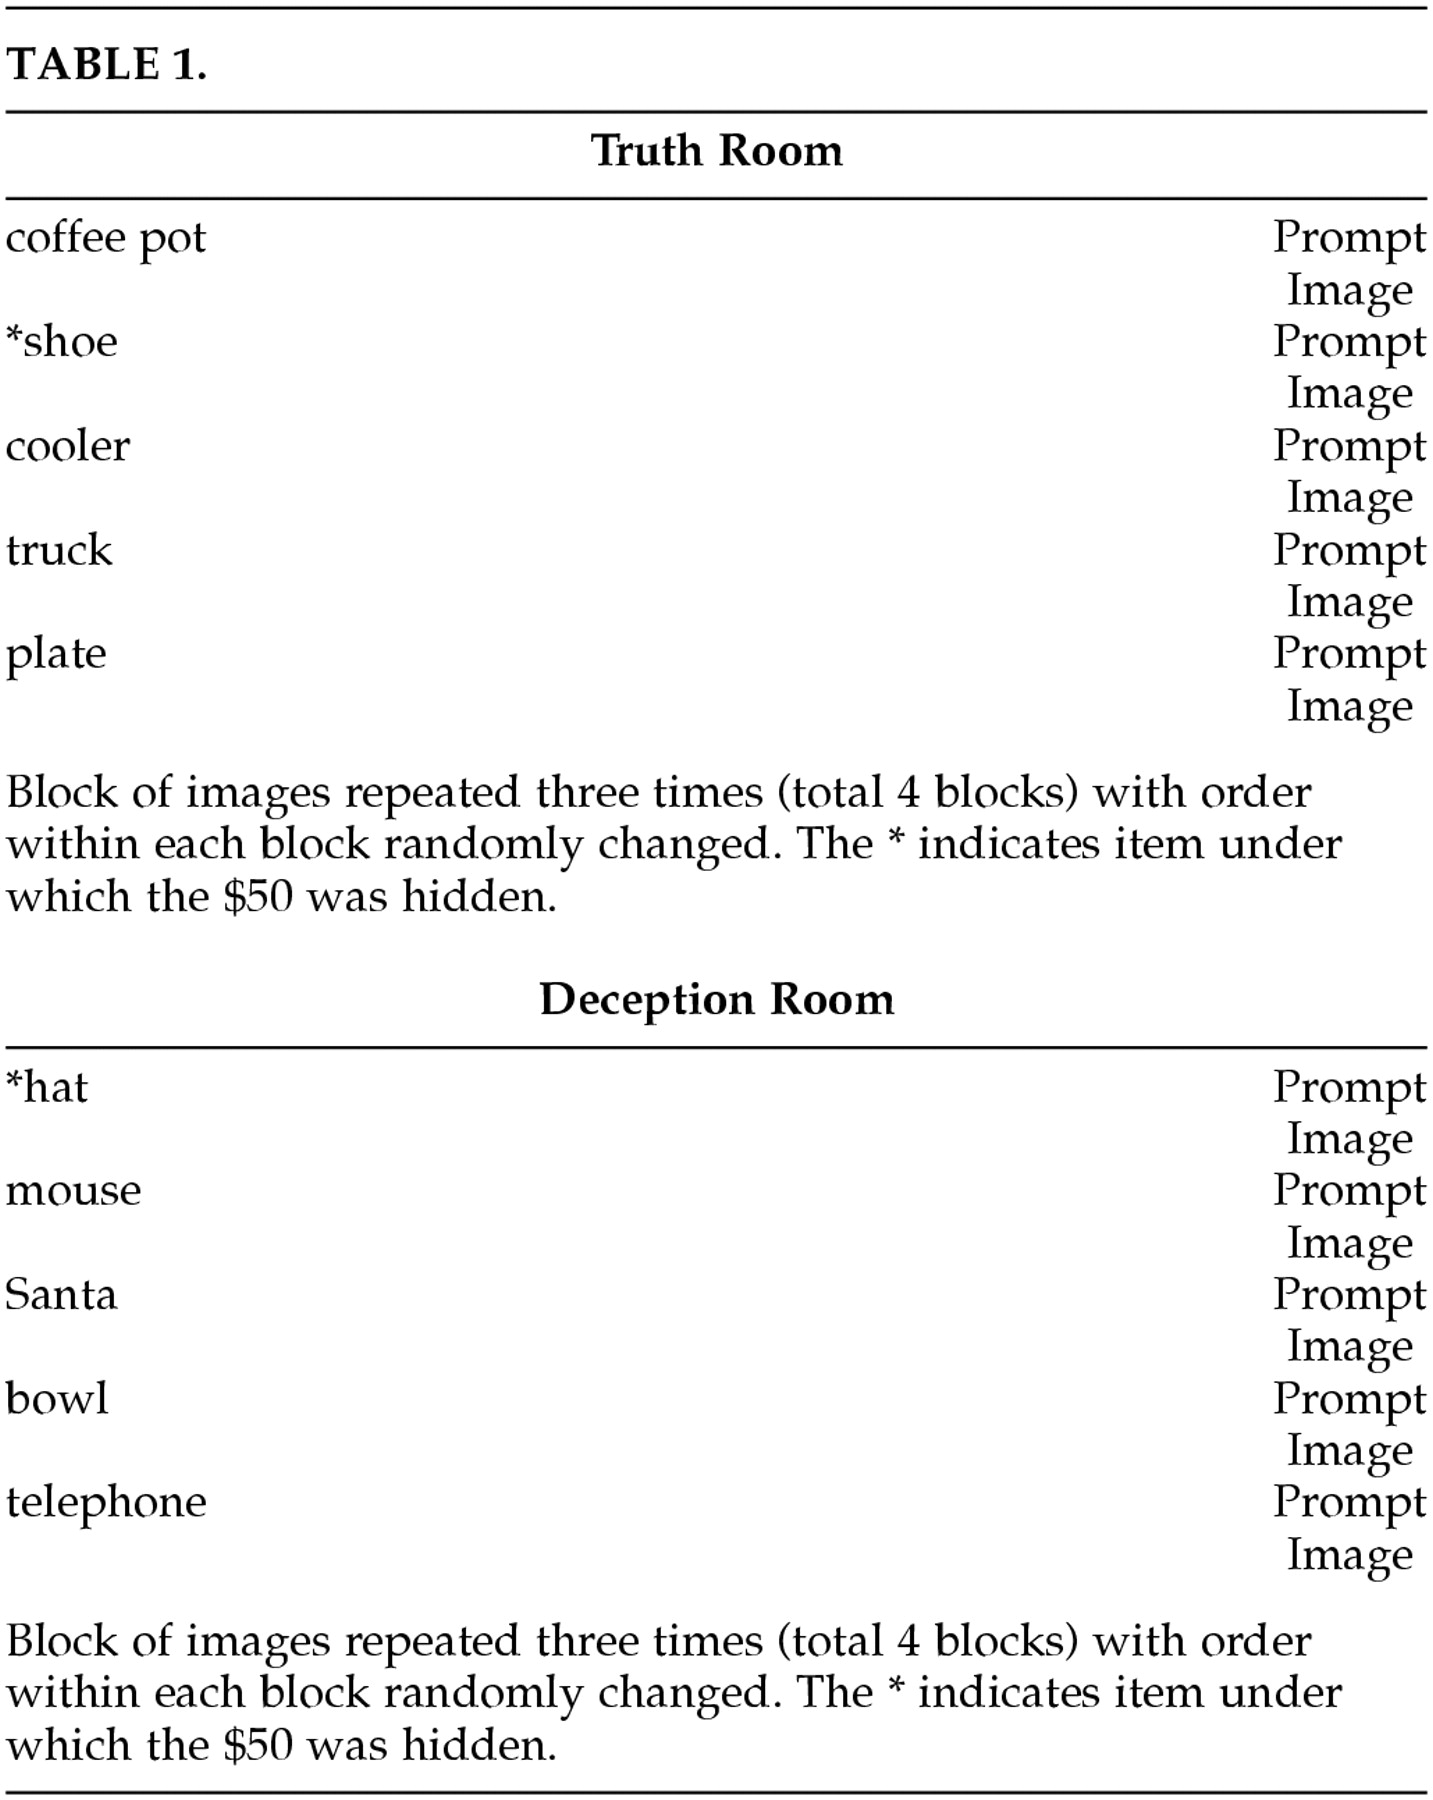
Figure 1). If the subjects first looked in the truth room, then they were shown only the truth room objects first and then the deception room objects and vice versa if subjects were first shown the deception room. There were five objects in each room (ten unique objects in all), and the objects were each shown one time in a block for a total of four blocks per room. (
Table 1) The order of the objects was randomized within each block. Before the picture of the first object and between the pictures of every object in the room, a prompt screen was displayed that reminded the subjects of the instructions. The object and the prompt were each displayed for 10.2 seconds. Subjects were instructed to raise either one (yes) or two (no) fingers to answer the question of whether the money was hidden under an object as soon as the object was visually displayed in the goggles. This was monitored and recorded by an observer (LR).
For the truth room, subjects were instructed to accurately report the location of the money by holding up the right index finger (one finger) when they were shown an object under which the money had been hidden. This would be the “control” with which the deceptive answers would be compared. This controls for the potential confounds of brain changes associated with simply seeing an object that had money under it. They were instructed to raise the right index and middle finger (two fingers) when shown an object under which the money was not hidden.
For the deception room, they were instructed to choose an object that did not have money hidden under it and respond affirmatively (right index finger), in effect creating a positive lie about the money location. They were also asked to respond negatively (right index and middle finger) to all other objects shown. They were thus consistently lying when the object with money hidden under it was shown (a hat). The money was hidden under the same object for all subjects. Subjects were told that a blinded investigator (to order of rooms visited and location of the money) would attempt to determine when they were lying by observing their behavior in the scanner through the control room window. If the subjects accurately reported the position of the money in the truth room, then they would receive 50 dollars. If the subjects “successfully” lied without being detected for the deception room, then they would receive an additional 50 dollars. In fact, all subjects were paid the full 100 dollars. This instruction was included in order to increase the motivation and the anxiety during deception.
Functional MRI Analysis
The data were analyzed with MEDx 3.3/SPM96 on Sun workstations using the Talairach and Tournoux brain template throughout. Initially, the MEDx motion detection function was performed using the center of intensity weighting method. Any motion greater than 2.0 mm from reference volume would have been corrected using the MEDx 3.3 motion correction function (no subjects required motion correction, largest movement range 0.4 to −1.7 mm). Next, individual volumes were spatially normalized into Talairach space utilizing the SPM Module 96 in MEDx 3.3. Algorithm parameters included basic functions and smoothing x=4, y=5, z=1, iteration=2, smoothing=8.0, deformation=0.2, the SPM template corresponding to the original Talairach and Tournoux atlas
29 and output voxel size 4×4×4 mm. Using the SPM module again, spatial smoothing was performed using 8×8×8 mm gaussian kernel. Intensity normalization was performed which first created a with-in-the-brain mask that only included voxels if they had intensity greater than 35% the maximum of each image volume for all time points. The remaining nonzero voxels in each volume were then scaled in the time series to a mean value of 1,000. We then performed high pass temporal filtering which filtered out patterns greater than twice the cycle length of 204 seconds. Due to the SPM module performing another intensity mask during the upcoming SPM statistics step, a .tcl script was written to add 100 to all voxels outside the brain. When the SPM statistics was run, this ensured that no voxels we previously defined as within brain would be eliminated from the analysis but that voxels we previously defined as outside the brain would be eliminated.
Using the SPM module on MEDx 3.3, statistical analysis with a delayed boxcar design without temporal filtering was performed. The epochs were grouped as Lie (the time period when individuals gave a false answer—both indicating that the object did not conceal money when it did {4 epochs} and indicating the object concealed money when it did not {4 epochs}), Lprompt (time period prompt image displayed just prior to each Lie {8 epochs}), True1 (time period subjects answered truthfully the location of the money {4 epochs} and 4 truthful answers that the money was not under an object—temporally surrounding deceptive answers {4 epochs}), Prompt1 (time period prompt displayed immediately preceding True1 epochs), True (time period of all remaining truthful answers {24 epochs}), and Prompt (time period of prompt immediately preceding true epochs {24}). Using these epochs, Lie minus True1 and True1 minus Lie was computed with no threshold (p=0.05 and uncorrected k (cluster size) = 1). The individual unthresholded images were used to obtain group and individual activation profiles.
To calculate a group result, for all individuals, the image calculator in MEDx 3.3 was used to compute unthresholded Lie minus True1 z-maps containing both positive and negative z-scores. Thus, we used the image calculator to obtain the result of (Lie minus True1) minus (True1 minus Lie) z-maps for each subject. Once this was obtained for all individuals, they were summed and then divided by the square root of eight to create the group fixed effects analysis unthresholded z-map. The resulting image was then analyzed with MEDx 3.3 cluster detection with a minimum of z=1.645 and spatial extent threshold of 0.05. A low statistical threshold was chosen since our paradigm could only have a limited number of epochs of Lie. In addition, although we were directly testing our hypothesized regions, we were interested in analyzing the whole brain since we had no previous neuroimaging studies to focus our analysis. The resulting values were used to determine local maxima and visually present the significant clusters. The Talairach Daemon interface in MEDx 3.3 was used to identify locations of the local maxima.
30 In addition, the Talairach atlas
29 was used to confirm the location of the significant clusters. The Johns Hopkins University BRAID imaging database at http://braid.rad.jhu.edu/ index atlases.html determined the Damasio Talairach space definition of orbitofrontal cortex.
For the individual analysis, in a similar fashion to the group analysis, the unthresholded images of True1 minus Lie were subtracted from Lie minus True1. The resulting image was analyzed using MEDx 3.3 cluster detection with a minimum of z=1.645 and extent threshold of 0.05. The resulting values were used to determine local maxima and generate a visual representation of those significant clusters. The Talairach Daemon interface was used to identify location of the local maxima.
30 This was performed for each individual. In addition, the Talairach atlas
29 was used to confirm the location of the significant clusters.
Electrodermal Activity (EDA) Analysis
The EDA data was converted to a text file by AS and AS. In order to correlate EDA with the functional BOLD signal, MEDx 3.3 analysis package requires an equal number of volumes and EDA data points. The EDA data corresponding to each volume (TR = 3 seconds) was therefore averaged using STATA. Thus, every sequential 300 EDA data points (sampling rate was 100 per second) were averaged to give 272 means that corresponded to the functional brain volumes to be compared. The volumes utilized were the ones that had been motion detected, spatially normalized, smoothed, intensity normalized, and temporally filtered (see above for details). Using MEDx 3.3, independent of the deception paradigm, the changes in EDA were correlated with BOLD fMRI changes using a Pearson's r correlation. This analysis was performed for each individual resulting in a z-map. One of the correlation z-maps was found to have a significant artifact and was not included in the individual or group analysis.
For the group analysis, the remaining seven individual z-maps were added using the MEDx 3.3 calculator and divided by the square root of seven. The resulting image was then analyzed with MEDx 3.3 cluster detection with a minimum of z=1.960 and spatial extent threshold of 0.05. In the direct BOLD comparison above (Lie minus True1), we were only able to use eight epochs. This study is thus underpowered relative to many in the field. For the correlational analysis, we were able to use all time points, and we were justified in using a larger z value threshold. The resulting values were used to determine local maxima and visually present the significant clusters. The Talairach Daemon interface in MEDx 3.3 was used to identify locations of the local maxima.
30 In addition, the Talairach atlas
29 was used to confirm the location of the significant clusters and the Johns Hopkins University BRAID imaging database for Damasio Talairach space definition of orbitofrontal cortex.
For the individual analysis, the individual correlation z-maps were each analyzed using MEDx 3.3 cluster detection with a minimum of z=1.960 and extent threshold of 0.05. The resulting values were used to determine local maxima and generate a visual representation of those significant clusters. The locations of the significant clusters were determined using the same technique as the group analysis.
Results
Subjects
Subjects consisted of eight healthy right-handed men (mean age 25 years with a range of 21-28) with no significant history of psychiatric or medical conditions. Average Annett Handedness score for right handedness was 11, with a range of 9 to 12. All subjects responded correctly in the deception room and correctly and truthfully in the truth room. Consistency of response was monitored, and all subjects reported that the same object for each block hid the money when it did not, although the objects chosen for this positive lie varied.
We generated group image maps to test our hypotheses regarding the functional neuroanatomy involved in deception. We then generated within-individual statistical maps to test for individual heterogeneity and the predictive capacity of imaging to detect deception.
Lie minus True1 is the subtraction that best isolates the act of deception by controlling for the most confounds. Our prestudy hypothesis was that the OFCx, AC, and the amygdala would show increased activation during this comparison. This comparison confirmed our hypothesis regarding the OFCx and AC, but failed to find amygdala activation. The other nonhypothesized regions (superior temporal gyrus, cerebellum, frontal gyrus), which met statistical significance, should be considered exploratory, as they were not hypothesized prior to the study
Individual Analyses for Lie minus True1
We next sought to examine the heterogeneity among our subjects in brain activation during the deception task. We examined each individual to determine whether they had significant activation in any of these regions during the deception minus true comparison. Using a minimum statistical threshold of z=1.645 and extent threshold of 0.05, one subject had no significant activation, while seven showed diverse activation patterns. No one brain region was found activated for all subjects when true epochs were subtracted from lie epochs. The mean number of discrete regions identified by the group analysis that were activated by individuals was 2 per individual subject with a range of 0 to 6.
Group Analysis Correlating EDA Changes and BOLD-fMRI Changes
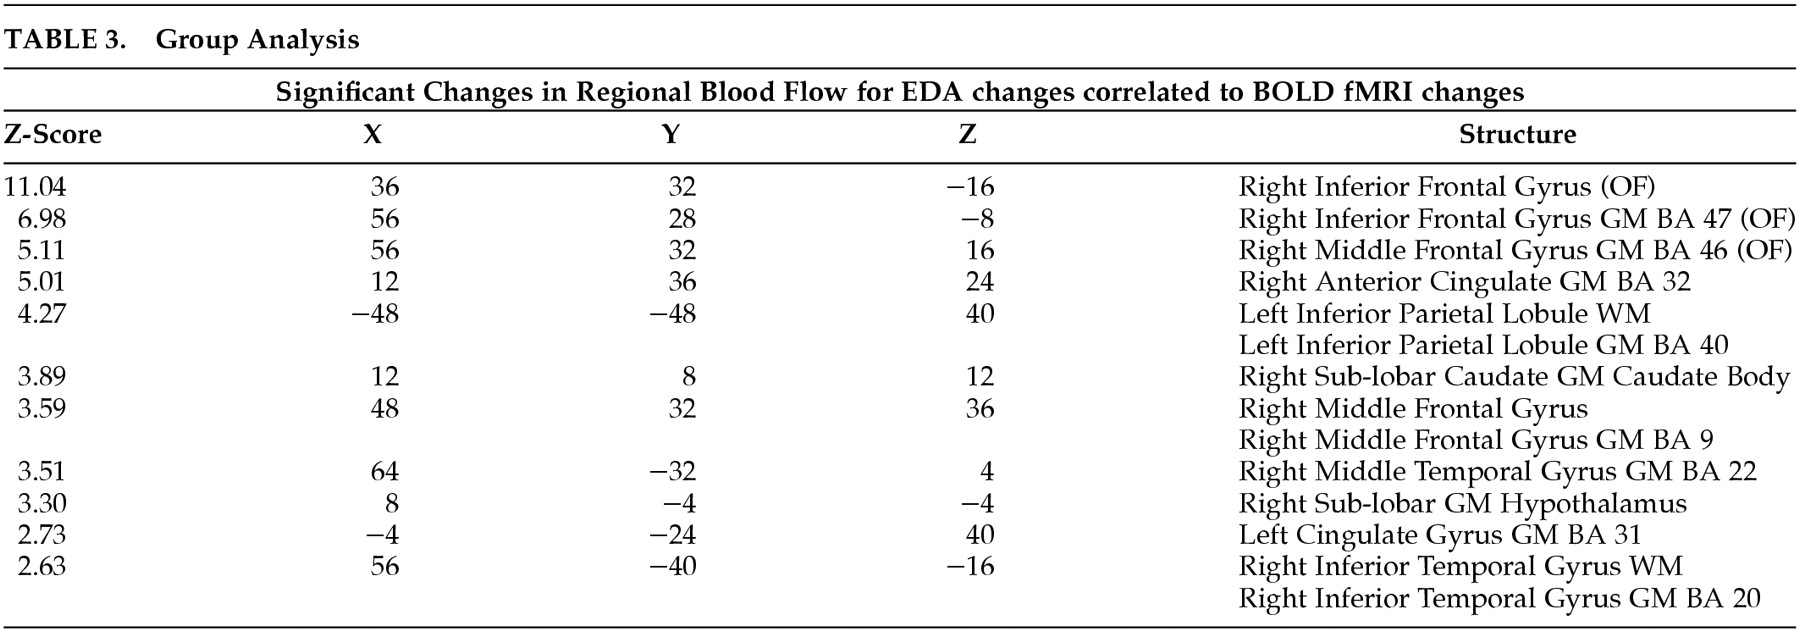
For the group analysis, one of the subjects had significant artifact after the correlational analysis and was not included in the group analysis (
Table 3 and
Figure 3). Significant activation was found in the orbitofrontal and right anterior cingulate gyrus.
Thus, our prestudy hypothesis concerning the link between EDA changes during deception and OFCx and AC was supported, but again we failed to find amygdala activation. The other areas of activation that were not hypothesized can only be considered exploratory.
Individual Analysis Correlating EDA and BOLD-fMRI Changes
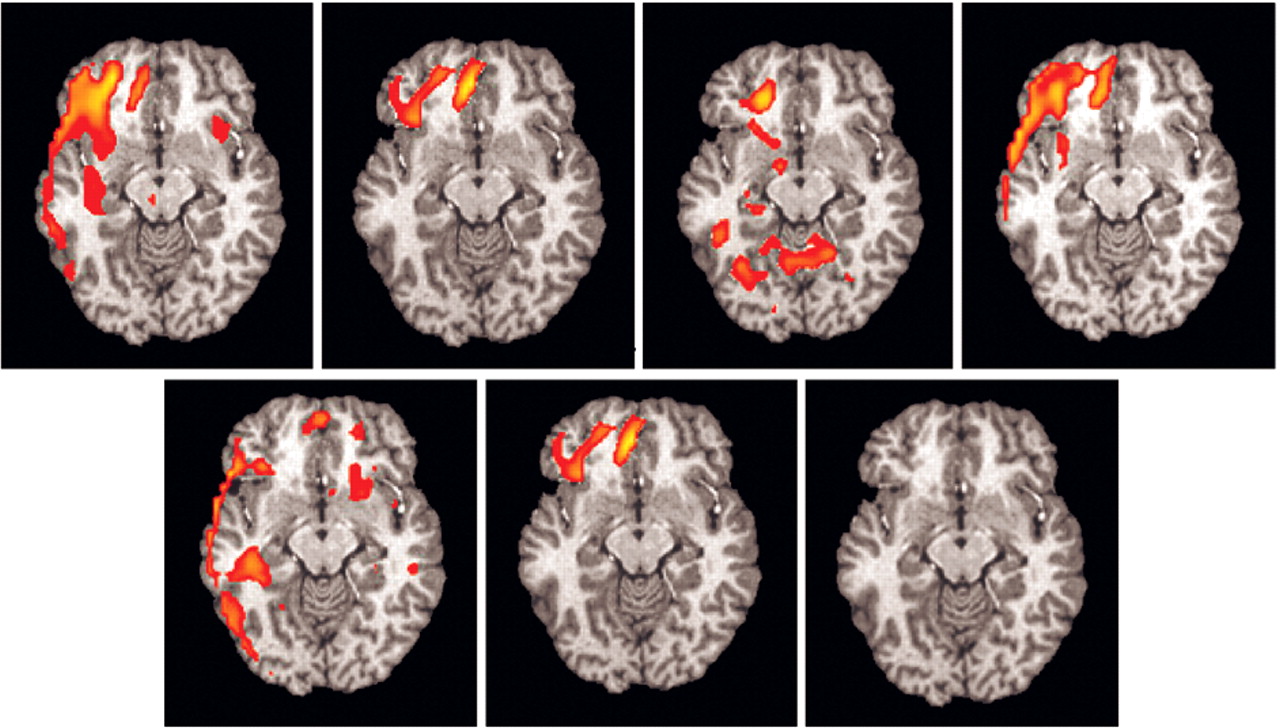
Of the seven subjects (one subject with significant artifact), six had significant (z >1.960 and extent threshold < 0.05) right orbitofrontal activation (
Figure 4), and five had significant (z >1.960 and extent threshold < 0.05) right anterior cingulate activation. No other regions consistently activated across individuals.
Discussion
The primary purpose of this pilot study was to determine on a group basis if brain regions previously implicated in response inhibition, divided attention, and anxiety would activate more during attempted deception than during a well-constructed truth-telling control condition. We hypothesized that during deception there would be increased activation in the orbitofrontal cortex (OFCx)(response inhibition), anterior cingulate (AC) (divided attention) and amygdala (anxiety). Confirming our hypothesis, our group analysis found significant activation in two of these three areas: the orbitofrontal (right middle frontal) cortex and the anterior cingulate gyrus. We failed to find significant amygdala activation on group analysis. One possible explanation for failing to find amygdala activation is that our paradigm did not include a visual threat component. Another possible explanation is that our MRI scanning parameters may not have been adequate to detect activation in ventromedial regions of the brain such as the amygdala.
An important question is whether the regions with significant activation are unique to deception or does deception simply require a greater degree of activation in these areas compared to truthful answers. A recent study using event-related potentials to investigate brain changes during feigned malingering of memory deficits suggests that malingering and thus possibly deception requires more complex activity.
31 Future studies are needed to clarify this issue.
We then analyzed the fMRI data on a within-individual basis. Within subject BOLD fMRI, analysis of Lie minus True1 generated large variations in the areas of significant differences in blood flow across the group. One explanation for this lack of consistency across individuals is the limited number of epochs that could be classified as deception. There were only eight epochs where the subjects attempted to deceive. Recent work in our lab and in the fMRI neuroimaging literature has suggested that increasing the number of epochs can significantly improve the signal to noise ratio within an individual. These data would suggest that fMRI within individuals as presently applied is neither sensitive nor specific for detecting deception. Further refinements, however, in the scanning and stimulus presentation paradigm that includes a greater number of epochs of deception, might increase the individual sensitivity and specificity. For example, initial fMRI studies of motor
32 and language areas
33 were only able to report group analysis results. With time and refinement, fMRI is now used pre-surgically (which requires good individual predictive ability) to aid in surgical guidance.
34The group analysis result correlating changes in EDA and BOLD fMRI signal revealed significant correlations between EDA and brain activity in the same two regions (OFCx and AC) that were significantly activated in the Lie minus True1 group analysis. The importance of the OFCx for regulating EDA was recently demonstrated by van Honk et al.
35 who used Transcranial Magnetic Stimulation (TMS) over the OFCx at parameters that suppress cortical function. This TMS ‘temporary functional OFCx lesion’ significantly reduced electrodermal activity. In related work, Raine et al.
36 also found that persons with antisocial personality disorder have reduced prefrontal gray matter volume (which includes OFCx) and reduced autonomic activity. One explanation for these findings is that the orbitofrontal cortex may be important for generating autonomic arousal, as our current results suggest. A recent article, however, investigating the neural correlates of biofeedback relaxation using EDA by Critchley et al. only found an inverse correlation between EDA and BOLD-fMRI in multiple brain regions.
37 Since the subjects were actively responding to the EDA results, interpretation is difficult since any correlation of EDA level to the BOLD fMRI signal is confounded by the subjects response. Clearly more work is needed to clarify these issues.
For the individual correlational analysis of the EDA and regional brain activity during deception, six of the seven subjects (not including one with significant artifact) had a significant within individual correlation with right OFCx changes. These data are perhaps the first brain imaging results on an individual level to delineate the central neurobiological basis of the polygraph. Future work in this area might provide a better understanding of the brain basis of the polygraph. Moreover, combining fMRI as outlined in this paper, or with modifications, with the polygraph offers the potential for increasing the sensitivity and specificity of a combined fMRI/polygraph machine. Further work is needed to determine if combining these two modalities, with refinements in the fMRI paradigm, can realize this goal of better within individual detection of deception.
This initial pilot study has several limitations, including a small sample size and low statistical power of the number of scanning epochs for the core comparison of deception compared to truth telling. Because there have been no previous imaging studies of deception, we imaged the entire brain and chose a liberal level of statistical significance to test our primary hypotheses about regional brain activation (a level of significance that was more sensitive than specific for our hypothesized regions of OFCx, AC and amygdala). Further studies with larger numbers of subjects that include both sexes are clearly needed to confirm these findings. In addition, future studies should have a greater number of epochs of deception in order to increase the power for the individual analysis. Finally, the analysis should include a motion correction on all of the subjects regardless of degree of movement and a more stringent threshold for significance.
Additionally, the perceived punishment for not successfully deceiving the examiners was relatively minimal. The possibility of not receiving 50 dollars is not nearly as severe as going to jail or experiencing other harsh punishment. The difference in consequence and how consequence impacts imaging results will need to be explored before a reliable method of accurately detecting lies in high stakes settings can be established.
Despite these problems, this proof-of-concept study suggests that using BOLD fMRI, either alone or combined with EDA measures, to investigate brain changes associated with
TABLE 1.deception is both possible and potentially of value. This study demonstrates the important role of the OFCx and AC in producing the changes used in the polygraph. Future research using different paradigms and/or scanning parameters may enable better understanding and detection of deception.
ACKNOWLEDGMENTS
This study supported in part by the Medical University of South Carolina Institutional Research Funds 2000–2001 and a grant from the MUSC Center for Advanced Imaging Research. LJR was supported by a Summer Medical Student Research Grant to MUSC. The authors thank Drs. Raymond Anton, James Ballenger, and Judy Dubno for their review of the manuscript and Dr. Ramon A. Durazo Arvizu for his help with STATA.
Abstract of Deception and fMRI - presented at the American Neuropsychiatric Association Annual Meeting Feb. 2001, Sanibel Florida and the American College of Neuropsychopharmacology (ACNP) Annual Meeting, December 2000, San Juan, Puerto Rico.
Abstract of Correlation of EDA and BOLD fMRI Signal - presented at the Society of Biological Psychiatry Annual Meeting, May 2002, Philadelphia, PA. NR #255.
