T he clinical diagnosis of Huntington’s disease is still based on the first appearance of motor signs accompanied by a positive family history and the confirmation that the individual carries the CAG repeat expansion in the Huntington’s disease gene. Motor disturbances are, however, variable in presentation and occurrence, and it has been reported that subtle neurological changes have been missed during routine neurological examinations or that these are nonspecific for the determination of Huntington’s disease onset.
1,
2 Furthermore, patients and families often retrospectively report the subtle appearance of cognitive impairment and personality changes as heralding disease onset.
3,
4 Since predictive testing has become available, the possibility of following “presymptomatic” carriers (i.e., individuals without manifest motor signs) prospectively yields the difficulty of defining presymptomatic and symptomatic status. Cross-sectional studies on cognitive performances in presymptomatic carriers have produced inconsistent results.
5,
6 Most longitudinal studies suggest that subtle cognitive changes precede motor signs by a number of years,
7 –
9 but this is not a uniform finding.
10,
11 The limited number of longitudinal studies that focus on behavioral changes indicate increased irritability, cynical hostility,
12 and aggressive behavior
13 in carriers prior to manifest onset.
Ten years after the start of DNA-testing, prospective research remains essential, because greater knowledge allows a more accurate interpretation of the first subtle manifestation of disease. As new effective pharmacotherapeutic strategies are expected to be developed, it becomes even more important to find clinical markers for Huntington’s disease to be used as outcome measures in therapeutic trial designs.
We embarked on a longitudinal prospective study in a large group of individuals (N=134) to assess the clinical characteristics of Huntington’s disease. We wanted to evaluate whether the results of assessing motor, cognitive, and psychiatric domains in carriers would worsen over time, while noncarriers remained stable. We chose a study duration of 3 years, a commonly defined period for therapeutic trials.
METHOD
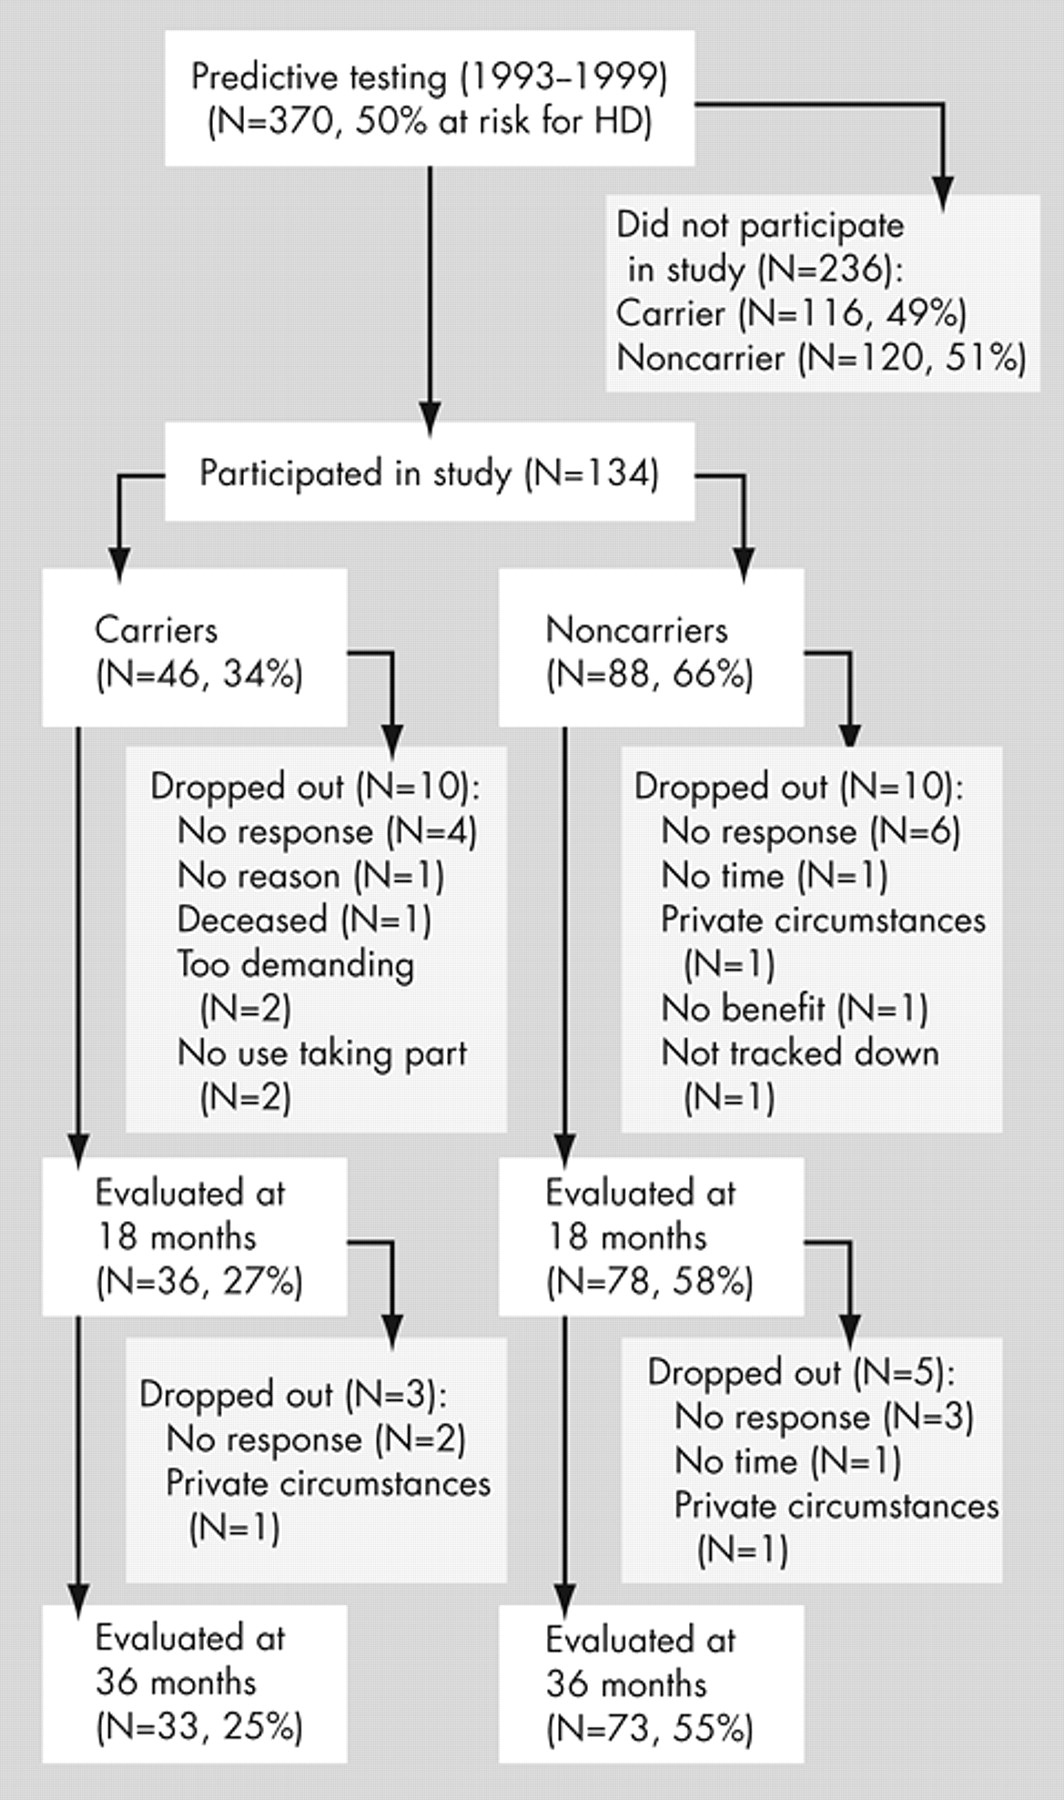
Between 1993 and 1999, 370 individuals who had a 50% risk of developing Huntington’s disease were referred to the Leiden University Medical Center (LUMC), Department of Clinical Genetics, for predictive testing (
Figure 1 ). Testing was performed according to the guidelines of the International Huntington Association and the World Federation of Neurology Research Group on Huntington’s disease.
14 Individuals with a CAG-repeat expansion exceeding 35 copies were determined to be “carriers” of Huntington’s disease; participants who carried an allele with fewer than 27 copies were considered to be “noncarriers.” Individuals with a repeat number between 27 and 35 (intermediate result) were included in the noncarrier group.
6,
15In this single-blind study, 134 participants were initially included (
Figure 1 ). The percentage of carriers who participated was lower than the percentage of carriers who did not enter the study.
6 Eighteen months after baseline, 114 participants (85%) returned for the first follow-up. One hundred six participants (72% of the carriers and 83% of the noncarriers of the original group) attended the second follow-up. The final 106 participants belonged to 71 pedigrees; 48 of these pedigrees contained one person, 15 contained two, five contained three, two contained four, and one contained seven individuals. The study was approved by the LUMC medical ethics committee, and all participants gave their informed consent.
Protocols
Using the Unified Huntington’s Disease Rating Scale (UHDRS)
16 and an extensive set of tests covering cognitive functioning,
6 participants were assessed by a neurologist (R.A.C.R./J.P.P.vV.) and a psychologist (M.N.W.W.A.), both blind to genetic status. The investigators were not involved in the genetic counseling of the participants. The neuropsychological battery included the following tests: Mini-Mental State Examination (MMSE), WAIS-Revised (WAIS-R), Block Span, Digit Span, Wechsler Memory Scale (WMS), Word List learning for Visual presentation (WLV), the Dutch version of the California Verbal Learning Test, “Verbale Leer en Geheugen Test” (VLGT), faces recognition from the Rivermead Behavioral Memory Test (RBMT), Benton Visual Retention Test (BVRT), Boston Naming Test (BNT), language comprehension and production (oral and written), arithmetic, visuo-constructive tasks (copying perspective and geometrical figures and drawing a map of the participant’s house), Wisconsin Card Sorting Test (WCST), Trail-Making Test (TMT) Parts A and B, Symbol Digit Modalities Test (SDMT), Stroop Color Word Test and Verbal Fluency (letters FAS). The last three tests belong to the UHDRS cognitive assessment. Reaction time measures were used to assess speed of movement initiation (decision time) and movement execution (motor time), both derived from a simple reaction time paradigm and a “choice” reaction time paradigm (go/no go paradigm; four conditions: single light, single sound, choice light/light, and choice light/sound). Neuropsychological assessment on the second occasion consisted of a shortened version of the baseline protocol, excluding the WAIS-R and the WMS and VLGT memory tests for reasons of compliance and learning effect. The third assessment consisted of the same battery of tests as at baseline. Parallel versions were available for the following tests: Digit Span, VLGT, WLV, faces recognition, BVRT, BNT (only for second assessment), SDMT, and TMT.
Statistical Analysis
A Total Motor Score (TMS) was calculated by summing all items of the motor assessment of the UHDRS, lower scores being indicative of better performance.
16 Analysis of subscales was restricted to eye movement, voluntary movement, and chorea, based on findings from the literature
17 –
20 and clinical practice. The scores of the behavioral part of the UHDRS were obtained by multiplying the frequency and severity for each item (sadness, low self-esteem/guilt, anxiety, suicidal thoughts, disruptive or aggressive behavior, irritable behavior, obsessions, compulsions, delusions, and hallucinations).
13 Adding these products resulted in a total behavioral score (TBS), lower scores being indicative of fewer complaints. In addition, we analyzed two subtests of interest: sadness and aggression. The apathy item was not available at the time of enrollment. Decision time and motor time scores were obtained by calculating the mean of all conditions.
For cross-sectional analysis, we used two-tailed students’ t tests, Pearson chi-square tests and Mann-Whitney U tests when appropriate in the SPSS, version 10.0. Longitudinal data were analyzed using the Laird-Ware random effects model.
21 The analysis was carried out in the statistical analysis package
S -Plus Professional version 6.0, using the Linear Mixed Effect procedure. The purpose of the longitudinal analysis was to estimate the mean evolution of scores in time from study entry, taking into account the age of patients at study entry. This approach has greater statistical power as it accounts for within-individual correlations across time, for missing data and varying interval length between assessments. The model included terms for age at study entry, gene status, time and the interactions between gene-status and time. The motor, cognitive, and behavioral scores were the dependent variables.
When the residuals were not normally distributed, a log-transformation was applied when possible. If this could not be performed, the Mann-Whitney U Test was used in SPSS 10.0 to compare within-group differences of carriers and noncarriers between the first and the third assessments. For these analyses, the UHDRS motor subscales, the UHDRS behavioral scores (total and subscales), the RBMT face recognition total score and the WCST number of categories were applied.
Because of the extended number of variables, we set the p level at 0.001 to report significance in findings, using the Bonferroni correction,
22 while p levels of 0.01 are reported to be of marginal interest.
RESULTS
Dropout of Carriers
The mean age of the carriers who dropped out (N=13; nine women) was 40.3 years (SD=12.8); the median number of CAG-repeats was 44 (41 to 51). The baseline UHDRS voluntary movement scores of these carriers were worse than those of the carriers who remained in the study (Mann-Whitney U=92.5, p=0.008), but demographic variables, the other parts of the UHDRS scales, the neuropsychological and the reaction time variables did not differ.
Dropout of Noncarriers
Noncarriers who dropped out (N=15; eight women) were significantly younger (32.9 years, SD=9.6) than those who completed the study (44.1 years, SD=10.9; t =−3.7, df=86, p=0.000); they also showed lower scores in baseline data reflecting intelligence and memory: WAIS-R verbal IQ (VIQ) (mean=96 [SD=7.2] and 103.7 [SD=10.2], respectively; t =−2.8, df=86, p=0.007) and WMS Memory Quotient (MQ) (mean=110 [SD=6.1], and 121.7 [SD=13.6], respectively; t =−>3.2, df=86, p=0.002).
Sociodemographic Aspects and Medication Intake at Follow-Up
The mean time interval between the first and second assessment was 18.3 (SD=0.82) months and between second and third assessment, 18.5 (SD=1.05) months. The last follow-up was performed a mean of 3.1 years after baseline (SD=0.008).
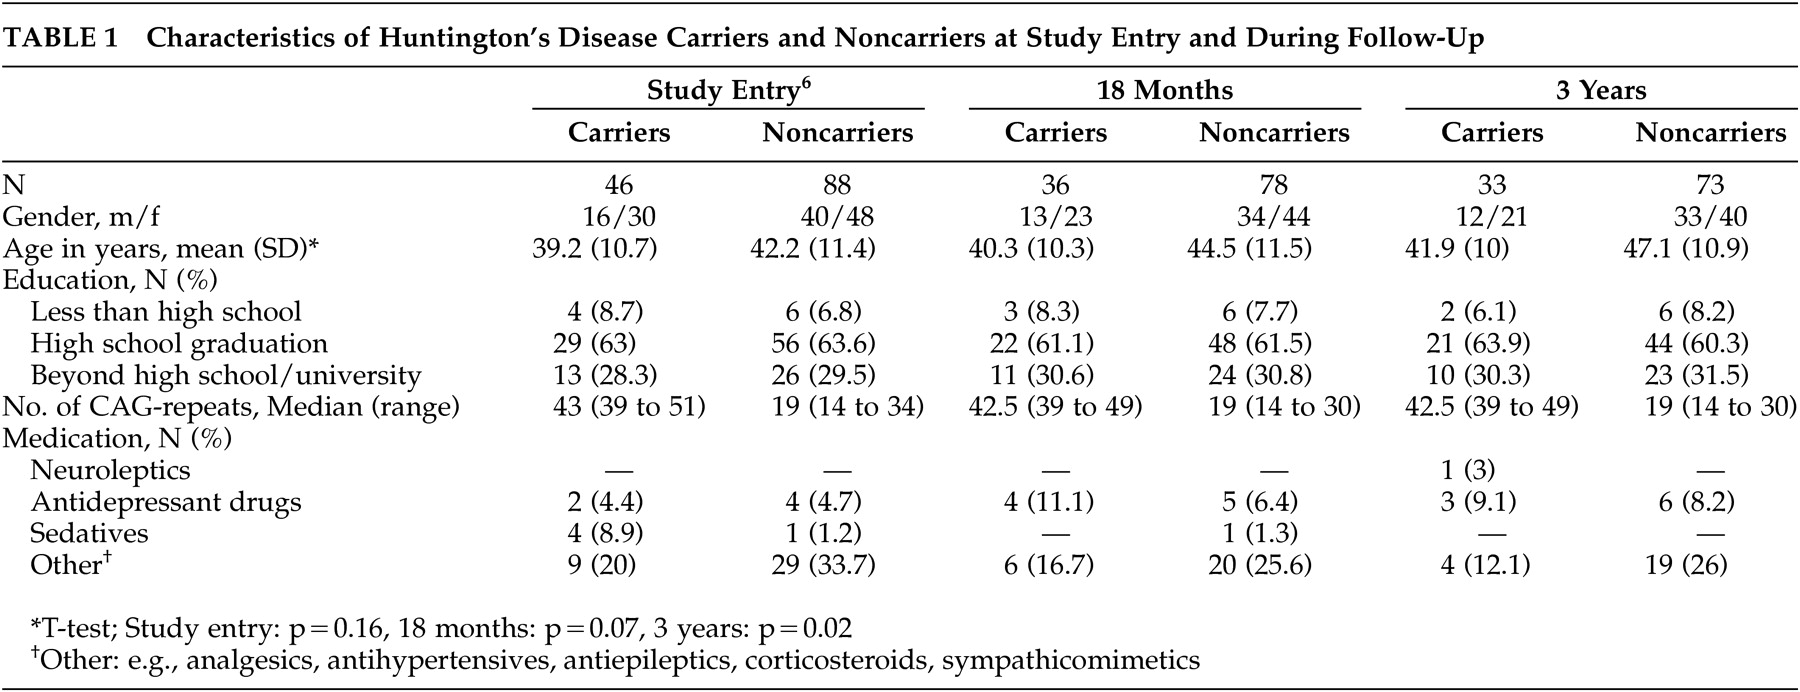
At the time of follow-up, the demographic characteristics of carriers did not differ significantly from those of noncarriers (
Table 1 ). The gender and education ratios within the carrier and noncarrier groups were comparable to baseline data.
Carriers did not differ significantly from noncarriers with regard to medication intake (
Table 1 ). A neuroleptic drug had to be prescribed to one carrier during the follow-up period.
Longitudinal Results
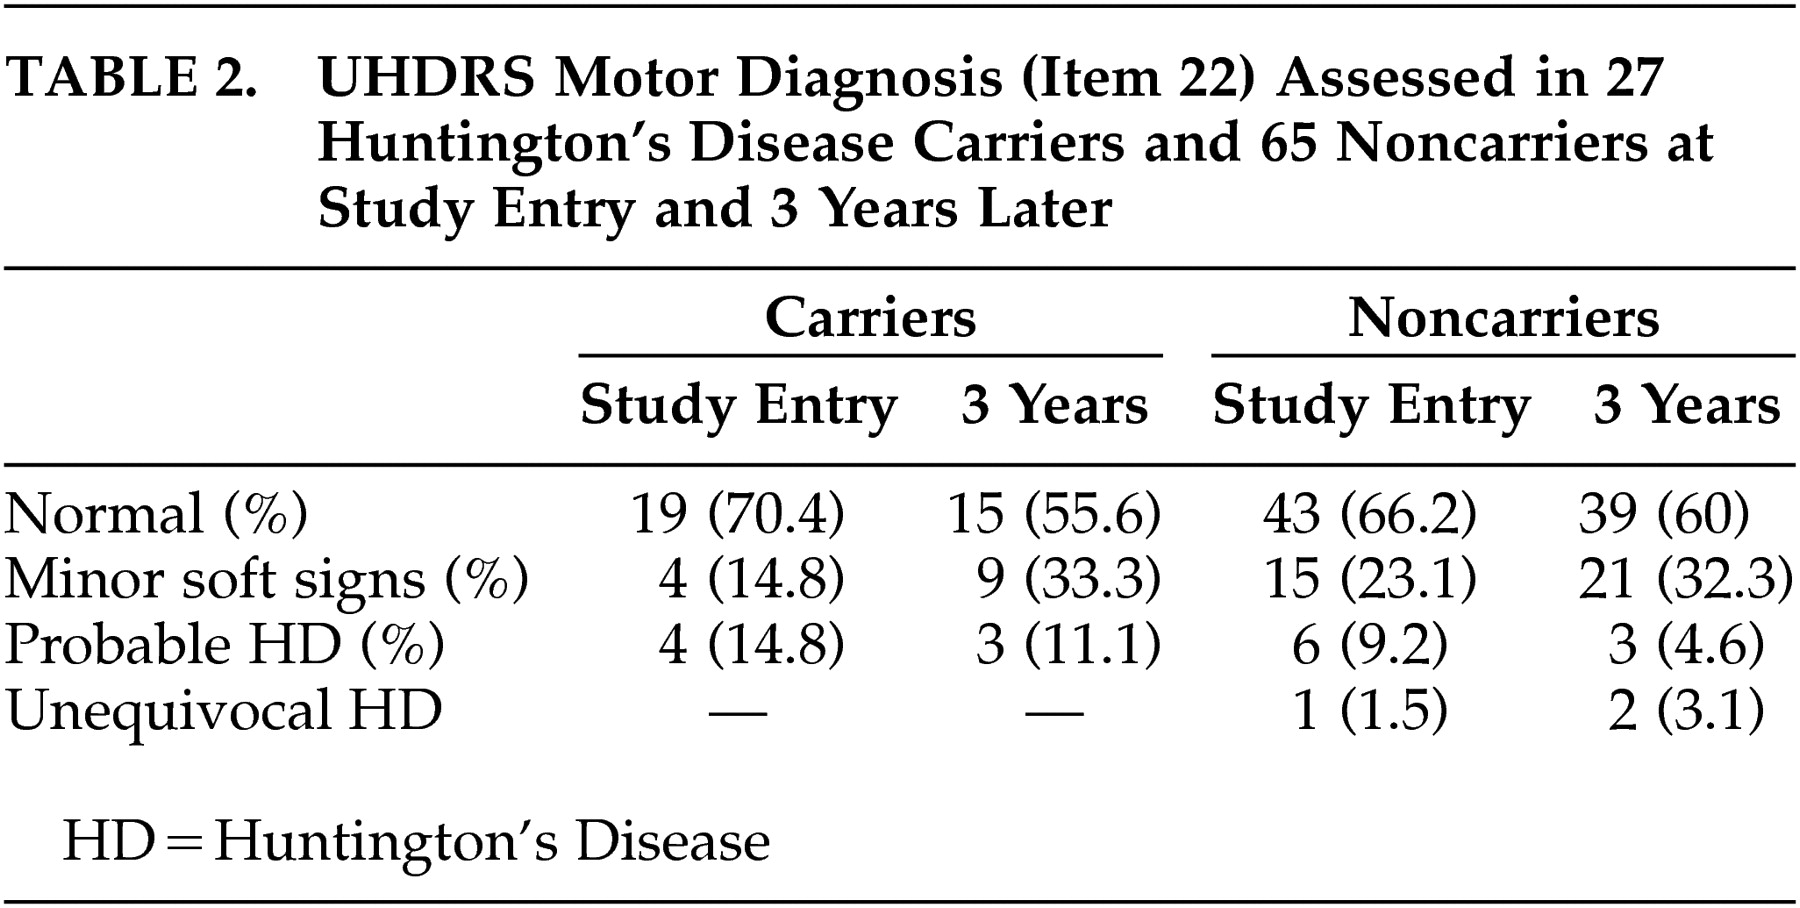
The number of participants to whom the complete motor part of the UHDRS was administered during the first as well as the third assessment was restricted to 27 carriers and 65 noncarriers. The results of the UHDRS motor diagnosis are reported for these groups in
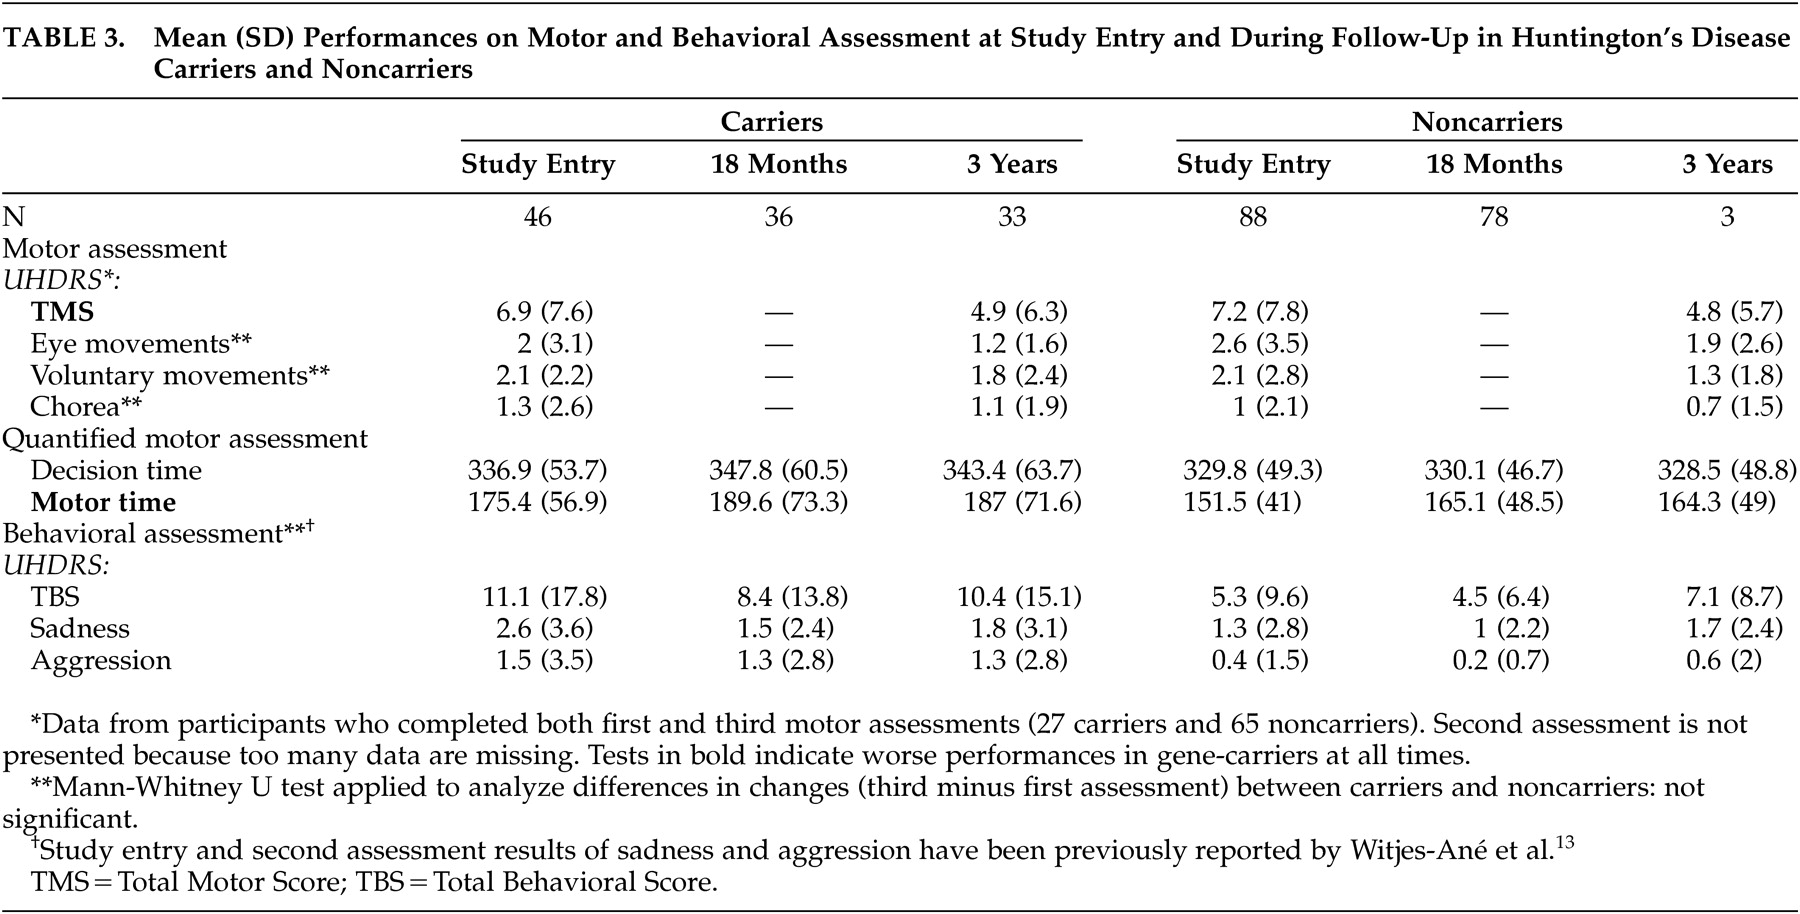
Table 2 . Within the two groups, most individuals—22 carriers and 55 noncarriers—were rated as normal or as having minor soft signs during baseline and after 3 years. None of the carriers with soft signs at entry developed overt clinical features of Huntington’s disease. Two carriers were again rated as probable Huntington’s disease cases, while two others changed from probable to minor soft signs. Ratings of three noncarriers changed from normal or minor soft signs to probable or unequivocal Huntington’s disease. Results of the motor, cognitive, and behavioral assessments are presented in
Tables 3 and
4 .
Follow-up analysis revealed significant effects of gene status and follow-up time but no interaction effect between these factors, irrespective of whether or not parallel test forms were used. The effect of gene status indicated that at all times, carriers performed worse than noncarriers on the TMS ( t =−2.55, df=127, p=0.01), the quantified motor assessment (motor time: t =−3.69, df=127, p=0.0003), the Performance IQ (t=2.83, df=131, p=0.005), the VLGT (t=2.68, df=131, p=0.008), the BVRT (t=4.01, df=131, p=0.0001), the SDMT (t=3.40, df=111, p=0.0009), the TMT (Part A: t =−3.70, df=131, p=0.0003; Part B: t =−3.15, df=111, p=0.002), and the Stroop interference (t=2.97, df=130, p=0.004). The effect of follow-up time indicated that for both groups taken together, scores improved significantly on the TMS ( t =−4.02, df=170, p=0.0001), Total IQ (t=5.66, df=105, p<0.0001), Verbal IQ (t=2.78, df=105, p=0.006), Performance IQ (t=6.28, df=105, p<0.0001), BVRT (t=2.72, df=211, p=0.007), SDMT (t=5.99, df=216, p<0.0001), TMT, Part A ( t =−5.68, df=218, p<0.0001), Stroop interference (t=4.18, df=218, p<0.0001), and verbal fluency (t=3.22, df=218, p=0.002). Performances became worse on the TMT, Part B (t=7.48, df=217, p<0.0001). However, the absence of an interaction effect between gene status and follow-up time indicated that the rate of change in motor, cognitive and behavioral performance did not differ significantly between carriers and noncarriers.
DISCUSSION
The aim of the present study was to evaluate the progression of motor, behavioral, and cognitive functioning in presymptomatic carriers for Huntington’s disease over a 3-year period by applying commonly used scales and tests. Although carriers showed subtle changes in speed of movement execution, psychomotor speed, and memory from baseline onward, the rate of change in test performance over time did not differ from that of noncarriers. Possible explanations for the lack of changes are that the pace of sign development in our cohort was too low to detect differences over a 3-year period or that the measures used were insufficiently sensitive or specific to detect such changes at this stage. This has implications for the design of future therapeutic trials.
The low pace of sign development could be explained by the heterogeneity within carriers with regard to closeness to onset age. Two studies, using an extensive battery of tests, failed to find changes in carriers after 2
10 and 4 years
11 of follow-up, but the authors suggested that the groups were too young (baseline ages were 31.9 and 26.2 years, respectively) for changes to be detected. Although the carriers from the present study were near the typical age of onset, no decline was observed. This could be due to the dropout of gene carriers as they could have had measurable longitudinal changes in motor and cognitive scores. Onset age varies considerably in the most commonly seen restricted pathological range of 40 and 45 CAG repeats.
23,
24 Improved inclusion criteria and better understanding of the factors contributing to onset age are, therefore, needed.
The finding of clinical markers in this population is hampered by methodological limitations in the assessment of the three domains characteristic of Huntington’s disease. The UHDRS does not seem sufficiently sensitive or specific for this purpose. Blind interpretation of the clinical significance of subtle motor signs proved unreliable since motor categorization was not consistent over time. Furthermore, the discovery of motor abnormalities in noncarriers was not anticipated. It appeared that the rating of noncarriers as unequivocal Huntington’s disease was not based on severe abnormalities on specific motor items but rather on the accumulation of items rated 1 (subtle abnormalities). As different physicians were involved in the grading throughout the study, some difference in interpretation should also be taken into account. This has implications for the diagnostic process when determining the threshold for Huntington’s disease onset. Even though subtle neurological changes were found in carriers,
7,
25 it has also been reported that these were missed or nonspecific for the determination of Huntington’s disease onset in routine neurological examination.
1,
26 Furthermore, the results of the UHDRS behavioral assessment were also inconsistent over time. In our previous study, we tentatively concluded that after 18 months, aggression might be seen as a first manifestation of Huntington’s disease,
13 but the present study shows that this observation was not sustained in further follow-up. Variability in occurrence of psychiatric symptoms has previously been reported.
27,
28 In the longitudinal assessment of cognitive functioning, retest effects are a well-known limitation masking a potential decline. They have been reported in studies involving patients
29,
30 as well as presymptomatic carriers
8,
10 and were observed in our study mainly in psychomotor tasks.
Clinical centers differ in their threshold for diagnosing Huntington’s disease and in defining asymptomatic at-risk status.
5 These differences explain the inconsistent findings and further hamper the determination of Huntington’s disease onset. Nowadays, individuals tend to seek treatment earlier as families are more aware of the disease. The present findings demonstrate that the clinician should be cautious in establishing and communicating a definite diagnosis based on subtle motor changes because for the individual this will mean the end of subjective health and the start of being a patient.
1,
26Longitudinal assessment using clinical markers (motor, cognitive, and behavioral) is still essential but should be done in combination with other variables, such as neurophysiological measures, brain imaging, and biomarker, that change linearly with disease progression. For example, volumetric MRI studies in presymptomatic carriers show neuropathological changes prior to clinical diagnosis.
31 The monitoring of disease onset still poses a difficult challenge requiring (new) measures sufficiently sensitive to track the presymptomatic or early disease stage. A more comprehensive scale than the UHDRS, for example, should be developed
5,
32 and implemented for diagnostic and research purposes. In order to include carriers in trial designs, the focus should be on suitable endpoints instead of on detecting actual disease onset, which has proved to be an arbitrary concept. For this purpose, efficient and pragmatic criteria should be set. Cut-offs could be used, for example, TMS of 20 at the fifth percentile (after calculation in our carrier group) or a longitudinal one like the percentage of decreased performance on a specific task. The variability within performances of an individual could also be a criterion. For example, comparison subjects are more consistent over time when performing simple tasks like the TMT, Part A or Stroop color naming and word reading, while the performance of gene carriers is more variable.
9 Furthermore, it is important to take into account variables like retest effects and demographics. A possible solution to reduce retest effects is to discard the results of the first assessment
29 while the heterogeneity in terms of years to onset, for example, could be influenced by intellectual variability, a higher IQ indicating that the individual is further from onset.
To our knowledge, the present longitudinal study is the largest to compare carriers with noncarriers in an extensive battery of tests using the motor, cognitive, and behavioral domains. The design over a 3-year period failed, however, to find clinical markers for Huntington’s disease. Rather than waiting for phenoconversion without knowing what to search for, novel strategies should be developed to resolve the methodological limitations of longitudinal evaluation in order to include carriers in future therapeutic trials. To serve that purpose, improved inclusion criteria and better understanding of the factors contributing to onset age and variability in performances are necessary. Furthermore, research should focus on comprehensive tools to track suitable clinical endpoints and combine these with wet and dry biomarkers.
