Behavioral Performance
In the attended auditory target (AAT) controlled processing task, patients made fewer hits, detection or correct responses (mean±SE of means; 57.5±5.0%), than the comparison subjects (76.6±5.6%; t=2.5, df=41, p<0.01), but more misses, or false negatives (36.6±5.2%), than comparison subjects (23.5±4.5%; t=1.9, df=41, p<0.05). There were no significant group differences for nonresponses (t=1.1, df=41, p=0.13; patients=5.8±2.3%; comparison=2.3±1.5%), for latency on correct trials (t=1.7, df=41, p=0.43; patients=516±23 msec; comparison=510±28 msec), or for incorrect trials (t=1.1, df=41, p=0.13; patients=414±60 msec; comparison =320±21 msec). During the unattended auditory deviants (UAD) automatic processing task, subjects performed a visual discrimination task. Patients again made fewer hits (54±4%) than comparison subjects (74±4%; t=3.1, df=41, p<0.005). We tested for the possibility of order effects (e.g., habituation) given that the UAD trials always preceded AAT trials. Performance data from the visual discrimination task in runs 1 through 7 showed no differential decline in performance between patients and comparison subjects (F=0.4, df=1, 290, p=0.53).
Regions of Interest Analyses
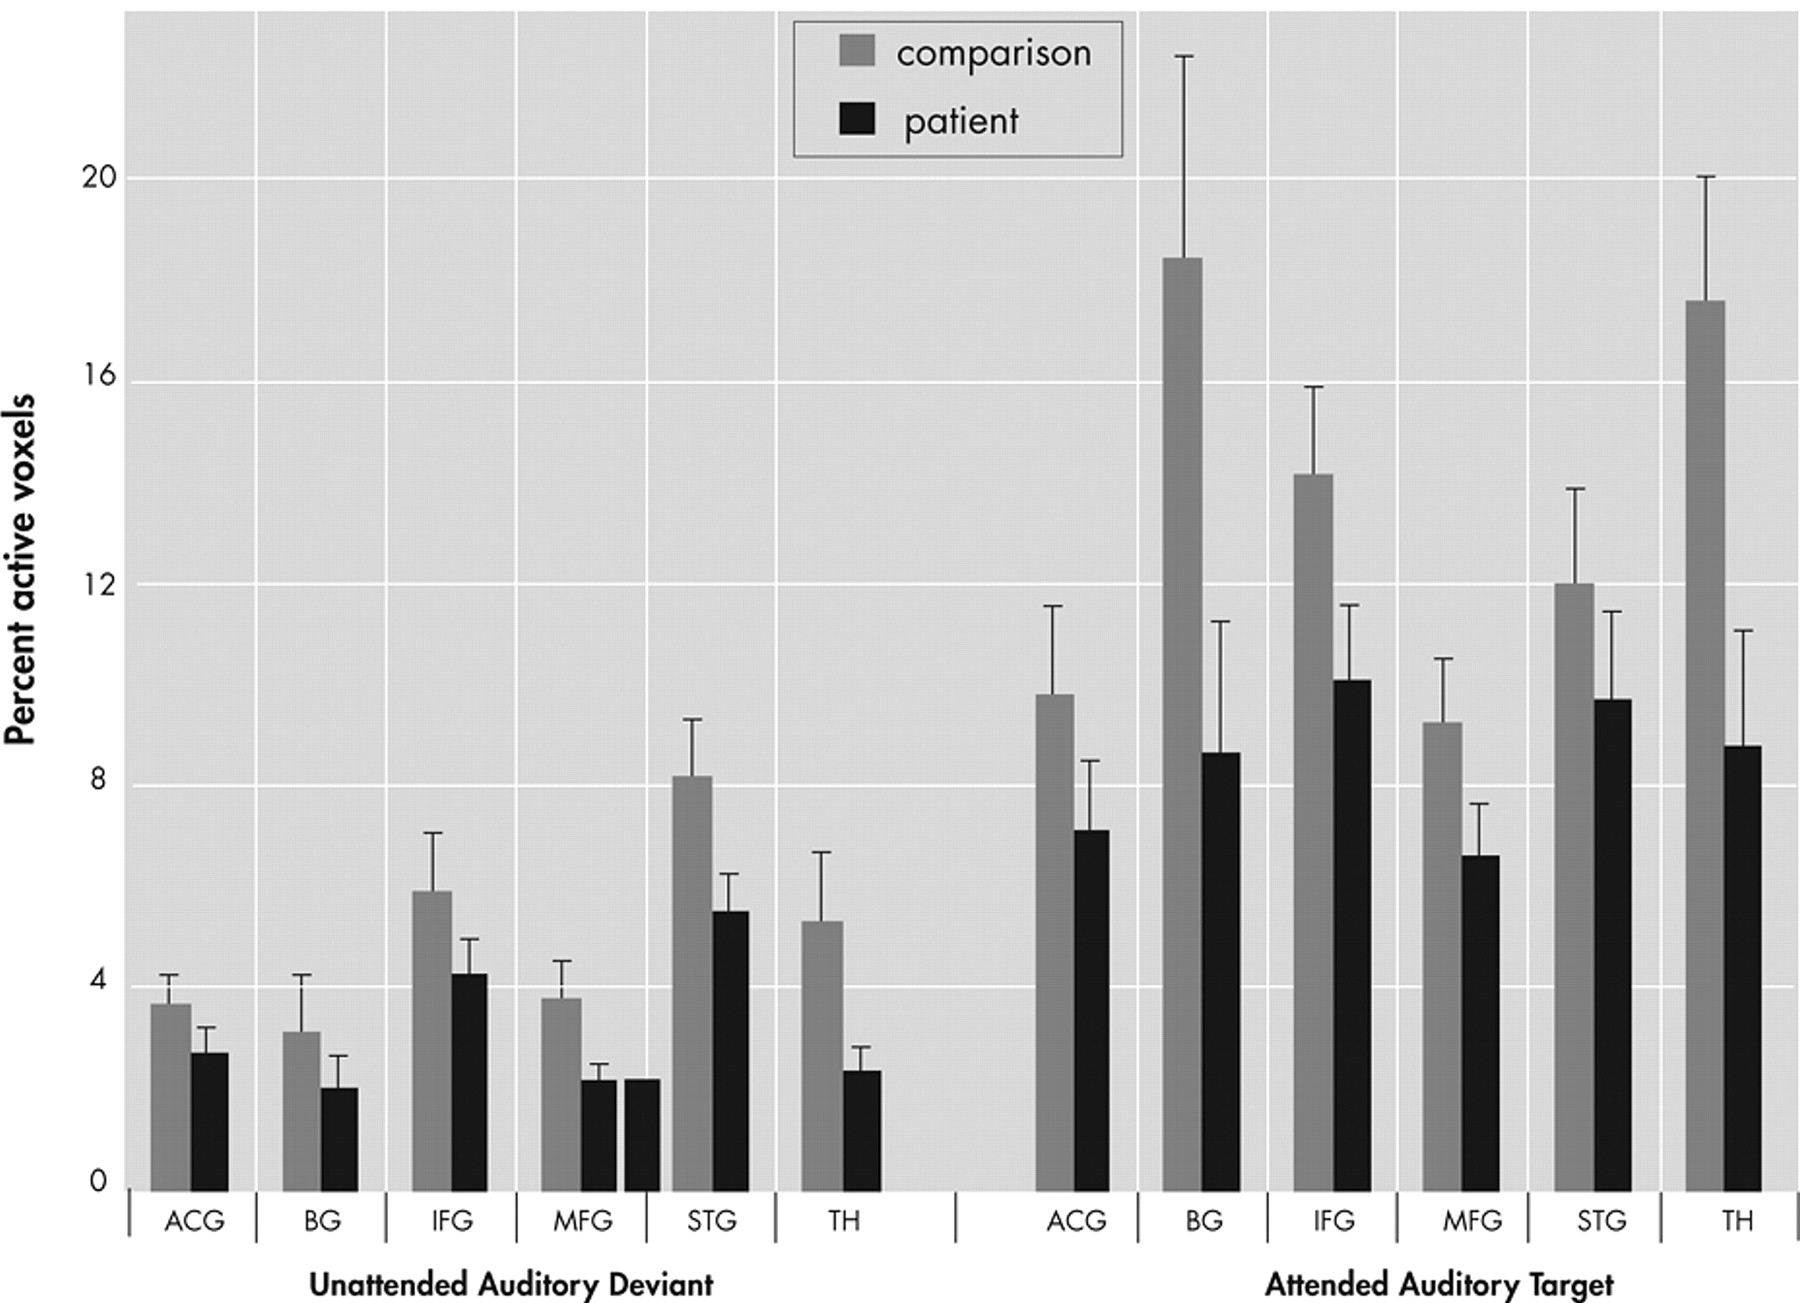
The percentage of activated voxels within each anatomical region of interest was analyzed as the dependent variable in an omnibus analysis of variance (ANOVA) with factors of group (patient, comparison), region (ACG, IFG, MFG, STG, basal ganglia, thalamus), condition (AAT, UAD), and hemisphere (Left, Right). This analysis resulted in main effects for group (F=7.8, df=1, 41, p<0.01), region (F=6.5, df=5, 205, p<0.0001], condition (F=40.3, df=1, 41, p<0.0001), and hemisphere (F=21.1, df=1, 41, p<0.0001), as well as interaction effects for region×group (F=2.3, df=5, 205, p<0.05) and region×condition (F=5.1, df=5, 205, p<0.005), and a trend level interaction for region×condition×group (F=2.0, df=5, 205, p<0.08), but no effect for hemisphere×group (F=0.04, df=1, 41, p=0.85). As seen in
Figure 4, post hoc analyses showed greater overall extent of activation in comparison subjects than patients (main effect of group) and greater activation to the AAT condition than UAD condition (main effect of condition). Post hoc analyses of the UAD condition revealed that the patient group had a smaller extent of activation in the superior temporal gyrus (t=4.21, df=41, p<0.05), thalamus (t=5.6, df=41, p<0.05), and middle frontal gyrus (t=4.6, df=41, p<0.05). Post hoc analysis of the AAT condition showed smaller extent of activation in the patient group in inferior frontal gyrus (t=1.7, df=41, p<0.05), basal ganglia (t=2.1, df=41, p<0.02), and thalamus (t=2.5, df=41, p<0.01), and trending smaller in middle frontal gyrus (t=1.6, df=41, p<0.06).
This analysis was repeated using percent signal change as the dependent variable and results were generally consistent with the preceding analysis. An omnibus ANOVA using PSC as the dependent variable revealed main effects for group (F=5.46, df=1, 41, p<0.03), region (F=22.4, df=5, 205, p<0.0001), and condition (F=17.5, df=1, 41, p<0.0001), and an interaction of region×condition (F=2.5, df=5, 205, p<0.05); there was no main effect for hemisphere (F=1.4, df=1, 41, p=0.25) and no interaction effects for region×group (F=0.73, df=5, 205, p<0.6), condition×group (F=0.11, df=1, 41, p<0.75), hemisphere×group (F=0.91, df=1, 41, p=0.35) or region×condition×group (F=0.69, df=5, 205, p<0.63). Post hoc analyses showed greater overall intensity of activation in comparison subjects relative to patients and in the AAT condition relative to the UAD condition. Post hoc analysis showed lower AAT activation in the patient group in inferior frontal gyrus (t=2.1, df=41, p<0.05) and thalamus (t=2.3, df=41, p<0.02), and for the UAD condition in thalamus (t=2.7, df=41, p<0.01) and marginally lower in the left superior temporal gyrus (t=1.6, df=41, p=0.06).
As the two groups differed in their performance accuracy in the AAT condition, we reanalyzed the data from this condition using only trials with correct responses (the UAD condition was not reanalyzed since no behavioral responses were involved). This analysis resulted in a marginal main effect for group (F=3.6, df=1, 41, p<0.07), a significant main effect for hemisphere (F=7.6, df=1, 41, p<0.01), and for region (F=6.7, df=5, 205, p<0.0001), as well as significant interaction effects for region×group (F=2.4, df=5, 205, p<0.04), region×hemisphere (F=7.1, df=5, 205, p<0.0001), and region×hemisphere×group (F=4.2, df=5, 205, p<0.005). These effects parallel those from the analysis of all trials. Post hoc analyses showed a smaller spatial extent of activation in patients than comparison subjects in the right inferior frontal gyrus (t=2.1, df=41, p<0.01), left basal ganglia (t=2.6, df=41, p<0.01), and the left anterior cingulate gyrus (t=1.8, df=41, p<0.05).
A post hoc analysis of the middle frontal gyrus and superior temporal gyrus showed that AAT activation in the middle frontal gyrus was highly correlated with UAD activation in superior temporal gyrus in patients (percentage of activated voxels; r=0.70, p=0.0001), but not in comparison subjects (r=0.12, p=0.65).

