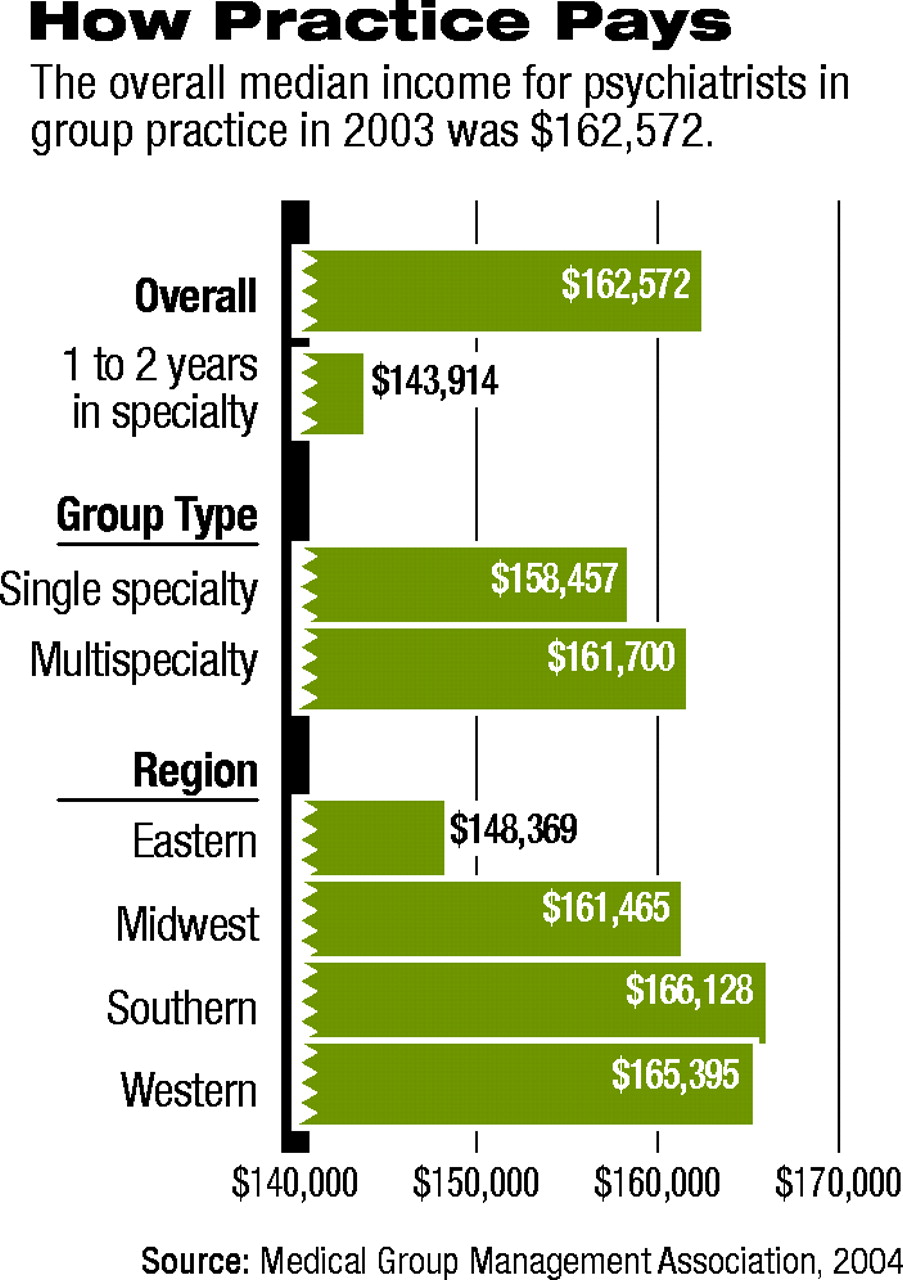
Psychiatrists in group practices reported an average income of $171,998 in 2003, with the median income at $162,572.
That median income represents a slight decrease of 0.35 percent from the previous year, but a 7 percent increase since 1999, according to the Medical Group Management Association's (MGMA) “Physician Compensation and Production Survey: 2004 Report Based on 2003 Data.”
The MGMA report outlines compensation and production indicators for more than 40,000 clinicians in 105 physician specialties and 30 nonphysician specialties in all 50 states and the District of Columbia.
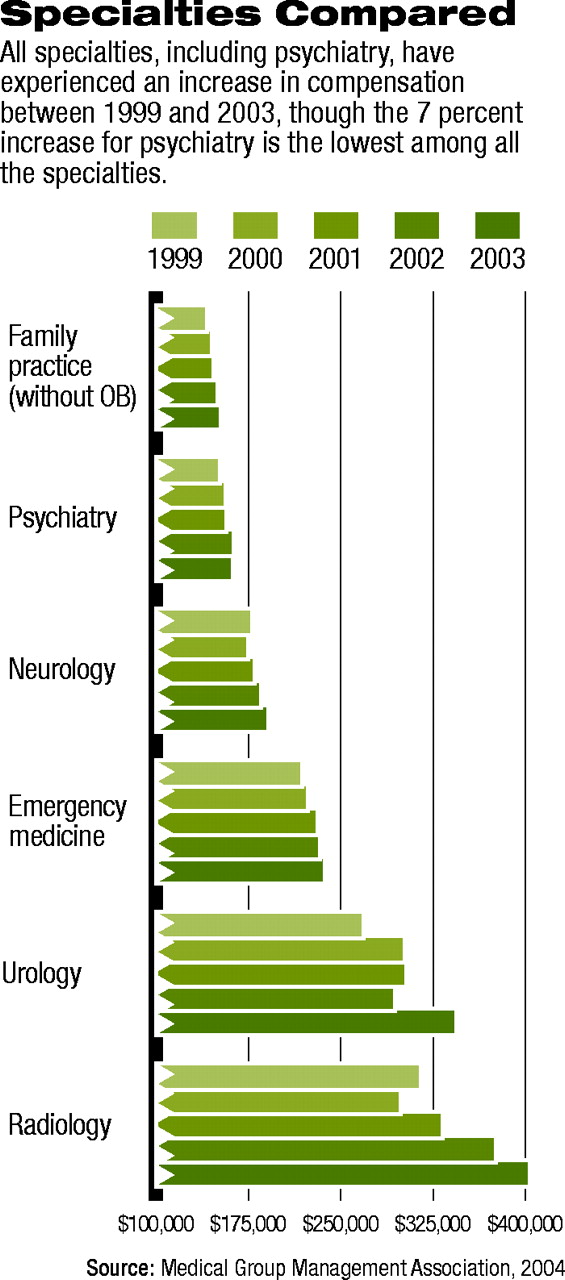
Among the 17 specialties surveyed by the MGMA, psychiatry was the only one to experience a decrease in compensation between 2002 and 2003. All of the specialties, including psychiatry, have experienced an increase in compensation between 1999 and 2003, though the 7 percent increase for psychiatry is the lowest among all the specialties.
Specialties that experienced the greatest increase in compensation in the four-year period beginning in 1999 were dermatology (36.6 percent), ophthalmology (36.5 percent), gastroenterology (32.9 percent), and anesthesiology (32.2 percent).
Meanwhile for primary care practices, data suggest that compensation is not keeping up with physicians' workloads, and the cost of doing business as a primary care physician may be increasing at a faster rate than that for specialists. Primary care practices that responded to the survey reported a slight increase in physician compensation of 2.4 percent but a 6.1 percent increase in charges (a surrogate for productivity). It is the third straight year that the MGMA has found that increases in primary care productivity outpaced increases in compensation.
“Growth in primary care [income] has been so limited that we fear this field could become unattractive to young physicians,” said MGMA President and CEO William F. Jessee, M.D. “Primary care practices will continue to struggle to survive unless their financial viability improves. If it does not, we are likely to see more specialists in multispecialty groups refuse to subsidize the unprofitable primary care segment of their group.”
The MGMA survey of physician compensation and productivity has been conducted annually since 1987, when managed care and other economic forces began to spur the growth of single- and multi-specialty practices, and to spell the end of the “cottage industry” era of solo, private practice. The report contains sections on physician compensation, benefits, and productivity. Productivity measures include charges, gross charges, ambulatory encounters, hospital encounters, surgical/anesthesia care, and total and physician work relative-value units.
The MGMA noted that the survey of its membership is voluntary and may not reflect industry trends.
For the 255 psychiatrists in 65 multispecialty practices responding to the survey, the average income was $172,518, with a standard deviation of $50,802. For the 15 psychiatrists in four single-specialty practices responding to the survey, the average income was $163,149, with a standard deviation of $45,103.
Average gross charges for the 180 psychiatrists in group practices who responded came to $354,670. The ratio of compensation to gross charges for the 170 psychiatrists who responded to the question on that issue was 0.492.
Compensation figures are also broken down according to the percentage of patients seen in the practice who are in health plans with capitated-payment arrangements. Psychiatrists in practices that had no capitation earned the highest average compensation, at $190, 918. Those in practices with 10 percent or less capitation had an average compensation of $166,562, while those in practices with 11 percent to 50 percent capitation had an average compensation of $153,930.
Psychiatrists in practices with 51 percent or more capitation had an average compensation of $169,849.
The MGMA survey also reported compensation for nonphysician providers of health care services. Psychologists, alone among the six nonphysician groups surveyed, experienced a drop in compensation—2.62 percent from 2002 to 2003 and .71 percent from 1999 to 2003.
The median compensation of $70,000 for psychologists in group practice in 2003 was the lowest of the nonphysician groups surveyed.
The MGMA report can be purchased by phone at (877) 275-6462, ext. 888, or online at<www3.mgma.com/ecom/store/>. The price for MGMA members is $270; for nonmembers, $480. ▪


