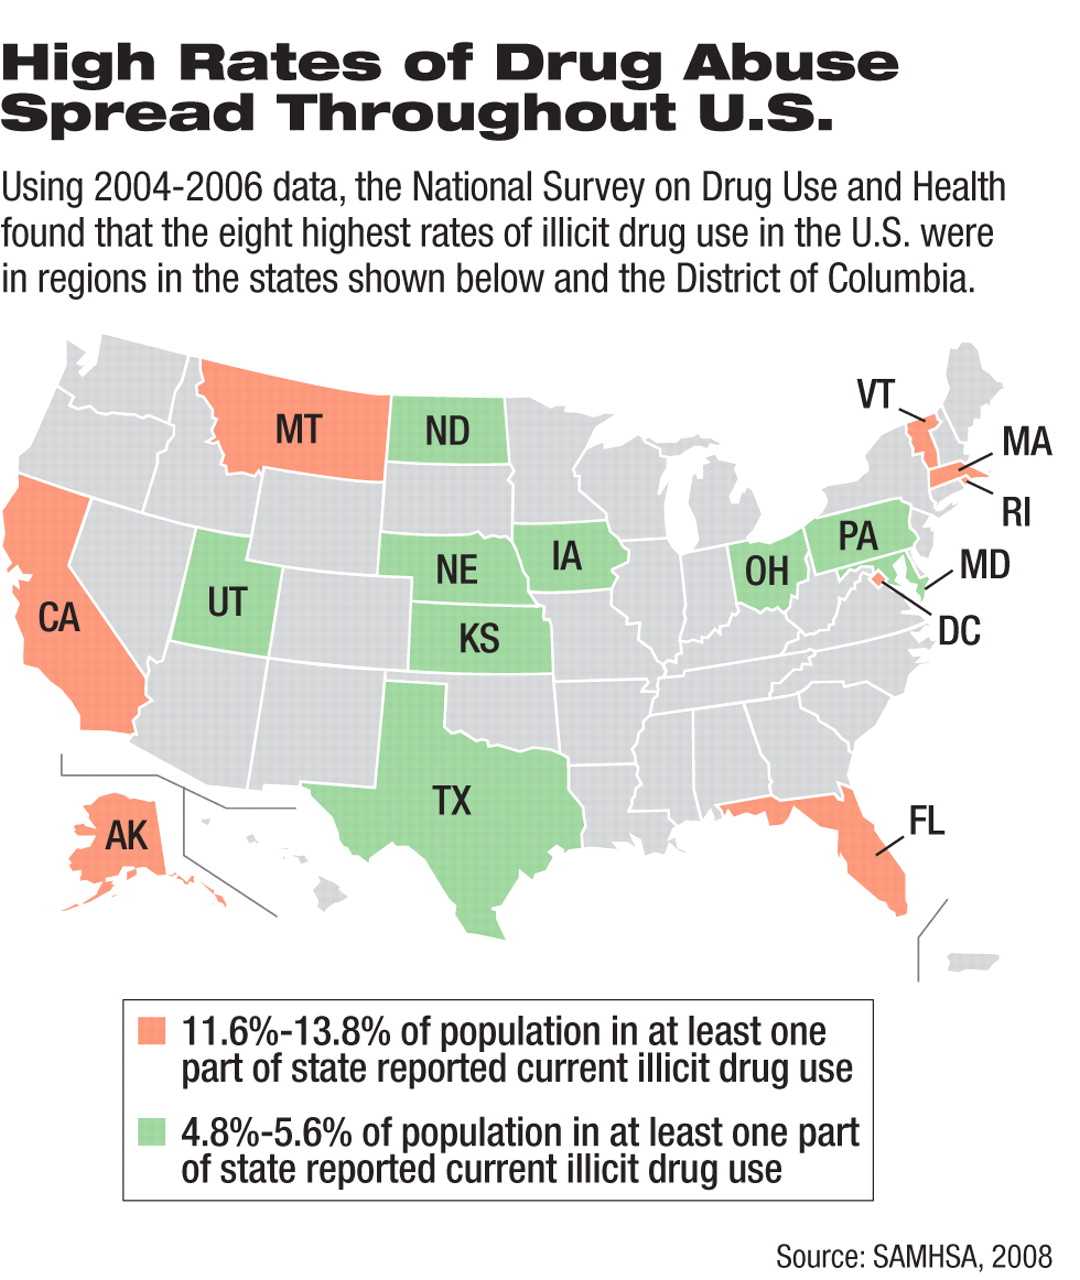
Although an estimated 8 percent of Americans aged 12 and older reported current use of an illicit drug, usage rates varied greatly from one state to another, and even from one county to another, according to new annual survey data from government researchers.
A June report on the survey from the Substance Abuse and Mental Health Services Administration on the illicit use of drugs and alcohol across the United States revealed that the regions with the highest rates of drug use were in Alaska, California, Massachusetts, and Rhode Island. The District of Columbia also had a high rate (see
map).
When researchers looked at rates of specific drug use, they found that the highest rates of current marijuana use were reported in western Montana, with 12 percent of residents reporting current use, while the lowest rates occurred in several regions: central Utah, the Four Corners region (where Colorado, New Mexico, Arizona, and Utah meet), and San Juan, Puerto Rico, where an estimated 3 percent of residents reported current marijuana use.
The data were compiled from the combined 2004-2006 National Surveys on Drug Use and Health (NSDUH), which includes data on drug and alcohol use from 203,870 respondents from a nationally representative sample aged 12 and older. The data, featuring representative samples from all states, the District of Columbia, and Puerto Rico, are then extrapolated to population estimates.
The NSDUH is conducted annually by researchers from Research Triangle Institute in Research Triangle Park, N.C.
From 2004 to 2006, an estimated 4.9 percent of Americans aged 12 and older reported using pain relievers illicitly in the past year. Estimates ranged from 2.5 percent in Washington, D.C., to almost 8 percent in the panhandle of Florida.
Alcohol is the most commonly used substance in the United States, with an estimated half of Americans 12 or older currently using alcohol. According to the data, the lowest rate of alcohol use was in Utah County, Utah (21 percent), and the highest was found in one section of Washington, D.C. (78.7 percent). Reports of binge drinking (defined as having five or more drinks on the same occasion) was lowest in Utah, and underage drinking was highest in D.C.
Current tobacco use was highest in West Virginia's south central region (43 percent) and lowest in Utah (17.3 percent).
“Substate Estimates From the 2004-2006 National Surveys on Drug Use and Health” is posted at<oas.samhsa.gov/substate2k8/substate.pdf>.▪