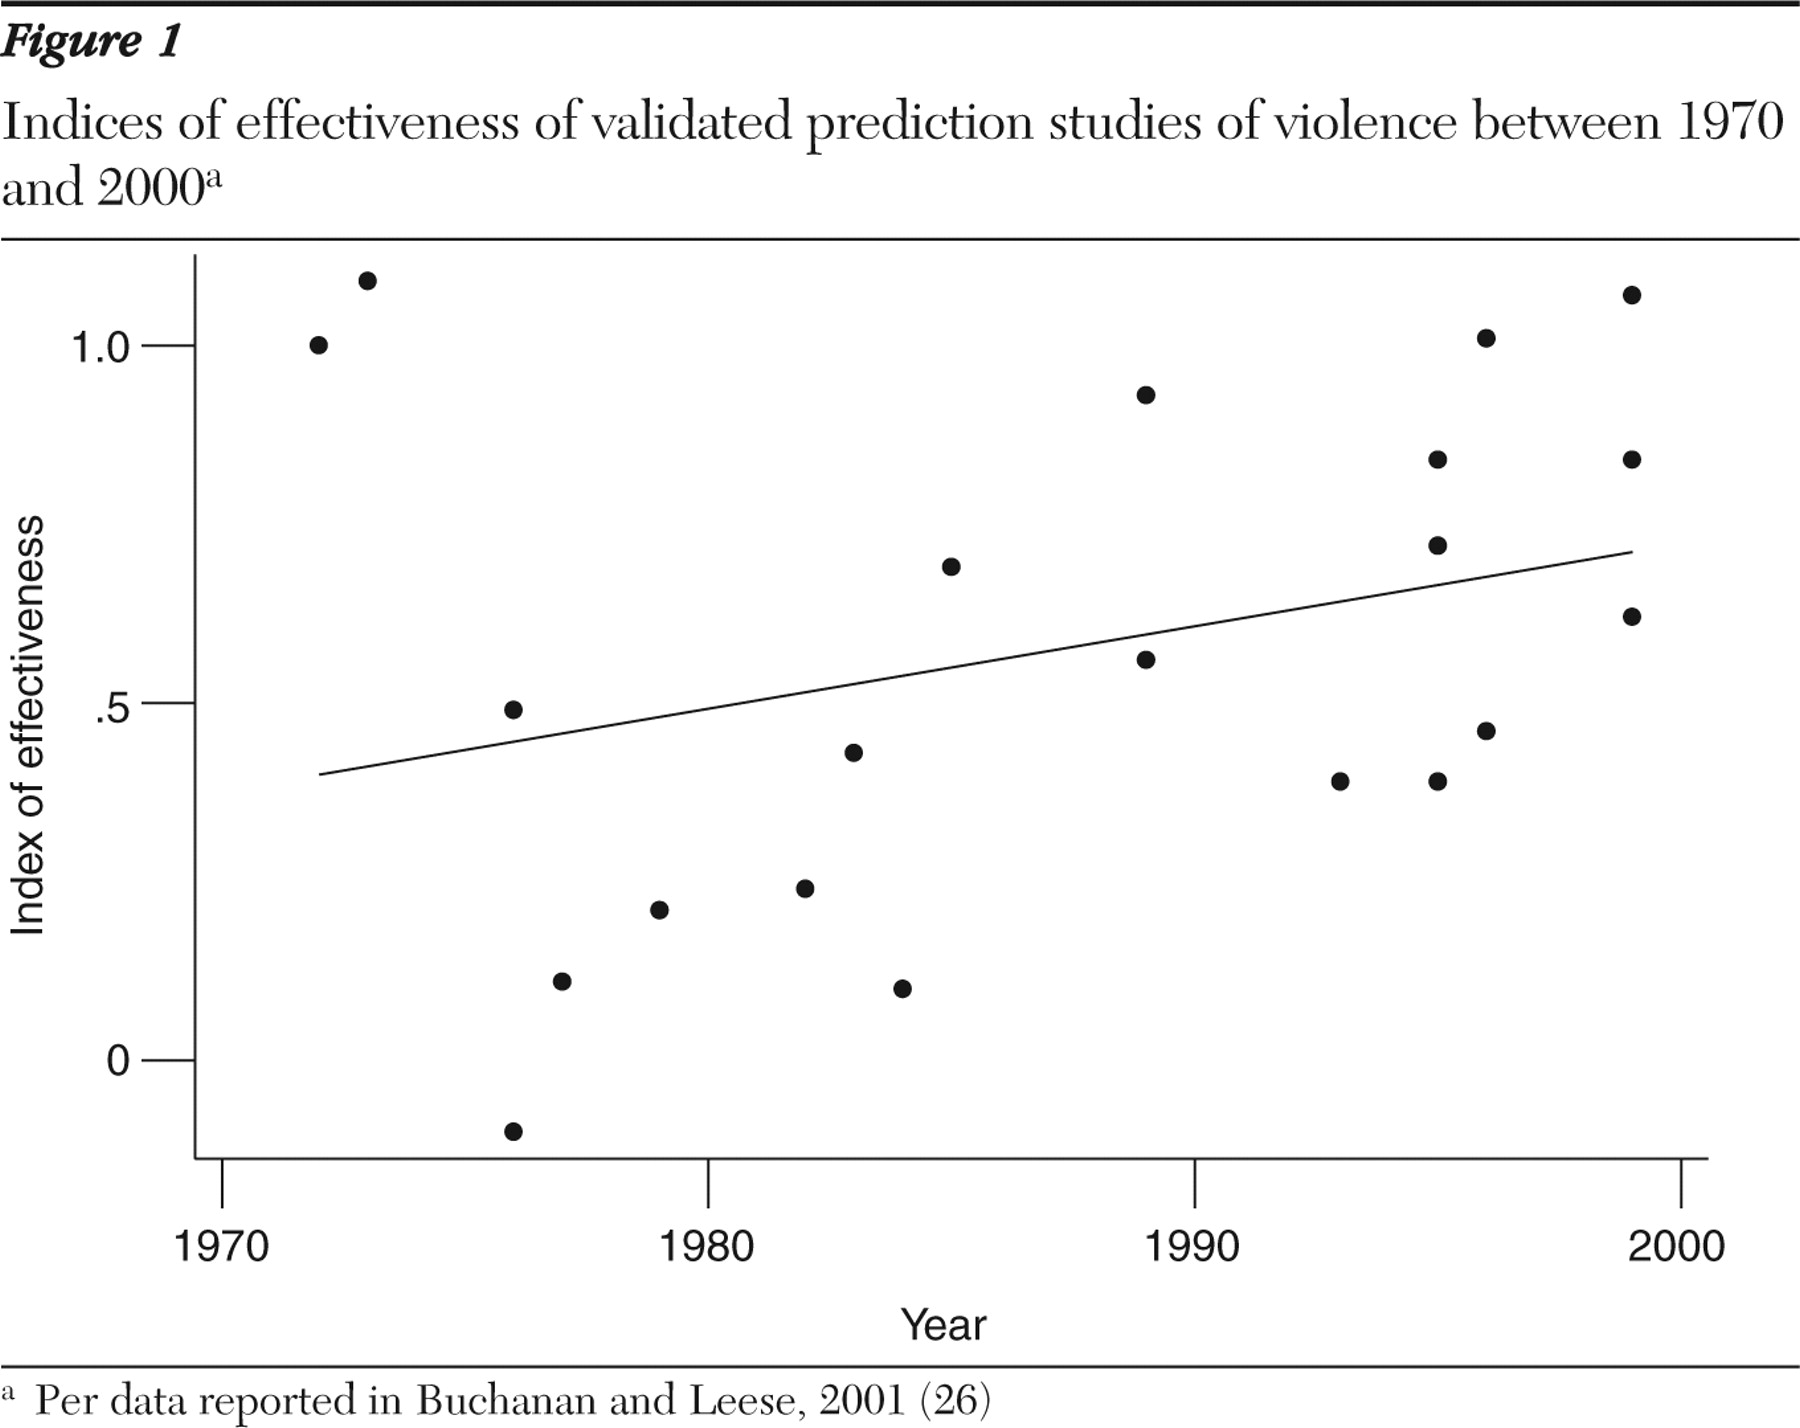
Overall accuracy
The accuracy of validated actuarial and clinical approaches to the prediction of violence in populations with mental disorders improved between 1970 and 2000 (
Figure 1 ). The improvement was limited and characterized by a wide range in the published results. Actuarial methods outperformed clinical methods (
4 ).
Before research can inform clinical practice, however, clinicians need to know not only that an improvement has occurred but also what level of accuracy that improvement now permits. Recent suggestions that actuarial approaches are inapplicable to the management of individual cases (
6 ) have been challenged (
7,
8 ). Instead, actuarial methods and the instruments they employ are usually held to possess a predictive validity that can be measured using the same statistical techniques that are used elsewhere in medicine.
The area under the ROC curve (AUC) ranges from .5 (random) to 1.0 (perfect prediction) and is used in medicine and surgery to describe the accuracy of screening techniques (
9,
10 ). Its particular value as a measure of predictive accuracy derives from its being independent of the base rate and of the "cutting score," the point on a continuous scale at which a person is classified as dangerous in each validation study. Validation of the revised version of Hare's Psychopathy Checklist (
11 ), the Violence Risk Assessment Guide (VRAG) (
12 ), and the Historical, Clinical and Risk Management Scheme (HCR-20) (
13 ) in the 1990s demonstrated AUCs of .72, .75, and .76 (
14,
15,
16 ). This level of accuracy is similar to that achieved by criminal justice agencies in predicting sex-offender recidivism (
17 ).
Since 2000 further validation of these instruments has generated AUCs ranging from .61 (
18 ) to .82 (
19 ). Their accuracy seems to generalize to nonforensic populations. The HCR-20 predicted violence in a general psychiatric sample with an AUC of .72 for men and .77 for women (
20 ). It generalizes also to samples outside North America. A Danish validation of the VRAG reported an AUC of .73 (
21 ). Newer instruments perform to a similar standard (
22 ). A replication of the iterative classification tree, the algorithm on which Classification of Violence Risk software (
23 ) operates, was published in 2005 and demonstrated AUCs of .63 and .70, depending on the outcome measure (
24 ).
Calculations of the AUC most often assume an optimal cutoff score, something that can only be calculated after the outcome for each subject is known. Where the optimal score is not known, accuracy will be less (
25 ). Translating figures for the AUC into numbers that are clinically meaningful is difficult for other reasons, too, not least because the clinical judgments that they might inform, such as whether to admit a patient to the hospital, derive from many considerations, not just one. One approach is to ask the following question: if a particular instrument was used as a screening test and those identified as likely to be violent were not discharged, over any given period how many patients would need to be detained to prevent one unwanted act?
This statistic, the number needed to detain, is the inverse of positive predictive value and analogous to the number needed to treat. It derives from sensitivity, specificity, and base rate (
26 ). The AUC of .75, of the VRAG, was generated with a procedure that classified patients as violent or nonviolent with a sensitivity level of .73 and a specificity level of .63 (
15 ). Used as a screening test where the base rate of violence is 10% and where, as a result, an unselective approach would lead to the detention of ten people in order to prevent one from acting violently, the VRAG would require the detention of five people to achieve the same end.
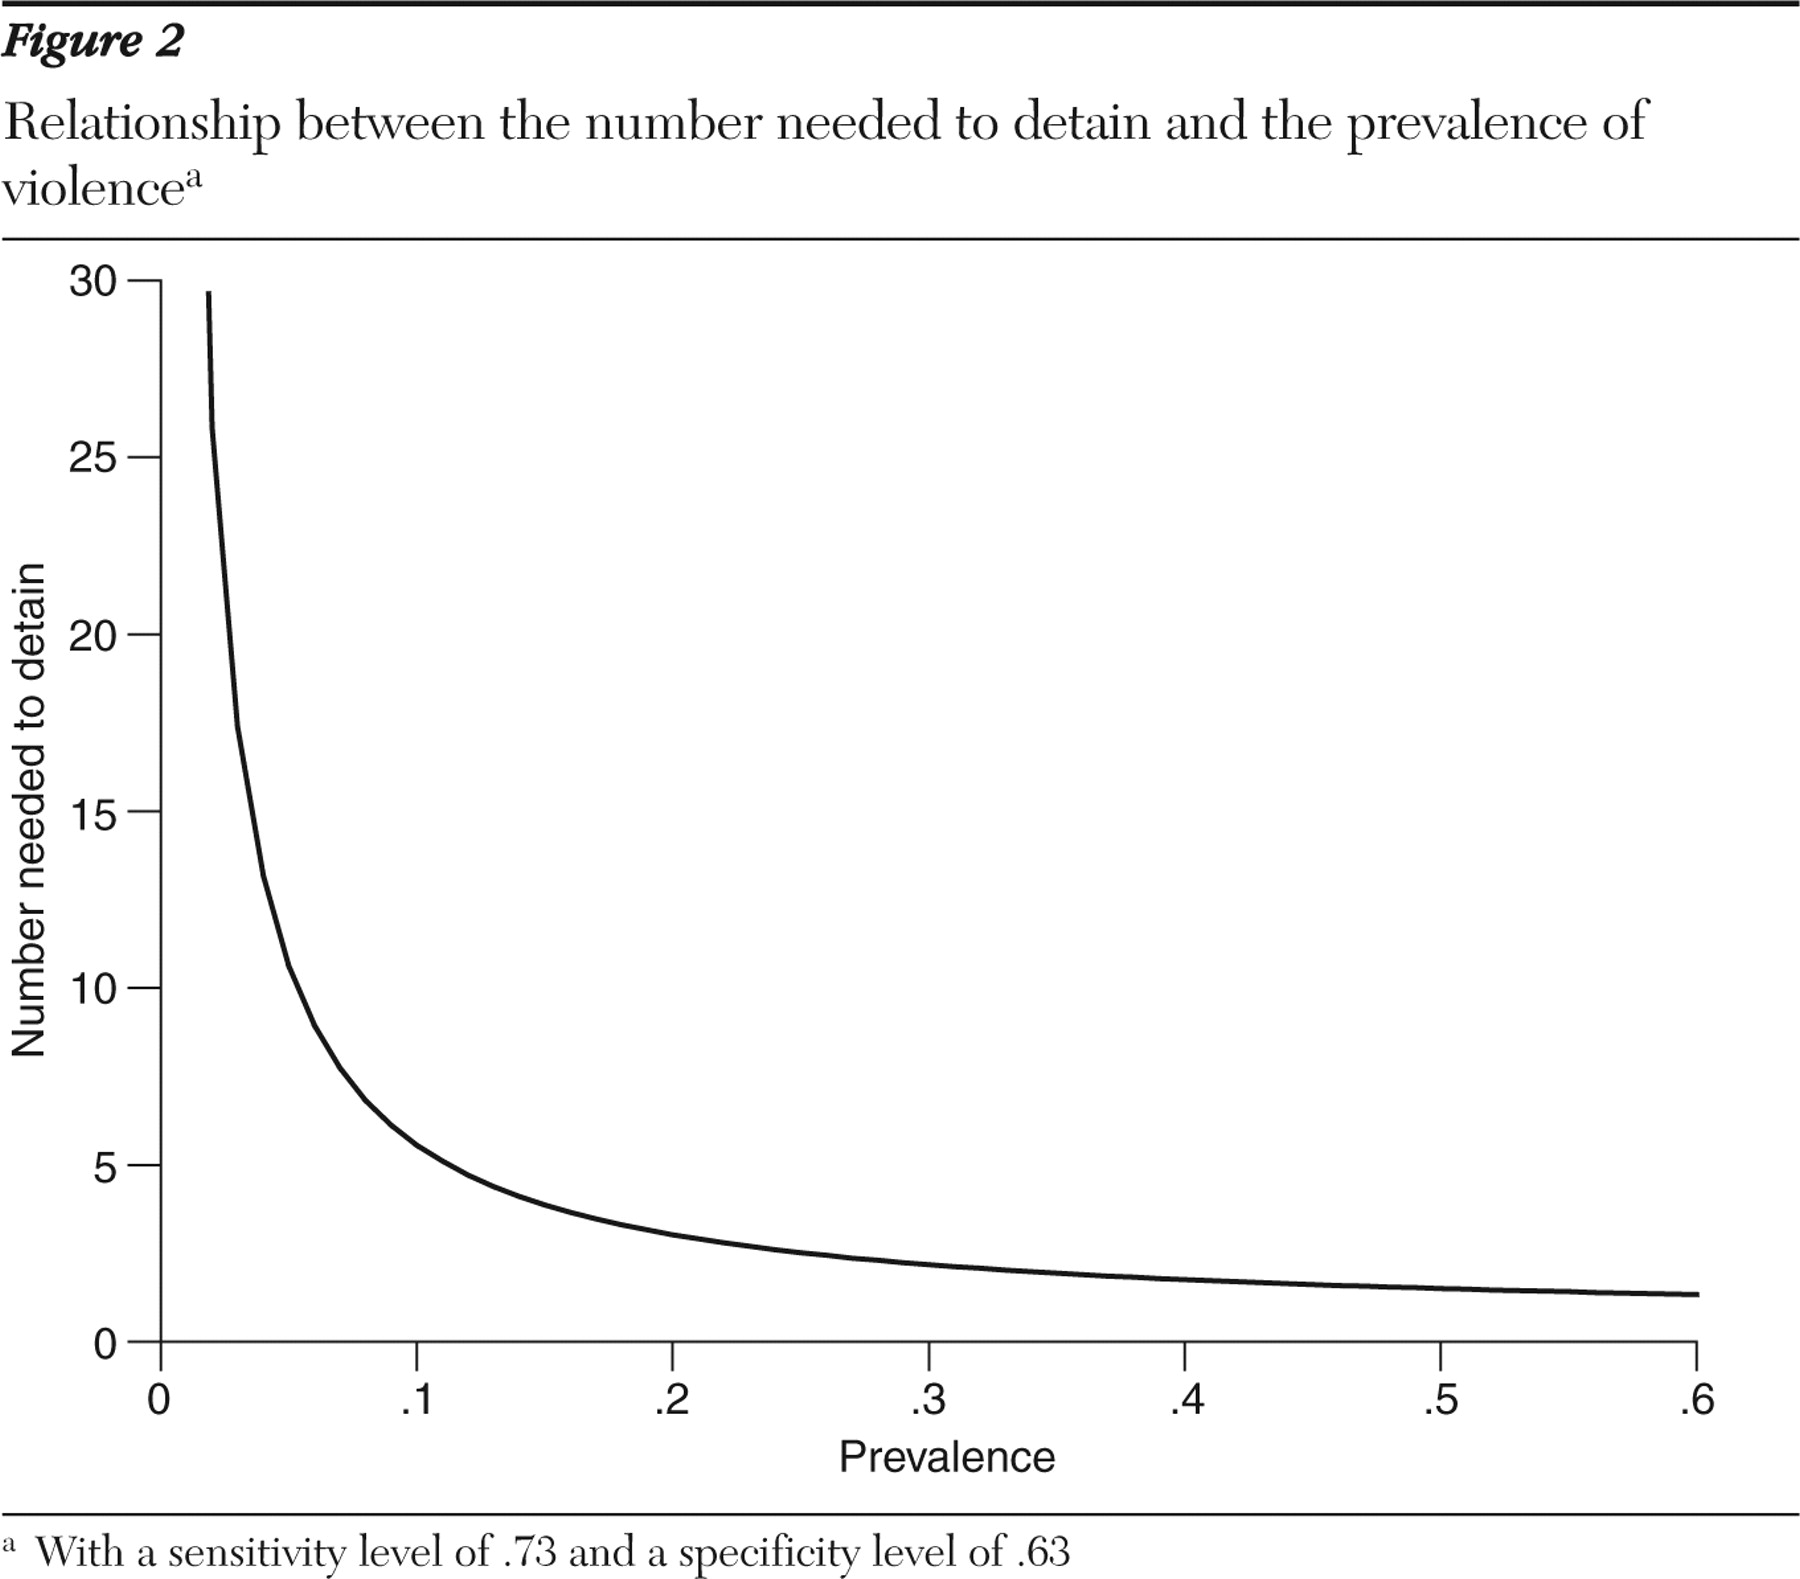
The number needed to detain rises as prevalence of violence falls (
Figure 2 ). One consequence is that the number of mistakes rises when unusual acts, such as acts of serious violence, are sought to be prevented. At the base rate recorded in the Epidemiologic Catchment Area study, where 17% of the sample self-reported violence in the previous 12 months, the number needed to detain to prevent an act of violence is 3.5. The outcome measure in the study was not conditional on violence that resulted in injury, however. When injury is required by the outcome measure, the base rate falls. In the CATIE (Clinical Antipsychotic Trials of Intervention Effectiveness) study, the six-month prevalence of assault with a weapon or causing serious injury was 3.6% (
27 ). Here the number needed to detain at a sensitivity of .73 and a specificity of .63 is 15.
A second consequence of the relationship between number needed to detain and prevalence shown in
Figure 2 is that at low base rates, prevalence becomes more important, and the psychometric qualities of a test less important, in determining the number of correct predictions. At the prevalence rates seen in most psychiatric outpatient settings, even a substantial improvement in an instrument's psychometric qualities may have limited effect. At the 3.6% base rate in the CATIE study, for instance, a 20% increase in sensitivity, all other things being equal, reduces the number needed to detain only to 13.
Relative accuracy in particular situations
Different risk factors apply and the same factors apply with different weights in different samples (
28 ). Mental disorder seems to be more important, for instance, when base rates are low (
29 ). Presumably for these reasons, the same instruments achieve different levels of accuracy in different populations (
30,
31 ). This has cost implications for actuarial approaches: the same techniques must be revalidated before their accuracies can be stated. By implication, although it is mentioned less often, equivalent concerns apply to clinical approaches. This heterogeneity also suggests, however, that in particular situations greater accuracy may be achievable.
For instance, are predictions more accurate when they cover only the near future? Reviews that control for base rates suggest that the accuracy of clinical and actuarial predictions is unaffected by the duration over which the prediction is made (
32 ). Clinicians have expressed the opposite view, that predictions are more accurate when they are made over short periods (
33,
34,
35 ). In theory, because clinicians talk to patients, they can have access to the reasons someone might act violently (
5 ). Because much violence associated with a psychiatric disorder is not planned, however, it may be that any consequent improvement in the ability to predict violence is too short-lived to be demonstrated by the usual research methods (
32 ).
Prediction may also be more feasible when patients have particular complaints. "Threat control override" symptoms, combining persecutory ideas and passivity experiences, have been linked to violent behavior in patient and community samples from the United States (
36,
37 ) and Israel (
38 ). The association has not been demonstrated consistently, however, and if it does exist it seems to operate differently in different populations. At least for threat control override symptoms and violence occurring within the same 12-month period, the association seems to disappear when substance abuse is controlled for (
37 ). It may disappear also when the client is in treatment (
39 ). Studies of discharges from inpatient units have also shown no consistent association (
40,
41 ), although this may be due to a failure to allow for a differential effect among men and women (
42 ).
A third possibility is that particular types of offending "breed true," offering the potential to reduce violence by identifying particular situations and potential victims. Criminological research demonstrates little of the "specialization" in offending that would allow this, however (
43,
44,
45 ), and what there is may not help with prevention. Although sexual offenders are more likely than others to commit the same type of offense on successive occasions (
46 ), a sexual offense against a child is still seven times more likely to be committed by a general offender than by someone with a history of sexual convictions (
47 ). Fewer data are available for psychiatric samples. It may be that patients who have assaulted people before hospitalization are more likely to choose the same victims when they assault people after they are discharged (
48 ). Those who offend after release from maximum-security hospitals, on the other hand, seem to display the same heterogeneity, between pre- and postdischarge offenses, evident in criminological research (
49 ).