Hypotheses
Feasibility. We assessed feasibility by comparing the CAI format to interviewer administration for rates of participation, completion, and missing data. Only 21 (8%) of the 266 potential participants who were approached declined to participate. The 21 persons who refused were given a checklist to detail their reasons: six were unwilling to use a computer, nine were unwilling to see an interviewer, and 12 were unwilling to give blood (multiple reasons were allowed). The high acceptance rate and the results of the checklist suggest that the computer was not a barrier to participation. Of the 245 clients who began the study, 12 (5%) dropped out between the first and second sessions. One mentioned dislike of the computer as the reason for dropping out, and two mentioned the interviewer as being the reason.
No difference was found between the formats in whether the interview was completed (100% completion in both groups). In order to examine missing data at the level of individual items, we focused on two of the measures, the DALI and the PCL (a total of 35 questions per client). Neither measure had branching options. In the first DALI interview, the 124 clients responding to trained interviewers answered an average of 17.8 of the 18 items, and the 109 clients responding to the computer answered an average of 17.1, a significant difference (t=4.67, df=231, p<.01). On the PCL, clients responding to trained interviewers answered an average of 16.9 of the 17 items, and clients responding to the computer answered an average of 16.7 items (t=2.26, df=231, p<.025).
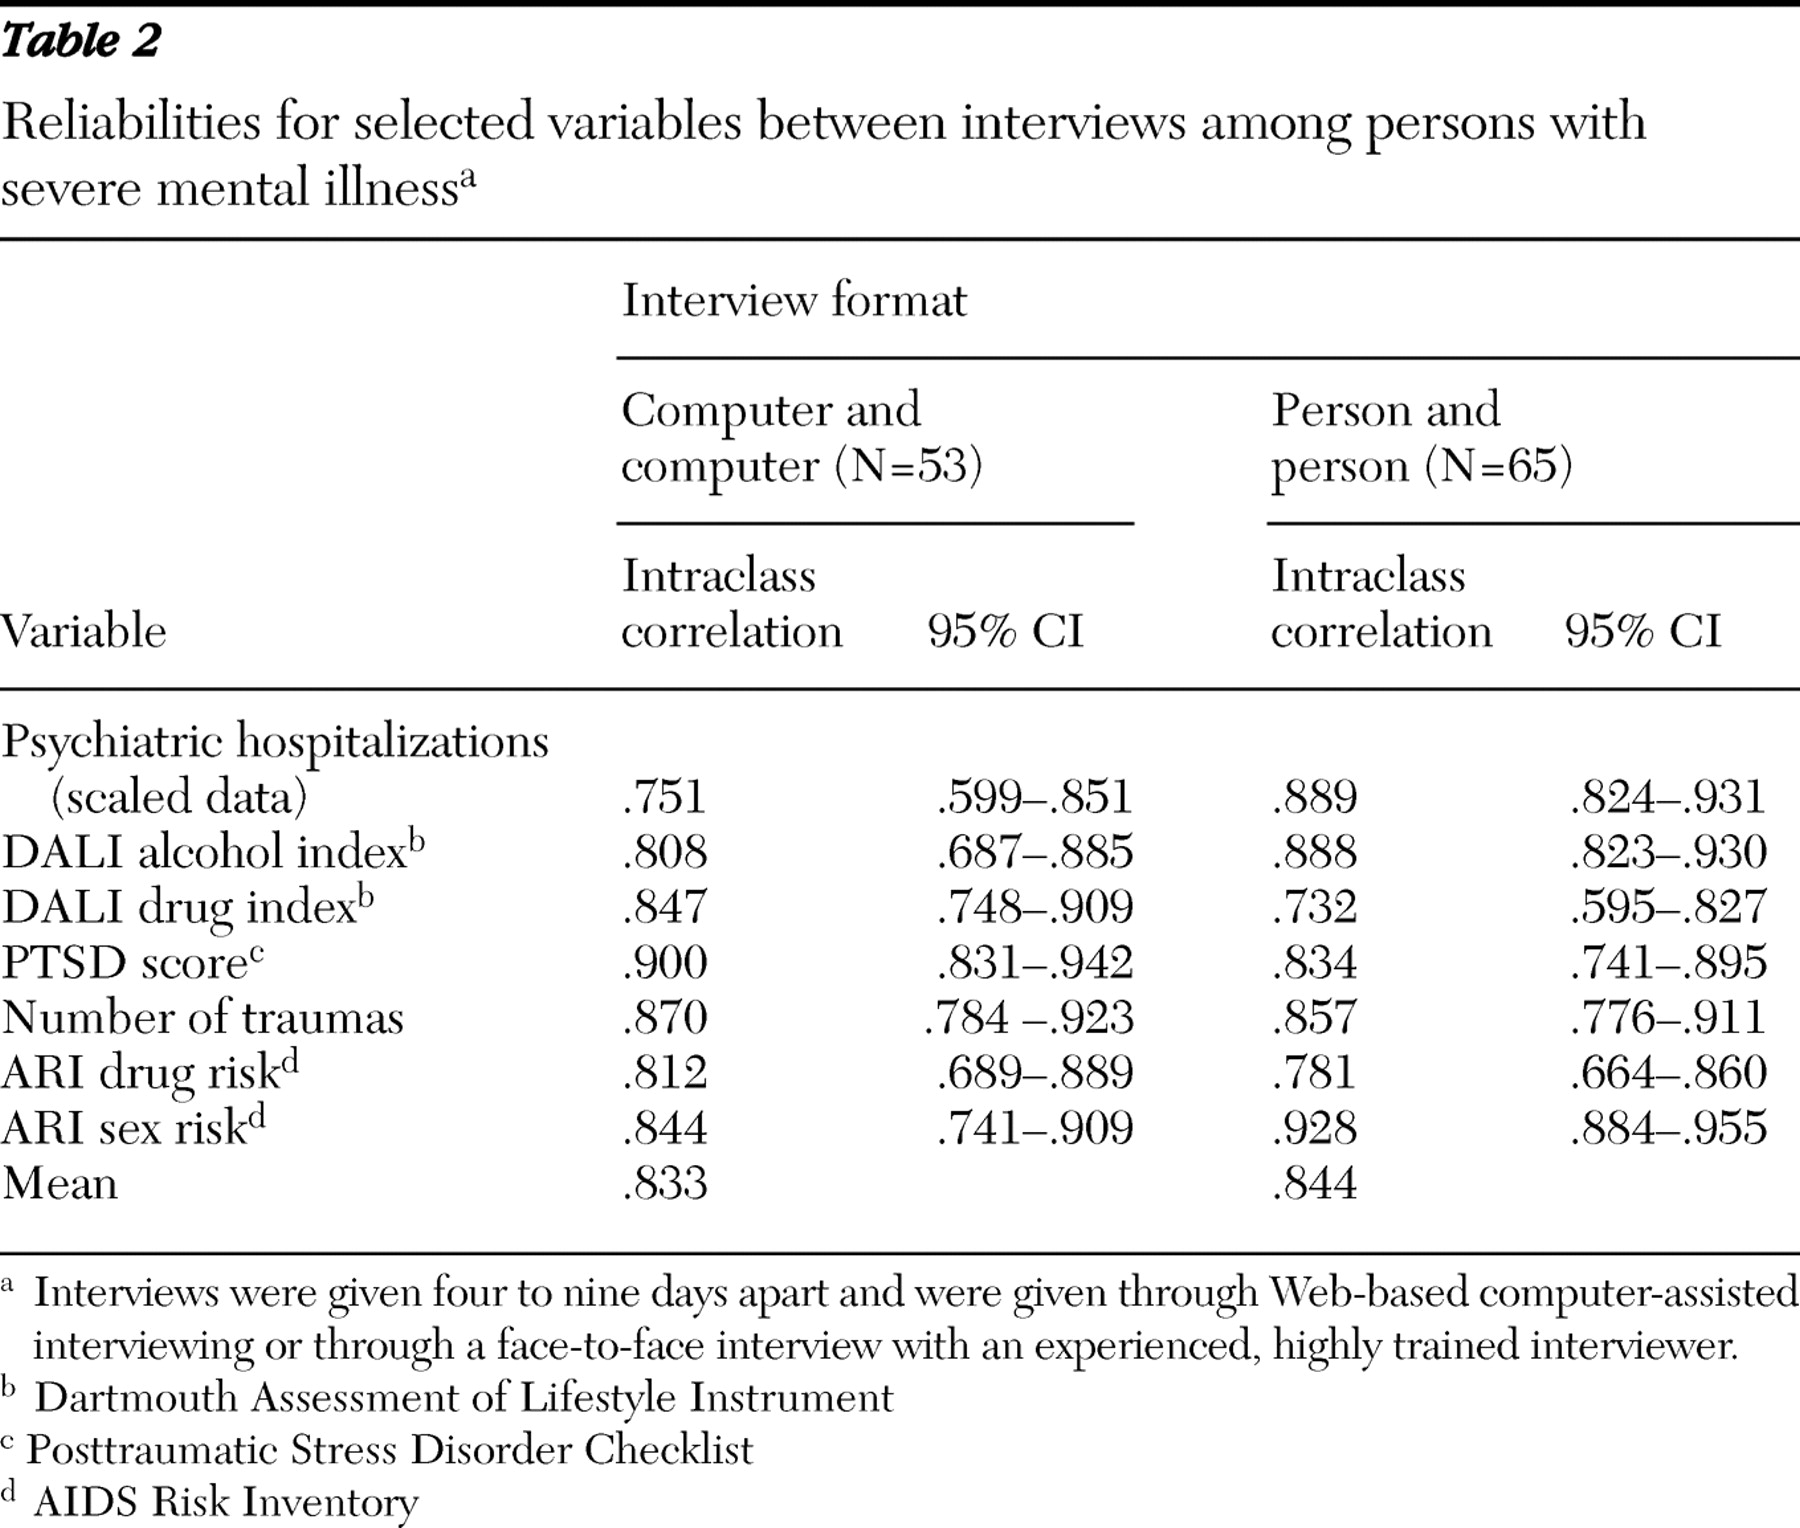
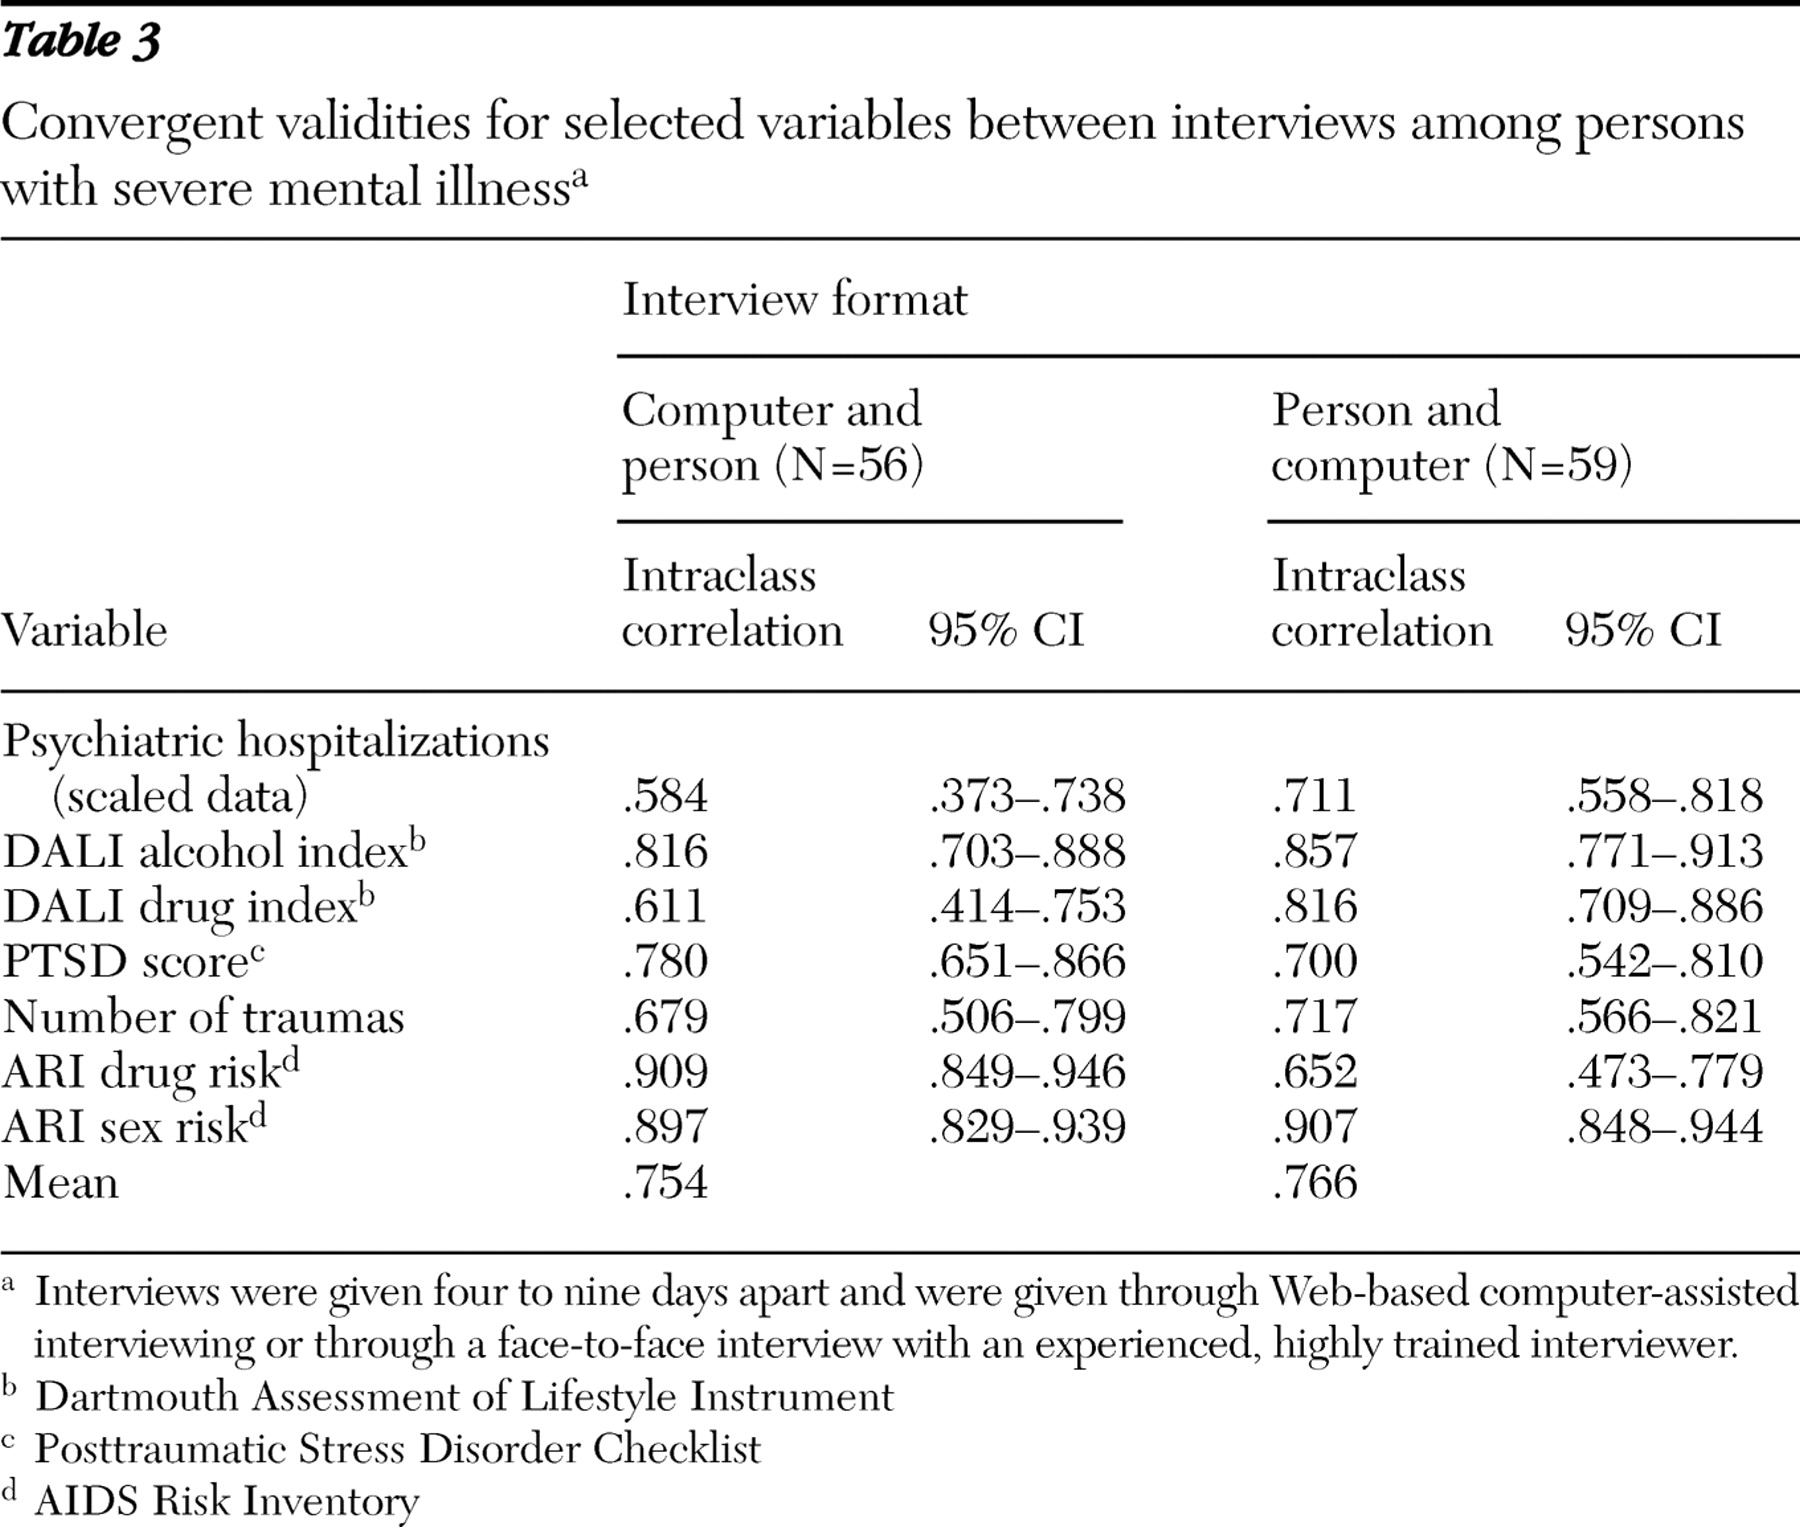
Reliability and validity. We assessed each client twice in order to examine the test-retest reliability of each format and the amount of agreement between the two formats (convergent validity). We calculated these scores by extracting one individual question (number of psychiatric hospitalizations) and six composite scores: total number of reported traumas, summed PTSD score from the PCL, alcohol abuse and other drug abuse scores from the DALI, and the drug risk score and the sex risk score from the ARI. The test-retest data on those seven measures are presented in
Table 2, and the convergent validities are in
Table 3 .
Intraclass correlations were used in all cases. The average test-retest reliability was similar for the two formats. Reliability scores for the respondents were in the acceptable range, and the confidence limits for the two different formats overlapped for every measure. For the PCL, the test-retest reliabilities were comparable to those obtained from younger individuals without a history of severe mental illness (
37 ). The reliabilities on individual measures exhibited moderate variability. The average intraclass correlation between the two formats was .76. We would expect the correlation between formats on average to be lower than the test-retest reliability scores within format.
Criterion validity. For PTSD, number of hospitalizations, and risk for blood-borne infections, we utilized criterion measures to assess the relationship of format on validity.
The CAPS, conducted by an expert clinician blind to client group assignment, served as the criterion measure for the PCL. We used the PCL from the first interview. We computed the correspondence between the PCL and the CAPS in two fashions: an intraclass correlation of total score derived from each instrument and a percentage agreement on final diagnosis. CAPS total score was significantly correlated with both the score on the computer-administered PCL (N=23, intraclass r=.878; F=15.38, df=22 and 22, p<.001) and the score on the interviewer-administered PCL (N=35, intraclass r=.654; F=4.78, df= 34 and 34, p<.001).
Forty-eight percent of the subgroup of clients (28 of 58 clients) were diagnosed as having PTSD on the CAPS. When the CAPS was used as the criterion, the computer-administered PCL had 92% sensitivity (11 of 12 clients) and 90% specificity (9 of 10 clients). The interviewer-administered PCL had 75% sensitivity (12 of 16 clients) and 79% specificity (15 of 19 clients).
Hospital records served as a criterion measure for number of hospitalizations. Client report using the computer correlated .68 with hospital records. Client report in the trained-interviewer format correlated .80. The differences between formats did not approach significance. Number of hospitalizations was graded on a 4-point scale. There was an exact match on 67% of the computer responses and 72% of the face-to-face responses.
The ARI assesses the risk of acquiring a blood-borne infection. As a criterion measure, we collected a blood sample from each client and had that blood analyzed for the presence of HIV, hepatitis B, and hepatitis C. Thirty-six clients had one or more infections. To see how well the ARI predicted infection by format, we first computed the overall risk score and subsequently carried out t tests between clients with and without an infection by using the risk score as a dependent measure. We carried out the test separately for each format. Using a computer, clients with an infection had higher risk scores than clients without (.20 versus .12), a significant difference (t=2.61, df=107, p=.01). Using trained interviewers, there was no significant difference in risk scores between the two client groups (.16 versus .15).
Disclosure of sensitive information. We hypothesized that clients would disclose more stigmatized behavior in the computer format. To test this prediction we constructed two disclosure indices chosen from the DALI and the ARI: one for drug items and one for sex items. Clients responding to an interviewer had higher scores on the drug index than clients responding to the computer (2.22 versus 1.58) (t=2.01, df=228, p=.046). Clients responding to an interviewer also had higher scores on the sex index than clients responding to the computer (2.21 versus 1.72) (t=2.49, df=229, p=.014). Contrary to our hypothesis, clients reported higher numbers of illegal and stigmatized events to trained interviewers than to the computers.
Cost and time. The estimated cost per interview using trained interviewers was approximately $90 per interview, which included interviewer salaries, data editing costs, and data entry costs. At the time of the study, CAI costs included approximately $12,500 for computer hardware, $1,000 for software, and $3,000 for programmer time, an average of about $47 per interview. There were personnel costs associated with the computer interviewing. A staff person had to be available to log the client in and answer any questions, but the cost per interview was hard to estimate, because these people were engaged in other tasks during the interview. That staff person would have to be sufficiently computer literate to deal with the occasional computer failure or network outage. The initial capital costs of computing are independent of the number interviewed. The cost per interview drops as the number interviewed increases. The computer interviews entailed some cost savings compared with trained interviewer administration, and those savings increase for larger projects.
We measured the time from when the client began the interview until he or she completed it. On the first interview, clients responding to a computer spent slightly more time than they did on the second interview, but the difference did not approach significance (22.31 minutes versus 21.53 minutes). There was no significant difference in the number or duration of breaks as a function of format. The CAI data were available more quickly for analysis. Face-to-face interviews often required days or even weeks between completion and delivery for data editing and entry. The computer interviews were available in the database upon completion of the interview.
Satisfaction and preference. Of the 53 clients who experienced only the computer, 51 (96%) responded that they "liked it." Of the 65 clients who experienced only the face-to-face interview, 61 of the 64 clients who responded (95%) liked it (no significant difference). We asked the 115 clients who had experienced both formats which format they would prefer in the future. Of those clients, 49 (43%) said they would prefer the computer, 43 (37%) said they would prefer a person, and 23 (20%) said they had no preference. Age was the only patient variable that was significantly related to preference. The clients who preferred the computer averaged 40.3 years of age and the clients who preferred a face-to-face interview averaged 48.2 years (t=3.33, df=84, p=.001). There may be variables other than the ones we collected, such as education level, that would predict satisfaction.


