Involuntary treatment of individuals with severe mental illness provokes much ethical and legal debate and imposes a substantial financial burden on the public mental health system (
1,
2 ). This treatment typically takes one of two forms. The first, known as an involuntary psychiatric hold, allows a qualified physician or police officer to confine a person in a hospital for up to 72 hours if he or she poses a danger to him- or herself or others, if the person appears to be gravely disabled, or both. The second form of involuntary treatment involves the extension of 72-hour holds for up to an additional 14 days for individuals who continue to meet the involuntary hold criteria and cannot receive treatment at a less restrictive level of care. Individuals with severe mental illness who are homeless, suffering from a co-occurring substance use disorder, or both are overrepresented in the population that receives care via these involuntary services (
3 ).
The research literature indicates that the incidence of involuntary treatment among persons with severe mental illness may gauge the functioning of the public mental health system (
4 ). Researchers have argued that preventive measures, early-intervention crisis resolution services, as well as timely and appropriate outpatient care could prevent a significant proportion of involuntary commitments (
5,
6 ). This prevention could arise, for example, from proactive strategies that reduce barriers to access and encourage persons with severe mental illness to use lower-cost community treatment and case management programs.
In November 2004, California voters approved the ballot measure Proposition 63, the Mental Health Services Act (MHSA), to expand public mental health funding and services in all counties. This historic legislation levies a 1% tax on annual adjusted gross incomes over $1 million. The MHSA specifies that these new funds cannot supplant existing mental health services and should provide new services or expand services to individuals with severe mental illness or serious emotional disturbances (
7 ). The MHSA intends county-run mental health programs to provide culturally competent, client-driven, integrated services to support persons with severe mental illness in attaining their recovery goals.
California allocated a majority of MHSA funds to counties on the basis of a formula that incorporated population size, proportion of households with incomes below 200% of the poverty threshold, the size of the population without health insurance, and the prevalence of mental illness. The results of this formula were adjusted to account for existing resources available in each county (
8 ). As of the end of fiscal year (FY) 2006–2007 (June 30, 2007), approximately $647.7 million had been distributed under the MHSA to augment county mental health programs (
9 ). For most counties, these funds represented an approximate 10% increase in mental health budgets (
10 ).
Consistent with the notion that the MHSA may increase access to and improve the quality of effective comprehensive services and supports for individuals with severe mental illness, we hypothesized that the monthly incidence of involuntary civil commitments in California would decline after the enactment of MHSA. We examined involuntary 72-hour and 14-day holds as indicators of changes in the system of care catalyzed by MHSA funds. Discovered support for the hypothesis may indicate that county mental health programs in California increased access for persons with severe mental illness to less restrictive, lower-cost treatment and case management programs. Results also may hold policy implications for developing strategies to reduce the overall demand for crisis treatment in public mental health care.
Methods
Variables and data
We obtained data on involuntary treatments from the State of California Department of Mental Health (DMH) ("Quarterly Reports in Involuntary Detentions, July 2000–June 2007," personal communication with DMH Mar 10, 2010). California requires each county mental health department to report counts of involuntary 72-hour and 14-day holds. The California Welfare and Institutions Code, Section 5150, allows a qualified officer (police officer, for example) or clinician to involuntarily confine a person with a suspected mental disorder who appears to be a danger to him- or herself or others, is gravely disabled, or both (
11 ). Involuntary confinement under a 5150 hold can continue for up to 72 hours, at which point a psychiatrist or psychologist must assess the individual to determine whether continued confinement is warranted. Persons deemed unfit for release then enter up to 14 days of additional confinement, as specified in Section 5250 of the California Welfare and Institutions Code (
12 ). Only persons confined under Section 5150 may then enter 14-day confinement under Section 5250. For brevity, we refer to 72-hour holds as 5150s and to 14-day intensive treatments as 5250s.
DMH provided us with 28 quarterly counts of 5150s and 5250s, by county, from FY 2000–2001 to the end of FY 2006–2007. We used deidentified, aggregate-level data; therefore, informed consent was not required. These data comprised the longest series with consistent collection and reporting methodology available to us at the time of our study. DMH performs a quality check of the county data to ensure the completeness of reporting. If DMH discovers any errors, it returns the data to the responsible county and requests corrections.
The first quarter of the fiscal year runs from July 1 through September 30, and the fourth quarter runs from April 1 through June 30. We excluded from the analysis counties with more than three consecutive missing quarters of data. This process left us with data on the following 28 counties: Alameda, Butte, Contra Costa, El Dorado, Fresno, Humboldt, Kern, Marin, Merced, Orange, Riverside, Sacramento, San Bernardino, San Diego, San Francisco, San Joaquin, San Luis Obispo, San Mateo, Santa Barbara, Santa Clara, Santa Cruz, Solano, Sonoma, Stanislaus, Ventura, Yolo, and Sutter-Yuba. According to the 2000 U.S. census, these counties comprise more than 22 million persons, or 65% of California's population (
13 ). These counties, moreover, represent a diverse cross-section of California; that is, they include ethnically diverse populations in rural and urban, as well as coastal and interior, settings.
We discovered missing values in the quarterly counts for the 28 counties. We therefore imputed missing quarterly values for 5150s (ten total, or 1.3% of data) and 5250s (16 total, or 2.1% of data) by inserting the mean quarterly value for that fiscal year.
By October 2006, all 28 counties in the analysis had received MHSA funding, although the date of funding approval varied (range January–October 2006). We classified the MHSA variable as a separate binary indicator for each county, coded as 1 for the first full quarter after which the county received approval for MHSA funds and thereafter. Before this quarter, we coded MHSA funding as 0.
Analysis
Support for our hypothesis turned on whether the incidence of involuntary psychiatric services fell below expected levels after the disbursement of MHSA funds. We tested our hypothesis using a standard panel regression technique recommended in the health economics literature (
14 ).
We first inserted the independent variable (MHSA) into the regression equation. Because counties received MHSA funds at slightly different times, we specified the MHSA variable to reflect that the timing of disbursement varied by county (for example, disbursement occurred in the first quarter of 2007 for San Joaquin County, whereas disbursement occurred in the second quarter of 2006 for San Francisco County). This approach took advantage of temporal differences in MHSA fund disbursement, thereby minimizing the likelihood that statewide changes in involuntary civil commitments would confound our estimates.
Next, we included as a control variable each county's unemployment rate. The incidence of involuntary psychiatric treatment reportedly increases when the regional economy declines (
4 ). This observation appears consistent with individual-level research of increased antisocial behavior and alcohol abuse after job loss, as well as elevated fear among the population that remains working during unexpected rises in unemployment (
15 ). Failure to account for economic change could bias our test if sudden increases in unemployment coincided with the disbursement of MHSA funds. We therefore included as a control variable the quarterly unemployment rate for the 28 counties analyzed (
16 ). The unemployment rate gauges the extent to which regional economies stagnate or contract. The U.S. Bureau of Labor Statistics, our source for unemployment data, defines the unemployment rate as the percentage of the labor force looking for but not having a job (
17 ).
We endeavored to remove other potential sources of confounding bias by using a fixed-effect specification. Omitted county-level variables that were relatively stable over the short term may bias effect estimates if correlated with reductions in reported 5150s and 5250s after the disbursement of MHSA funds. These variables could include, for example, political climate or data collection procedures. To minimize this potential bias, we included county fixed effects, which controlled for all time-invariant omitted factors at the county level. This approach permitted estimates of the effect of a change in the independent variable (such as allocation of MHSA funds) on a change in involuntary psychiatric services.
We then included quarter-year fixed effects, which controlled for bias that may have resulted from the omission of time-varying factors across all counties. We also added county-specific linear and quadratic time trend variables. This extended model specification minimized bias associated with county-level patterns of 5150s and 5250s during the study period. In addition, we controlled for other time patterns in the dependent variable by using panel autocorrelation removal routines recommended in the literature (
18,
19 ).
We controlled for differences in error terms across counties by specifying panel-corrected standard error adjustment (
20 ). California counties differ dramatically in population size. Given the differences in population size, we weighted our analyses by population counts derived from the U.S. census (
21 ). We also tested the possibility that changes in the count of involuntary commitments occurred roughly in proportion to population size by specifying per capita dependent variables (that is, 5150s or 5250s per 100,000 persons).
Results
5150s
Over the test period, the 28 counties reported a total of 593,751 involuntary 72-hour holds. Alameda County reported the most 5150s, whereas Sutter-Yuba reported the fewest.
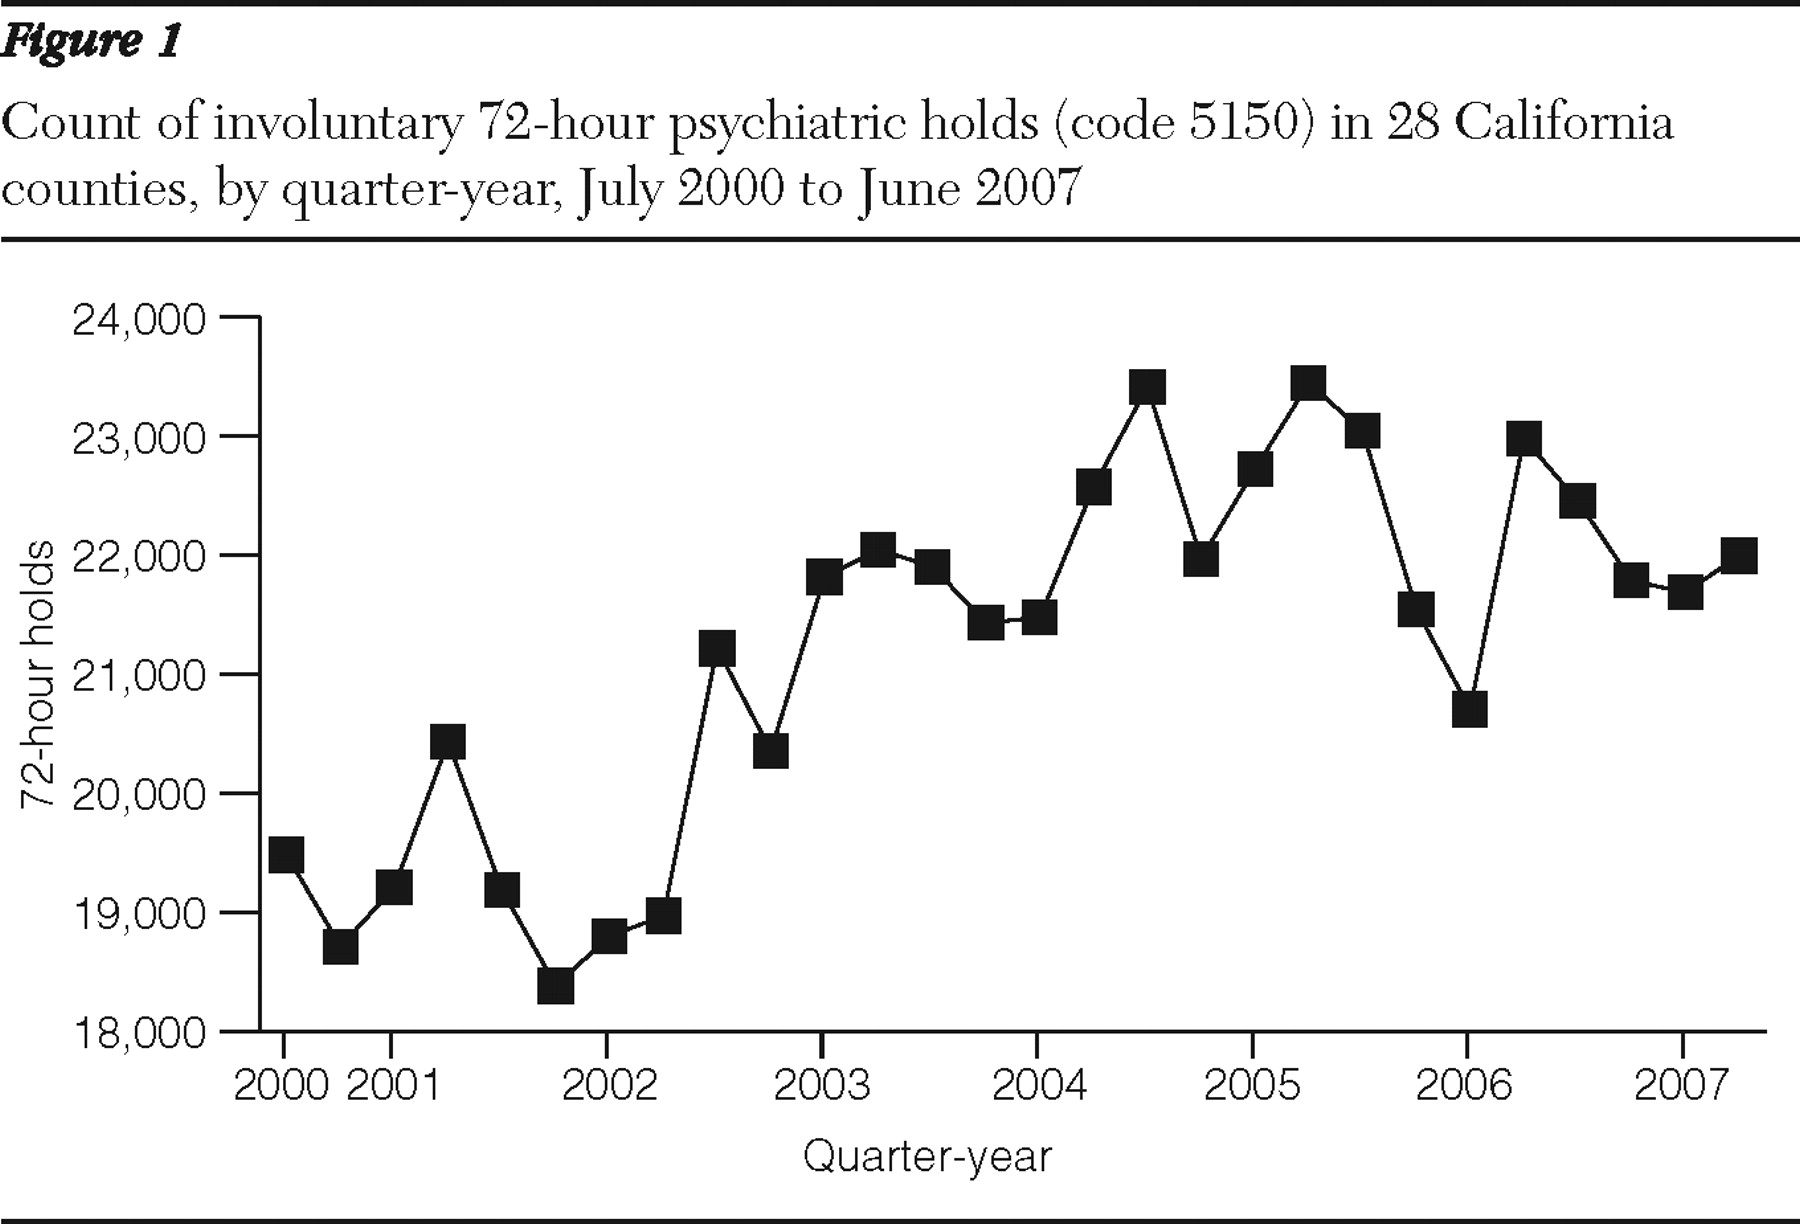
Figure 1 shows the aggregate quarterly counts over time of 5150s. The plot shows a seasonal pattern such that 5150s were typically the highest in the April–June quarter.
Diagnosis of the residual error term after removal of county and quarter-year fixed effects revealed several outlying quarterly counts of 5150s. These outliers may reflect county-specific errors and incomplete data not detected by state DMH audits or real rises or declines in involuntary treatment. Outliers may distort the estimate of the MHSA coefficient by inflating the standard error of the panel series, thereby increasing the likelihood of a type II error. To address this concern, we performed outlier detection and removal routines (
22,
23 ) before testing the effect of MHSA on 5150s.
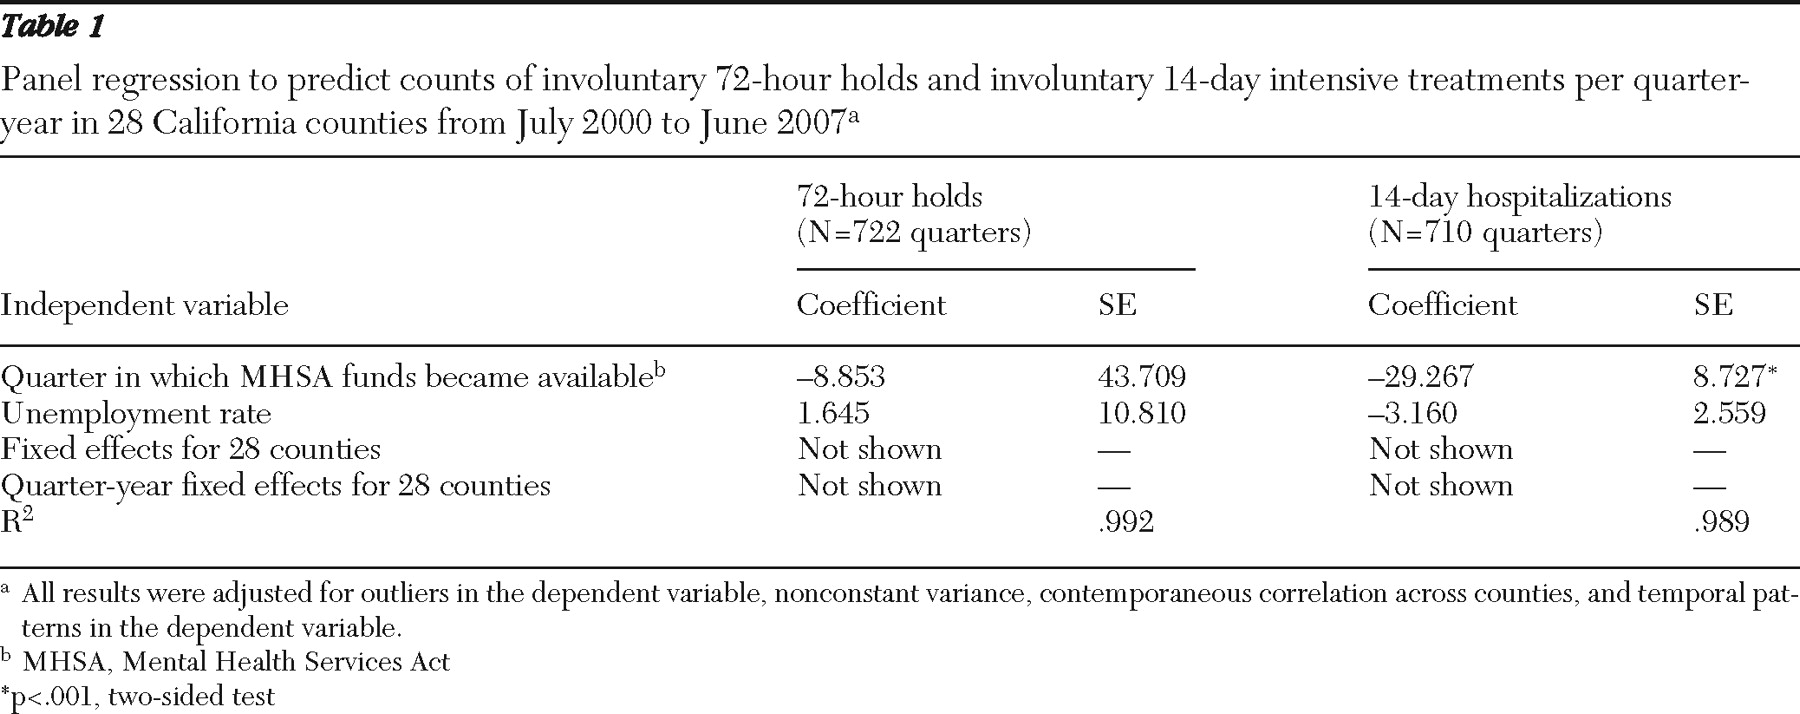
Table 1 shows the results of the panel regression in which we included the MHSA variable, the unemployment rate, county and quarter-year fixed effects, and county time trends. Results did not support the hypothesis of fewer 5150s after MHSA disbursement in that the 95% confidence interval (that is, -94.52 to 76.81) for the MHSA coefficient included 0. The alternative per capita specification of 5150s, which held that a response to MHSA funds would occur in proportion to county population size, yielded similar results (available on request).
We conducted two additional sensitivity analyses to assess whether imputation of missing values of 5150s or removal of outliers in 5150s would change the MHSA coefficient. Findings appeared consistent with the original test; we observed no relationship between MHSA funds and 5150s (results available on request).
5250s
From FY 2000–2001 to FY 2006–2007, the test counties reported 202,554 involuntary 14-day intensive treatments (approximately 268 per county-quarter). As with the 5150s, Alameda County reported the most 5250s, whereas Sutter-Yuba reported the fewest.
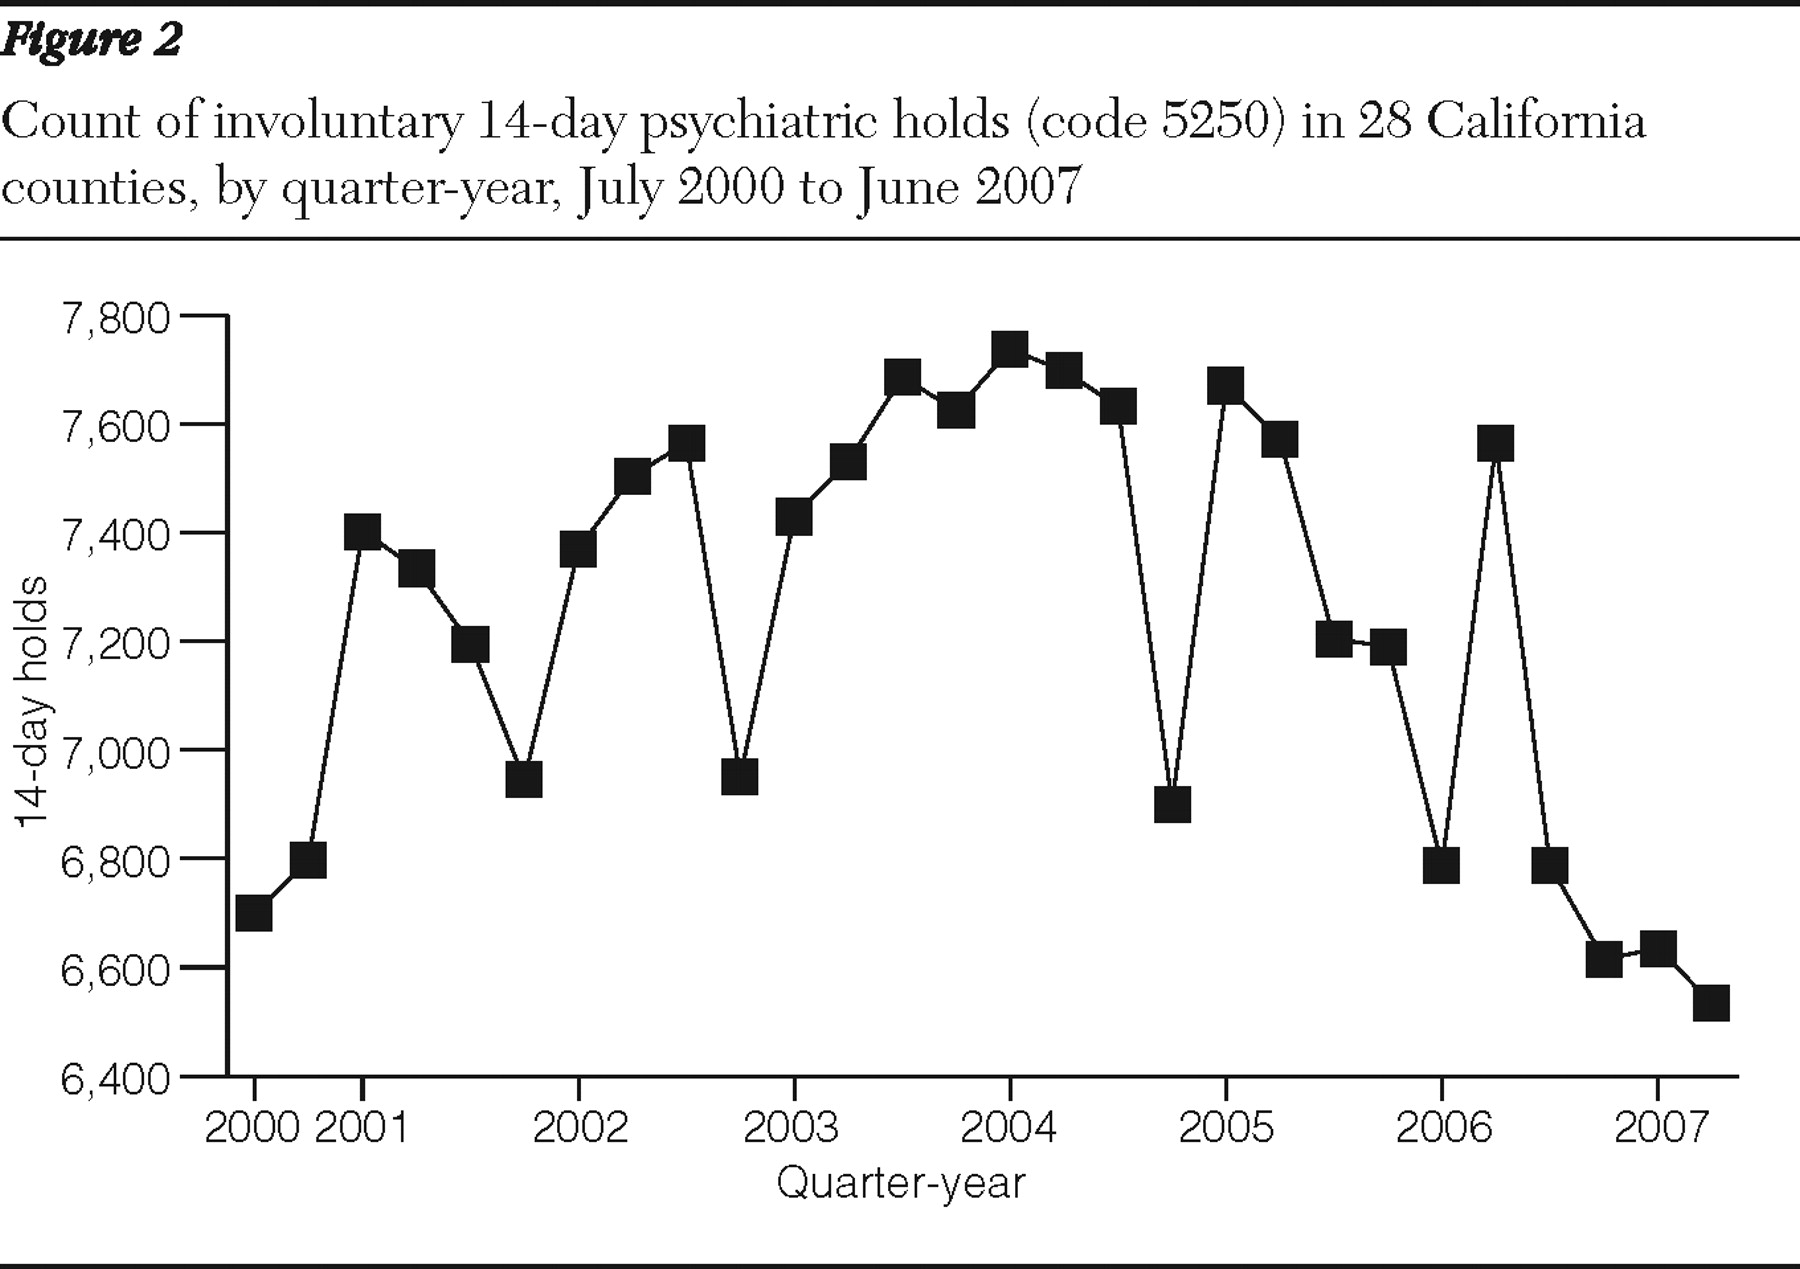
Figure 2 shows the aggregate counts of 5250s over time, indicating a decline in FY 2006–2007. These counts were often highest in the January–March quarter.
We performed the same outlier detection and removal routines on 5250s as we did with 5150s because we discovered several outlying values after inclusion of county and quarter-year fixed effects.
Table 1 shows the final estimation results. The MHSA coefficient was negative and statistically significant (coefficient=-29.267, p<.001), which supported our hypothesis. Findings from the alternative 5250s per capita model, in which a response to MHSA funds occurred in proportion to county population size, also supported the hypothesis. The coefficient for MHSA, moreover, did not appear sensitive to additional specifications in which we preserved missing values of 5250s or retained outliers in 5250s (results available on request).
To provide an estimate of the magnitude of the coefficient, we calculated the number of 5250s statistically averted by the disbursement of MHSA funds. In the 105 county-quarters after MHSA disbursement, we observed 27,269 instances of 5250s. Multiplying the coefficient (-29.267) for MHSA in
Table 1 by the 105 county-quarters implied a reduction of 3,073 cases, or approximately 10% fewer 5250s than expected.
To ensure that our findings on the relationship between MHSA and involuntary admissions were not sensitive to different estimation methods, we repeated the analysis with a time-series methodology frequently used in the psychiatric epidemiology literature (
24,
25 ). Involuntary commitments from 2000 to 2007 may exhibit a trend, a tendency for values to remain elevated or depressed, or an oscillation after high or low values. This autocorrelation could complicate our test if, for example, 5150s and 5250s exhibited seasonality, such that the expected value in late 2006 and 2007 did not equal the mean of the previous years. To control for this potential confounding by time, we used autoregressive, integrated, moving-average time-series routines. These routines, derived by Box and colleagues (
26 ), empirically identified and removed autocorrelation from all 28 counties before the effect of MHSA on involuntary psychiatric services was tested. This approach minimized the possibility that results arose from temporal patterning in involuntary psychiatric services that coincided with the disbursement of MHSA funds.
We proceeded with the time-series approach and included county fixed effects to control for county differences in involuntary commitments. Findings from the time-series analyses confirmed initial results. In the 5150 test, the MHSA coefficient did not statistically differ from 0. In the 5250 test, however, the MHSA coefficient fell below its expected value, indicating a statistically significant drop in 5250s after the disbursement of MHSA funds (results available on request).
Discussion
We tested the hypothesis that the incidence of involuntary civil commitments, one key indicator of the overall functioning of the system of mental health care, would decline after the disbursement of MHSA funds. Findings offered mixed support for the hypothesis, in that involuntary 14-day extended treatments (5250s), but not involuntary 72-hour holds (5150s), fell below expected values after disbursement of MHSA funds in the 28 counties for which we had data. Results indicate that the structure and funding of the MHSA may have provided enhanced resources and diverted clients to less restrictive treatment settings.
We expect that future analysis, after MHSA has been in place for several more years, may demonstrate even larger effects than the 10% decline in 5250s shown in this study. Total expenditures for MHSA as of FY 2006–2007 were $647.7 million. This total, however, has grown to approximately $3.2 billion as of FY 2008–2009 (
27 ).
California's MHSA represents landmark legislation that has significantly expanded the availability and range of mental health services (
10 ). The structure of MHSA provides the opportunity for counties to use innovative approaches to transform mental health care. Beginning in FY 2005–2006, California distributed MHSA funds with the stipulation that counties allocate at least 51% of the funds to address new and expanded services through full-service partnerships (FSPs) (
10 ). These partnerships, which focus on modified community treatment, wraparound service models, and a recovery framework, serve clients with disproportionately high levels of need (
28 ). The goal of allocating MHSA funds to clients with high levels of need adheres to the principle of targeting resources so that they accrue the greatest societal and health benefits (
29 ). This circumstance supports the plausibility that the expansion of treatment services (such as therapy and rehabilitation or case management) among high-risk clients may have reduced the likelihood of 5250s.
In general, only persons first placed on a 72-hour involuntary hold (5150) qualify for involuntary 14-day intensive treatment (5250). For this reason, we did not expect that the incidence of 5250s would fall after disbursement of MHSA funds if 5150s remained at expected levels. We offer a post hoc explanation for this finding. MHSA funds may not have affected the population-level incidence of disorder or behavior deemed as dangerous. The funds, however, may have provided clinicians with care settings that were viable alternatives to 14-day locked inpatient settings when planning to discharge individuals after a 5150 hold. Given the availability of reinvigorated or novel outpatient treatment settings as a result of MHSA funding, psychiatrists, psychologists, and FSP teams may have experienced increased access to an expanded range of community-based resources. Such an increase in access to less restrictive treatment alternatives may have reduced the necessity of continued inpatient stay on a 5250 commitment. We encourage further analyses to determine whether a shift in clinicians' referral patterns and discharge planning accounts for the decline in 5250s after MHSA.
Although we know of no research that has investigated the association of emergency inpatient commitment with an increase in funds for community mental health services, a recent report found that after an increase in funding, New York experienced a rise in utilization of outpatient, community-based treatment (
30,
31 ). New York witnessed from 1999 to 2005 an increased demand for intensive case management (reimbursable by Medicaid) after the concurrent enactment of Kendra's Law and the appropriation of funds for mental health services. This case appears consistent with the notion that the use of community inpatient services in California may have increased and that the use of involuntary services may have declined after the disbursement of MHSA funds. We note, however, that the literature documents important differences between states regarding trends in the use of involuntary commitment (
32,
33,
34,
35 ).
Strengths of our study include the examination of all counties in California with complete data over the test period. Results therefore pertain to mental health systems that provide care for an ethnically and geographically diverse population of over 22 million persons. Our analytical approach also ruled out the rival explanation that temporal patterns in involuntary treatment "scheduled" low values coincident with the disbursement of MHSA funds. Moreover, we controlled for the performance of the regional economy, which has previously been reported to affect the incidence of involuntary treatment.
Limitations of analyses such as ours include that results cannot shed light on the effectiveness of any specific county mental health system. The coefficients in our table represent the average effect (across 28 counties) of MHSA funds on involuntary treatment. Insufficient statistical power did not permit a county-specific analysis. Our methods also cannot rule out the possibility that unmeasured and unpatterned county-level factors that coincided with the disbursement of MHSA funds (but were not caused by them) may have accounted for the findings. In addition, lack of individual-level, clinical information precluded an exploration of potential factors in the reduced filing of 5250s after the disbursement of MHSA funds. Moreover, we did not have information on mandated treatment in the community and therefore could not test whether the use of this treatment modality rose or fell after MHSA disbursement (
36 ). We expect that further research will address these important issues.
One rival hypothesis that may limit our conclusions involves a circumstance in which state-level changes in 2006 unrelated to the MHSA reduced the reported prevalence of involuntary holds. We attempted to rule out this rival in three ways. First, our analytic strategy capitalized on county-specific differences in the timing of the disbursement of MHSA funds and included controls for ambient factors (such as unemployment rate) that reportedly affect involuntary holds. Second, we contacted DMH to ensure that no shifts in data reporting and collection procedures were observed over the test period. DMH confirmed consistency in these procedures. Third, we met with over 20 county mental health directors to discuss whether state laws or policies other than the MHSA may have affected referral patterns for involuntary mental health services. None of the county mental health directors mentioned such a change.
Conclusions
California counties' continued ability to receive funds from the MHSA faces a precarious future. A $21 billion state budget shortfall has led to increasing pressure to redirect MHSA funds to other public services (
37 ). One argument in support of sustaining MHSA funds would involve demonstrated effectiveness of the counties' improved management and treatment of persons with severe mental illness. Our finding that involuntary 14-day psychiatric commitments declined in the year after disbursement of MHSA funds indicates a slight increase in effectiveness. We await subsequent research on other outcomes of the mental health care system (including recovery and rehabilitation as well as emergency visits) to evaluate the health, economic, and societal value of enacting the MHSA.
Acknowledgments and disclosures
This study was supported by contract 08-78106-000 from the California Department of Mental Health. The authors gratefully acknowledge Marti Johnson, M.A., Tom Wilson, M.A., and Bryan Fisher, B.A., at the California Department of Mental Health for providing the data and assisting with its interpretation. The authors also thank Ralph Catalano, Ph.D., for advice regarding the analytic methodology.
The authors report no competing interests.


