Programs
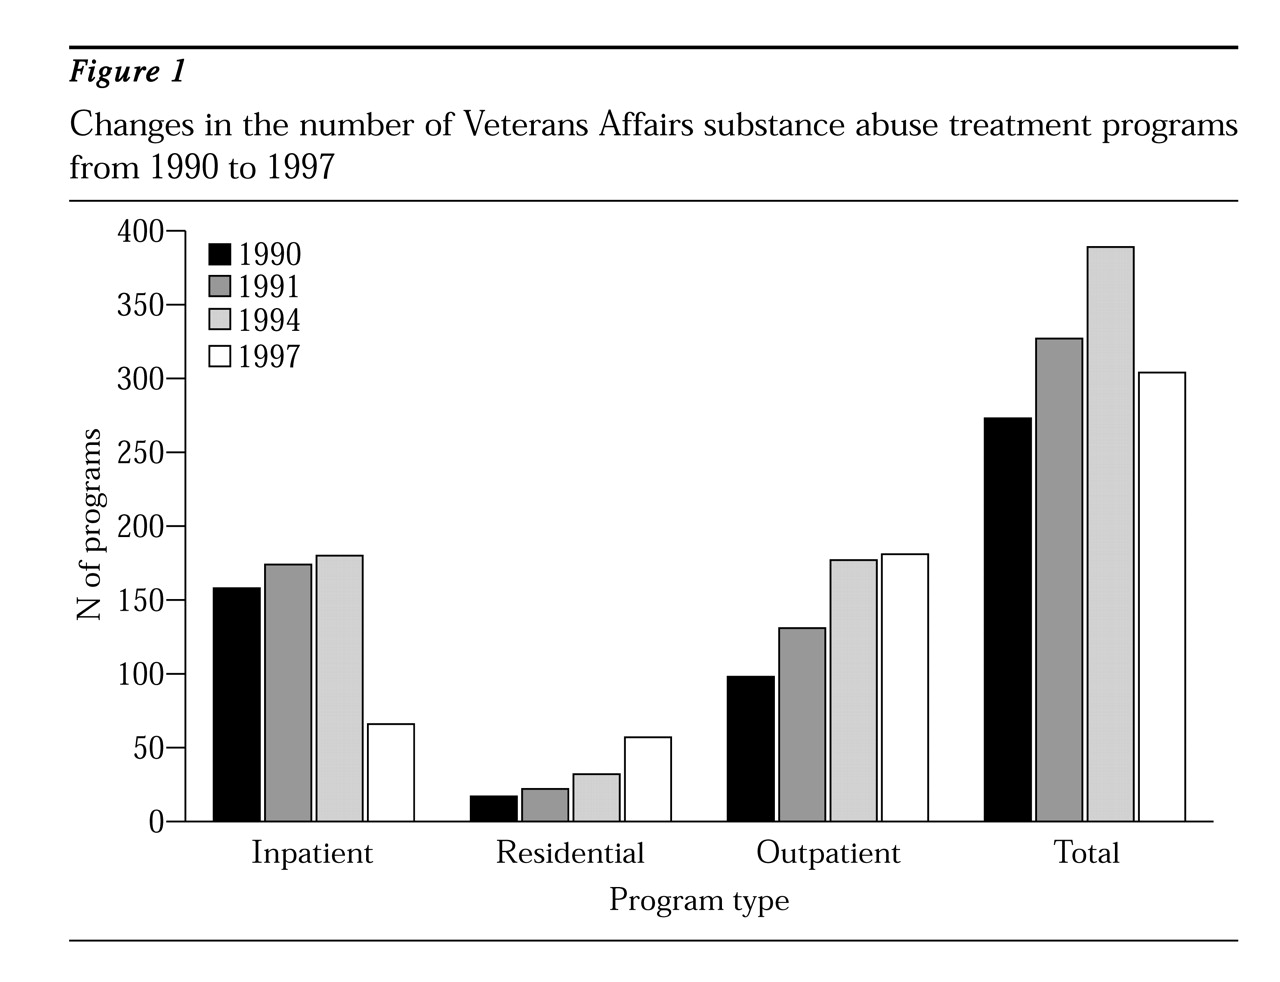
Figure 1 presents data on VA substance abuse treatment programs for survey years 1990 to 1997. The number of programs increased steadily from 1990 to 1994 due to a $100 million substance abuse programming enhancement initiative developed and implemented by the U.S. Congress, the Department of Veterans Affairs, and the Office of National Drug Control Policy (
5). From 1990 to 1994 the total number of programs grew from 273 to 389, an increase of 42.5 percent. Outpatient programs had the greatest growth rate, 80.6 percent, an increase of 98 to 177 programs. However, the system's growth was halted in 1995 by decentralization and also by pressure to reduce the size of government after the 1994 congressional elections (
5). From 1994 to 1997, the number of programs declined by 22 percent, from 389 to 304.
When managed care principles have been introduced in other public mental health and substance abuse systems, the most notable effect has been a decline in inpatient services (
1,
2,
3,
4,
5,
6). The 63 percent decrease in VA inpatient programs from 1994 to 1997 is the most remarkable change attributable to decentralization and the mandate to convert from hospital-based to outpatient-based services. Most of the inpatient programs that survived were focused on treating substance abuse patients who had comorbid psychiatric conditions.
Due to the closure of inpatient programs, inpatient beds decreased from 5,920 in 1994 to 2,960 in 1997, a 50 percent decrease. The loss of inpatient capacity was partly offset by an increase in the number of residential programs, from 32 to 57 (78 percent), and by a concomitant increase in residential beds, from 1,190 to 1,750 (47.1 percent).
The average length of stay for both inpatient and residential programs decreased between 1994 and 1997. The average length of stay in inpatient programs decreased from 24 to 20 days, and in residential programs it decreased from 110 to 65 days. The average number of annual admissions to inpatient programs decreased 25 percent from 1994 to 1997, whereas the average number of admissions to residential programs increased 77 percent over the same period.
Despite the growth in residential programs, the proportion of residential programs that had patients on waiting lists for treatment on the last day of the fiscal year increased from 58 percent in 1994 to 74 percent in 1997. The proportion of inpatient programs with patients waiting for care stayed constant and high at 68 percent.
Figure 1 shows a steady increase in the number of outpatient programs from 1990 to 1994. Although the growth in the number of outpatient programs virtually stopped after 1994, the intensity of outpatient services continued to expand. In 1994 only 11 percent of VA outpatient programs provided four or more hours of care per treatment day to the average patient—for example, in day hospitals and intensive outpatient programs. By 1997 a total of 48 percent of VA outpatient programs met this standard. It appears that while networks exercised their mandate to reduce inpatient services, they frequently converted inpatient programs to day hospitals rather than eliminating them outright. Thus from 1994 to 1997, the number of outpatient programs classified as intensive increased 347 percent, from 19 to 85 programs.
Consistent with the growth in programs, systemwide staffing grew from 4,147 full-time-equivalent (FTE) employees in 1991 to 4,733 in 1994. By 1997 the number had declined to 3,326 FTE employees. The proportion of staff working in outpatient programs increased from 23 percent of all FTE employees in 1994 to 41 percent of all FTE employees in 1997. The only notable shift in type of staff was an increase in the proportion of nursing staff from 1994 to 1997—especially in intensive outpatient programs, with a 10 percent increase, and in residential programs, with a 16 percent increase.
Patients
Throughout the 1990s VA substance abuse patients have experienced a steady increase in the severity of their clinical and social problems. For example, from 1990 to 1997 the proportion of patients who were married or in a marriage-like relationship declined from 48 percent to 32 percent in inpatient programs, from 39 percent to 23 percent in residential programs, and from 55 percent to 36 percent in outpatient programs.
Similarly, from 1991 to 1997 the proportion of patients with a comorbid psychiatric diagnosis increased among patients in inpatient programs from 30 percent to 47 percent, in residential programs from 26 percent to 33 percent, and in outpatient programs from 32 percent to 42 percent.
This increase in social isolation and psychiatric problems appears to have been steady throughout the various policy trends in services. Several factors outside of treatment systems themselves seem to be contributing to increases in the problems of patients in public-sector substance abuse treatment programs, raising the issue of whether a rapidly changing service system will be able to respond to the needs of an increasingly troubled patient population.


