Most studies of public capitated mental health have shown expenditure reductions in managed care models compared with traditional fee-for-service models (
2–
6). Savings are usually achieved through radical reduction in the utilization of high-cost services, especially inpatient hospitalizations (
2,
3,
7,
8). The general consensus from the research literature is that states not only realize significant reductions in expenditures, but they also increase outpatient community support programs (
2,
3,
5,
6,
9,
10).
Longitudinal studies in California, Massachusetts, Pennsylvania, and Utah showed substantial cost savings initially, with decreasing rates of reduction in costs thereafter (
10,
11). In a two-year study in Rochester, New York, capitation resulted in reduced costs, but the rate of savings decreased over time—that is, by 14% at year one and by 8% at year two (
11). In California a capitated assertive community treatment program resulted in a reduction of $12,000 per consumer initially and $8,000 per consumer by the fourth year postcapitation, compared with costs for mental health services in a fee-for-service program (
5).
Expected differences in response to financial incentives of not-for-profit versus for-profit ownership on services production—in general and under capitation—have been a focal issue in health services research, especially for hospitals, health maintenance organizations, and long-term care (
12–
17). In general, for-profit organizations focus on reducing the cost of services by using treatments that are less expensive and may restrict access to care (
15). Focusing on persons with serious mental illness, Bloom and colleagues (
4) explored expected differences in the first two years' experience of Colorado's capitated payment system for Medicaid mental health services. In this study, the not-for-profit programs initially had a lower probability of inpatient use and a higher probability of outpatient use than the for-profit programs, while consumers in the for-profit programs had the highest likelihood of initial inpatient use. The not-for-profit model resulted in a 20% reduction in the cost per person by the second postcapitation year, with no change in cost per service user. However, the for-profit model demonstrated a 66% reduction in the cost per person by the second postcapitation year, with a 58% reduction in cost per service user. No differences were found in the quality of services provided between the two types of models (
18). Thus our overall hypothesis was that compared with the precapitation year, reductions in cost will continue to be realized for each of the five postcapitation years.
The objective of the study presented here was to also assess longer-term differences between for-profit and not-for-profit programs when a uniform capitation policy was implemented within community mental health centers (CMHCs). According to economic theory, the underpinning of corporation-owned entities is to provide value to their owners and shareholders, whereas not-for-profit organizations are expected to provide value to their constituency, the community (
16,
19). Consistent with evidence from the empirical literature, our first prediction was that compared with the fee-for-service model, capitated financing would reduce high-cost services, typically inpatient hospitalization (
11).
There is limited empirical evidence of the effects of ownership (for-profit versus not-for-profit programs). Previous studies examined hospitals, health maintenance organizations, and long-term care facilities (
14–
17). Most scholars agree that for-profit programs are more cost-efficient than public not-for-profit ones because the former have stronger financial incentives to minimize production costs and respond to consumer preferences (
11–
13). An exception is when the not-for-profit programs face greater competition for their services and consumers (
20,
21). Because CMHCs do not face competition from other mental health organizations, our second prediction was that for-profit programs within CMHCs would provide public mental health services at a lower cost (cost minimizing) than not-for-profit programs. The data to test these predictions were from a unique micro data set for the entire state of Colorado over six years: precapitation (1994) through five postcapitation years (1995–1999).
Methods
Characteristics of the study setting
To control Medicaid mental health costs, which had been increasing by up to 17% per year, Colorado instituted a capitated payment system for Medicaid mental health services in selected areas of the state in August and September 1995. Capitation contracts were given to seven geographically based organizations that would bear the full financial risk of providing mental health services to Medicaid beneficiaries residing in their designated areas. The capitation rate covered all mental health services for consumers between 21 and 64 years of age except for the cost of pharmaceuticals and state hospitalizations (
4).
Two different financing systems were employed by the organizations that won the capitation contracts. In the northern part of the state, not-for-profit CMHCs won the contracts; three of the organizations were single CMHCs and the fourth was an alliance of three CMHCs. In this system of care, the CMHCs both managed the care and delivered mental health services to the consumers in their Medicaid program. A for-profit managed behavioral health organization won the bid in the southern areas of the state and formed for-profit joint ventures with the CMHCs to provide services for their Medicaid mental health program and helped them design and manage the care with a single center or, in two cases, an alliance of CMHCs. None were integrated with physical health services. Annually, all programs had to receive the state's approval of their plans to use their savings; for example, savings could be reinvested into the programs to develop new services, hire personnel with stronger credentials, or provide additional training for staff. For-profit programs were limited to 5% profit.
Consumers receiving Medicaid are only one group served by each of the geographically based CMHCs, and they could receive services only through the CMHC in their geographical area. The capitation program in Colorado provided a natural experiment to study the effects of two different Medicaid financing systems (not-for-profit and for-profit programs). The year before the implementation of capitation (1994) was compared with each of five years postcapitation (1995–1999) by using administrative data for all consumers receiving publicly provided mental health services. The unit of analysis is the aggregated data from consumers served by each of the seven organizational units by quarter for each of six years (168 data points). The institutional review board of the University of California, Berkeley, approved the use of these data for the analyses presented here.
The administrative data for the precapitation period (1994) were from the Medicaid billing system, and the data for the postcapitation period (1995–1999) were from a shadow billing system set up and operated by Mental Health Services in Colorado. Both the Medicaid billing system and the shadow billing system have information for each encounter, including patient demographic characteristics, individuals' county of residence, related diagnosis, and service units by provider and service type. Costs for services in the year before the implementation of capitation were imputed by project staff. Because all costs were based on the precapitation year (1994), there was no need to adjust for inflation or deflation. After the implementation of capitation, the state audited the shadow billing on a continuous basis, comparing billing records with medical records. Initial concerns that the organizations might not bill for services because there were no incentives were unfounded. Overall, the data were found to be reliable (
4).
Outcome variables
Three measurements for total mental health service costs in a given organization were calculated. Total service costs were calculated as quarterly treatment costs for all services, including inpatient and outpatient care, by aggregating claims for all individuals receiving any services in a given quarter. Likewise, inpatient service costs and outpatient service costs were calculated separately.
Three measures of mental health service utilization were calculated. Total service utilization was measured as quarterly counts of individuals receiving either inpatient or outpatient services by aggregating all claims in a given quarter. Inpatient and outpatient service utilization were measured separately as well. To more closely examine service utilization, two additional measures were used. Average length of stay per user was calculated as the aggregated length of stay divided by inpatient service utilization in a given quarter and a given entity; length of stay of each claim was determined by using beginning dates and ending dates of each hospitalization episode.
Three measurements of average mental health service costs per user in a given organization were also calculated. The average cost of total service utilization is the total service cost divided by total service utilization for a given quarter. Likewise, average inpatient service costs per user for a given quarter and average outpatient service costs per user for a given quarter were calculated separately.
In order to observe the trends of costs not affected by price inflation, expenditures were standardized for each quarter using the service prices in 1994 (precapitation year). The following processes were used for standardization. First, all services were classified into 15 groups: one group of inpatient services and 14 groups of outpatient services. Second, aggregated service units by service groups in each quarter were calculated by aggregating claims for all individuals receiving services and imputing the unit cost for each service group in a given organization. Third, unit costs by service type were calculated as the aggregated costs for a given service type in 1994 divided by aggregated service units for that service type in 1994. Finally, for each service group in a given organization, postcapitation costs were calculated as aggregated service units multiplied by the fixed unit cost of that entity.
Covariates
All analyses were adjusted for the proportion of service users in each quarter in a specific age range (18–39 years, 40–64 years, and 65 years and older), the proportion of male service users, and the proportion of service users with a specific diagnosis (schizophrenia, depression or dysthymia, bipolar disorder, or other). For patients with multiple diagnoses at the same time, only one diagnosis was used based on the priority order of schizophrenia, depression or dysthymia, bipolar disorder, and other. These covariates may change over time because they are based on the information of service users in each quarter for a given organization.
Analysis
An organizational-level random-effect approach was used to estimate the impact of the two financing systems (not-for-profit and for-profit programs) on mental health service utilization and cost; the analysis adjusted for all the covariates described above. This estimation method was used to correct for heteroskedasticity caused by differences in the size of the organizations and potential autocorrelation resulting from seasonality and repeated measures of each organization.
For all analyses, logged forms of dependent variables were used to account for the skewness of the dependent variable. In addition, the coefficient of the log model allows for comparisons of the percentage of change (reductions expected) in service utilization and cost over the study period. A set of dummy yearly terms (dichotomously coded variables) were included to account for the changes of outcome variables in the not-for-profit programs in each year relative to the precapitation year (1995, 1996, 1997, 1998, and 1999). For example, the dummy indicator for 1995 was coded as “1” for observations in 1995 and “0” otherwise. A dummy indicator for not-for-profit programs versus for-profit programs was included in the model to account for the difference between these two financing systems in the precapitation year. To examine the differences over time between the two different financing systems, a set of interaction terms between for-profit programs and yearly terms were included in the model: 1995 for-profit, 1996 for-profit,… 1999 for-profit; for example, the indicator for 1995 for-profit was coded as “1” for observations that were for the for-profit programs in 1995 and as “0” otherwise. The changes of outcome variables in the for-profit program in each postcapitation year relative to the precapitation year were calculated as the linear combination of coefficients for yearly dummy terms and these interaction terms. Outcome variables were adjusted (in original scale) for each year and each financing system based on model coefficients, the mean values of covariates, and an estimated normal correction factor. All the analyses were conducted using the Stata, version 10, software program (
22).
Results
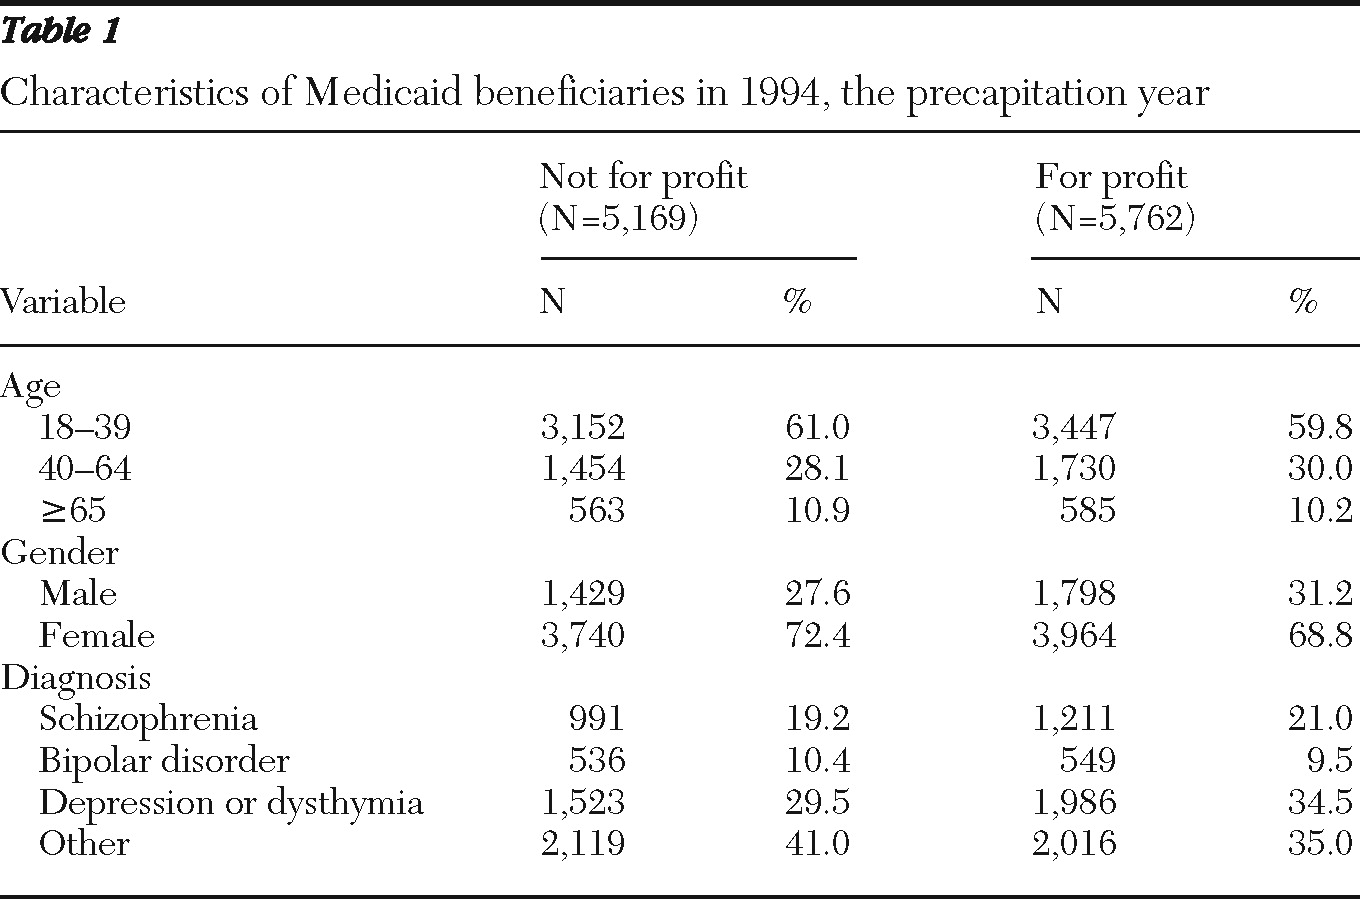
A slightly greater proportion of males, persons aged 40–64 years, and individuals with a diagnosis of schizophrenia or depression were found in for-profit programs than in the not-for-profit programs (
Table 1).
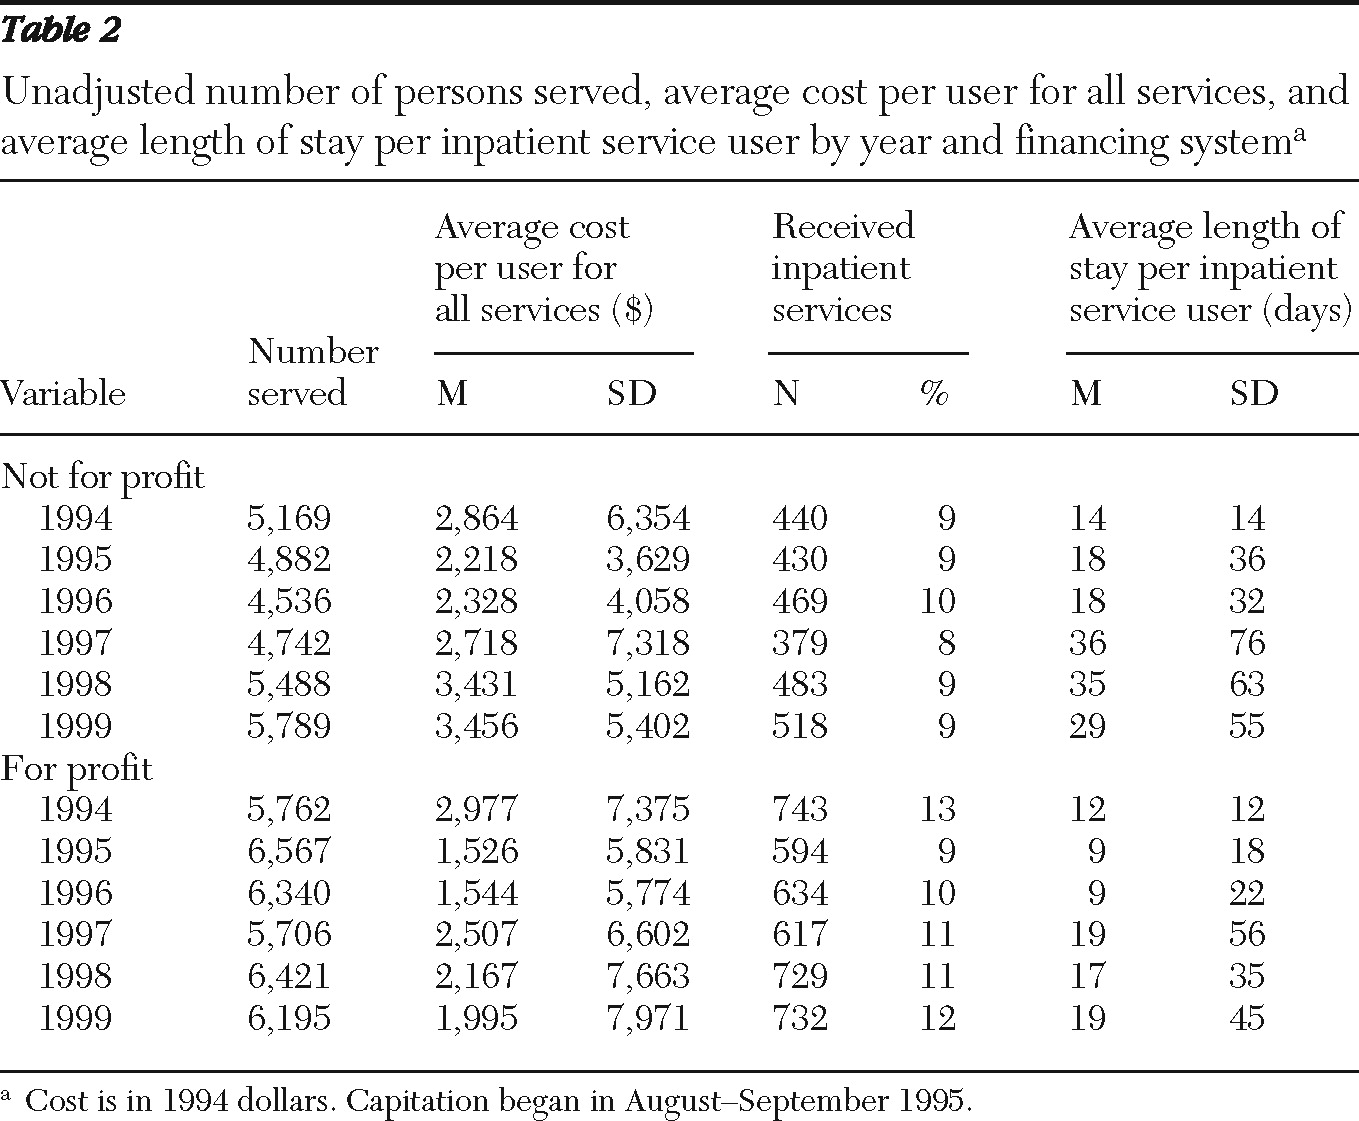
The number of people served in each of the five postcapitation years was higher in for-profit programs than in not-for-profit programs. The average cost per user was slightly higher in the for-profit programs than in the not-for-profit programs in the precapitation year, but it was lower in the for-profit programs for the rest of the study period. The percentage of patients with inpatient hospitalizations was stable and slightly lower in the not-for-profit programs than in the for-profit programs. The average length of stay per inpatient service user was also higher in not-for-profit programs than in for-profit programs (
Table 2).
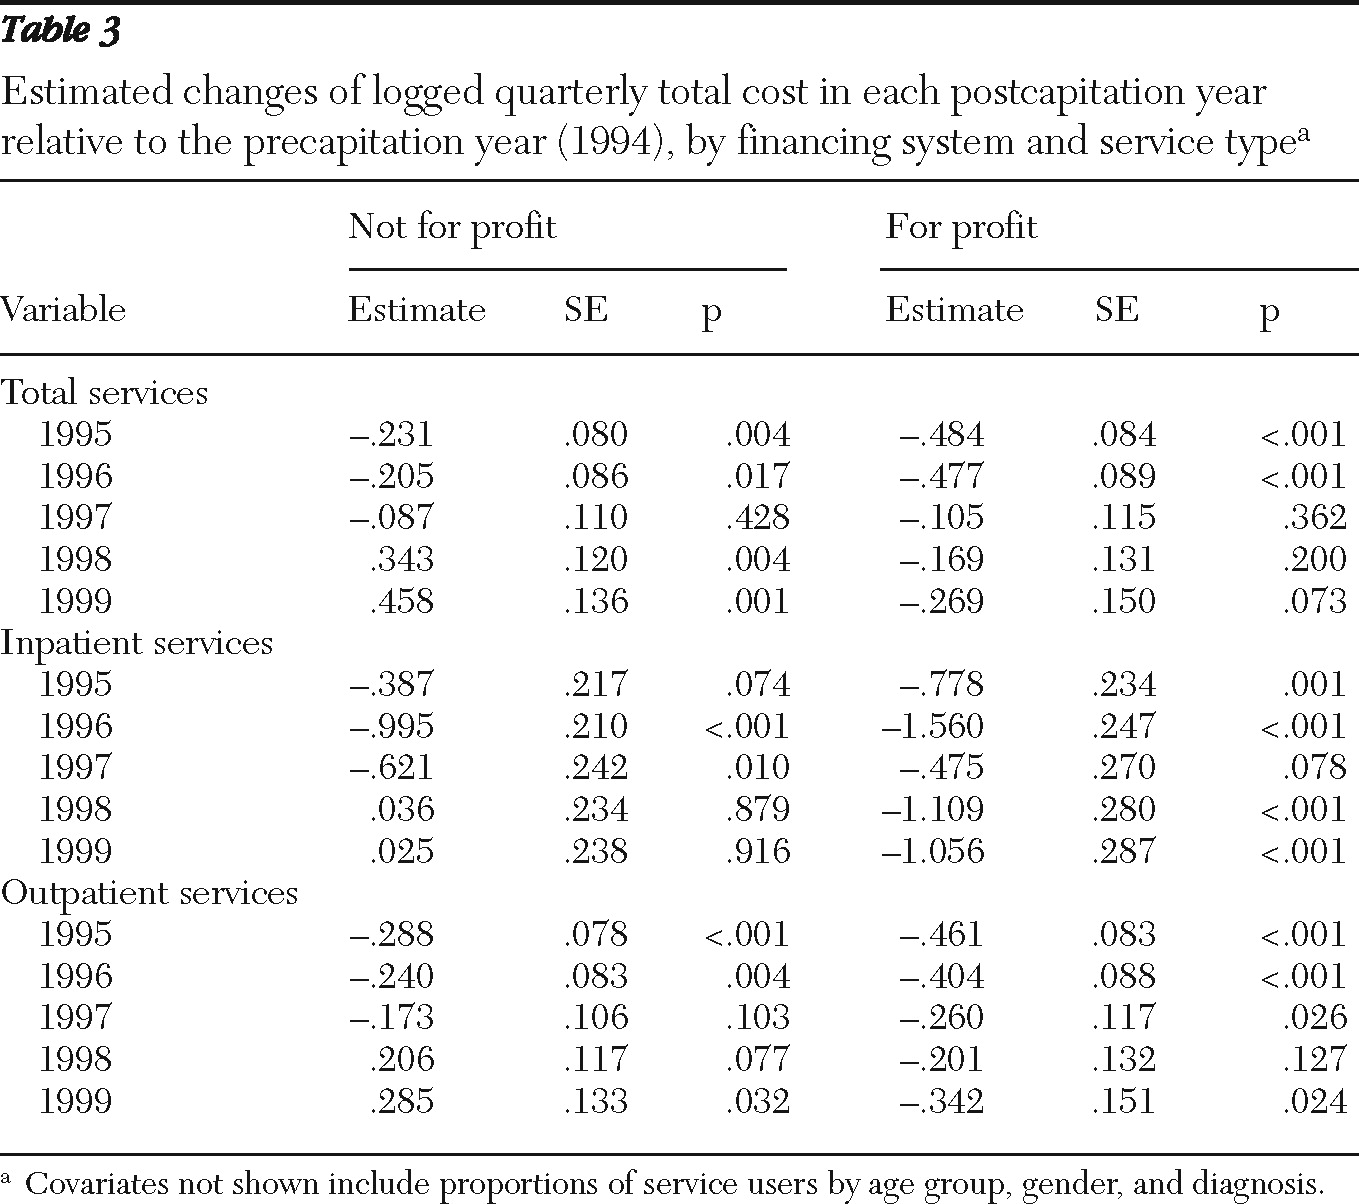
In the not-for-profit programs, after the analysis adjusted for covariates (age, gender, and diagnosis), relative to the precapitation year the logged quarterly total cost for total services decreased significantly in the first two years after program implementation; it then increased significantly during the last two years (
Table 3). Total cost in the for-profit programs decreased throughout the study period, although the decreases were not significant in 1997 and 1998 and only marginally significant (p=.073) in 1999. Total cost for inpatient services decreased in the first three years after capitation in the not-for-profit programs (change was marginally significant [p=.074] in 1995 and significant in 1996 and 1997) and increased nonsignficantly in the last two years of postcapitation. In for-profit programs, total cost for inpatient services decreased throughout the study period, although the change was only marginally significant in 1997 (p=.078). Total cost for outpatient services in not-for-profit programs decreased significantly in 1995 and 1996 and increased at a marginally significant level in 1998 (p=.077) and increased significantly in 1999. In for-profit programs, this cost decreased significantly in all years except for 1998 (
Table 3).
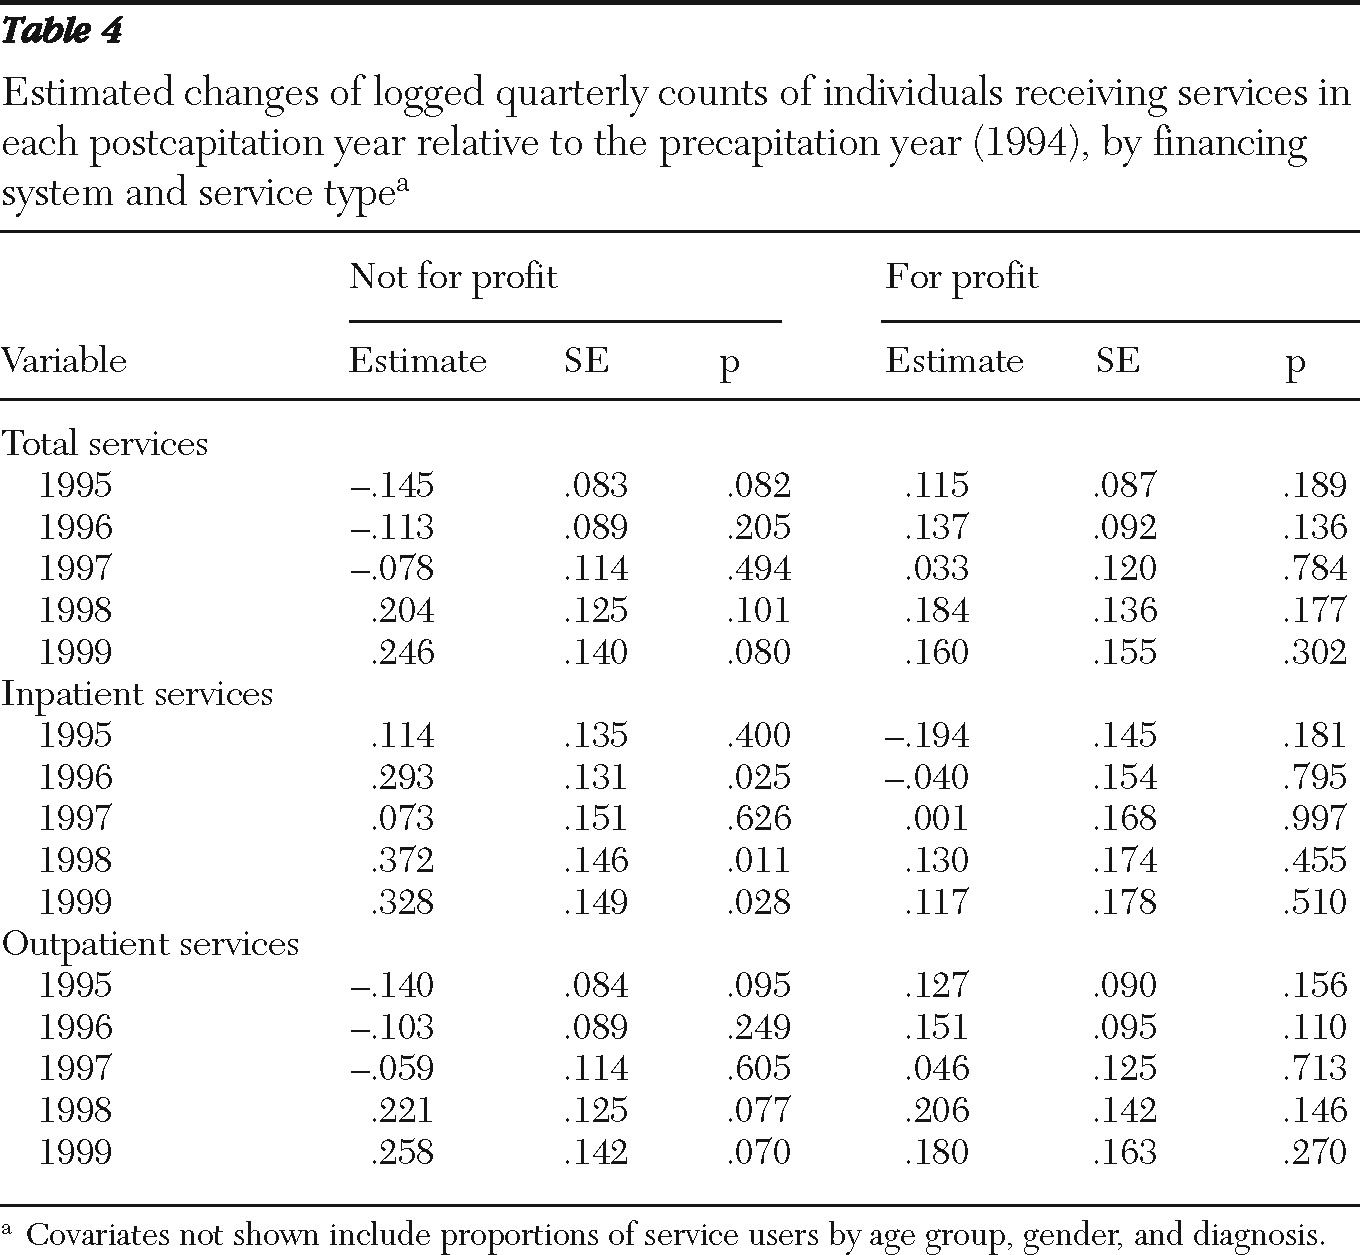
In the not-for-profit CMHCs, after the analysis adjusted for covariates, relative to the precapitation year, the number of individuals receiving services was marginally reduced in the first year after capitation (p=.082) and marginally increased in the final two years of capitation (p=.101 and .080) (
Table 4). Increases in the number of individuals receiving inpatient services increased significantly in 1996, 1998, and 1999. Although outpatient services marginally decreased in the first year postcapitation (p=.095), they marginally increased in the final two years (p=.077 and .070). In for-profit programs, there were no significant or marginally significant changes relative to the precapitation year (total, inpatient, and outpatient services).
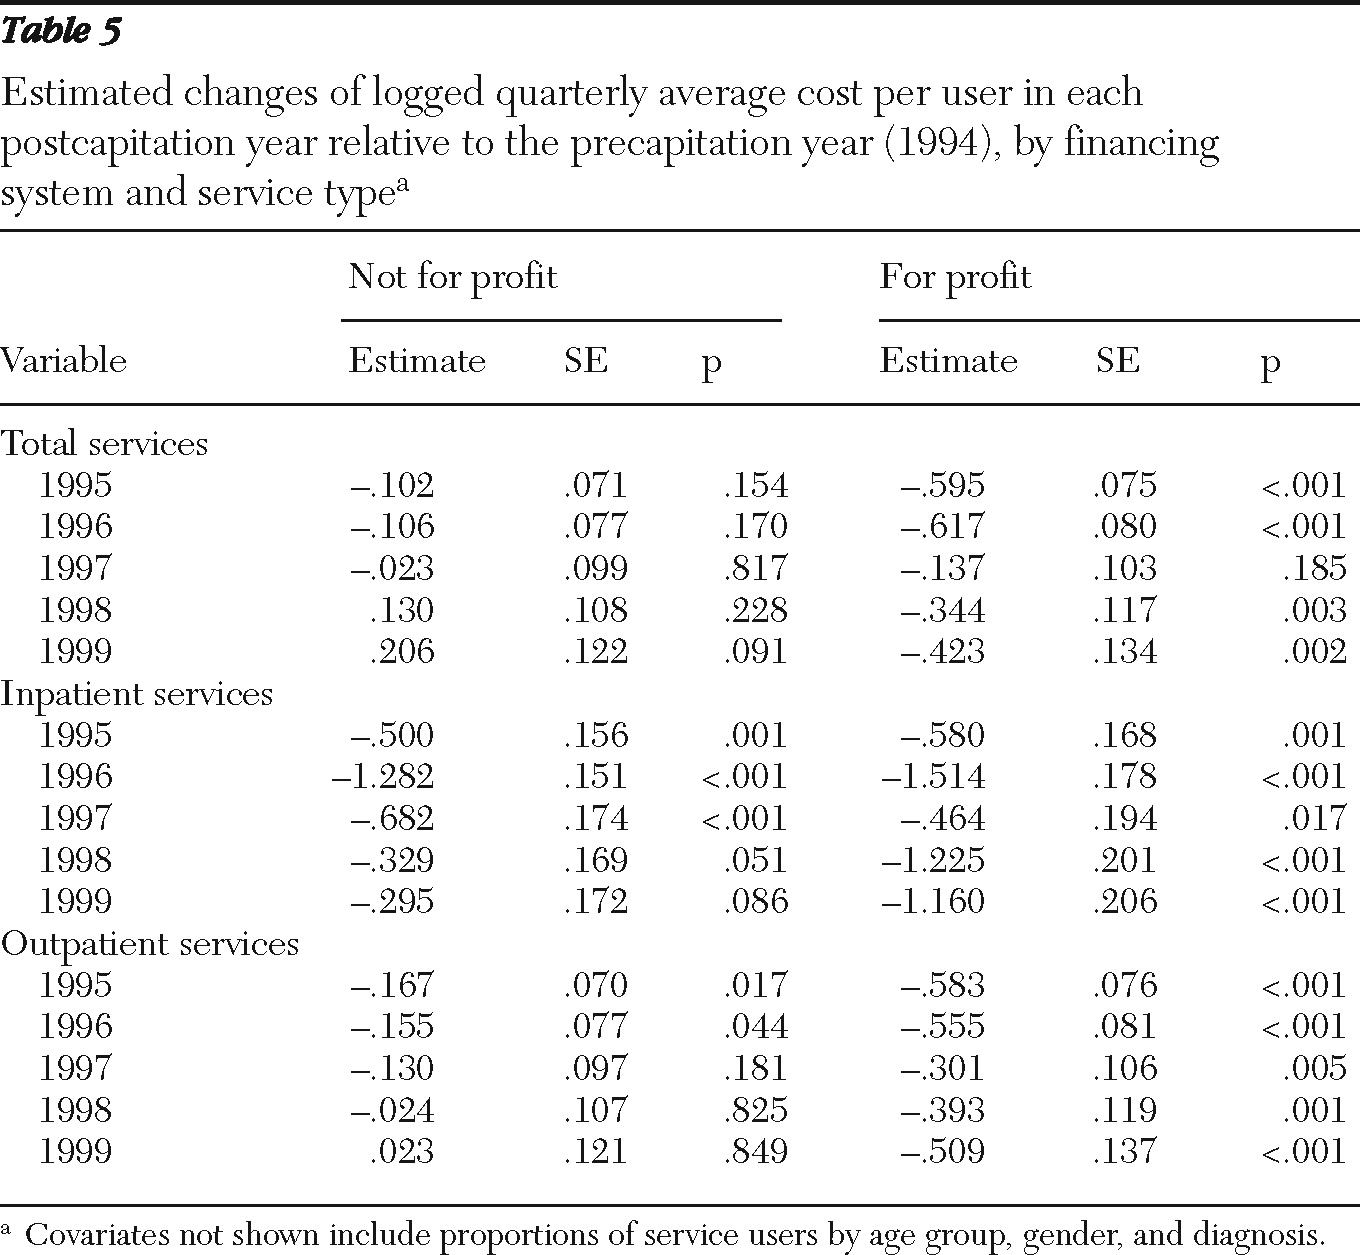
In the not-for-profit CMHCs, after the analysis adjusted for covariates, the average cost of total services per user did not differ significantly from the precapitation year to any of the postcapitation years, although there was a marginally significant increase in cost in 1999 (p=.091) (
Table 5). For inpatient services, there was a significant decrease in average cost per user relative to the precapitation year in all years but 1999, when a marginally significant decrease was seen (p=.086). For outpatient services, there was a significant decrease in average cost per user relative to the precapitation year in 1995 and 1996. In the for-profit CMHCs, significant reductions in the average total cost per user were found for all years but 1997, and significant reductions in average cost per user were found in all years for both inpatient and outpatient services.
The magnitude of reductions was greater in for-profit programs than in not-for-profit programs, especially during the last two years. For example, estimated change of logged average cost per user in 1999 was −.295 (p=.086) in not-for-profit programs and −1.160 (p<.001) in for-profit programs. Average cost per outpatient service user showed the same pattern as in average cost per user. [Figures showing the estimated average per-user costs for total, inpatient, and outpatient services and a table presenting data on estimated changes or logged average length of stay per inpatient are available as an online supplement at
ps.psychiatryonline.org.]
Discussion
Consistent with the first prediction and the empirical literature (
15), there was a significant reduction in total costs for expensive services (inpatient services) during the first three years after capitation in the not-for-profit programs (marginal in 1995) and in all five years (marginal in 1997) in the for-profit programs (
Table 3). Average cost per user for inpatient services decreased significantly in all postcapitation years in both not-for-profit and for-profit programs (marginal in 1999 in the not-for profit programs) (
Table 5). The finding of significant decreases in inpatient cost per user in both types of program (although not as strong in not-for-profit programs) is probably attributable to the incentives resulting from capitation to manage utilization of inpatient care regardless of the type of financing.
Although reductions in cost per user for inpatient services were found in the not-for-profit programs, decreases in cost per user for outpatient services that were found in the first two years postcapitation diminished over time. In comparison, in the for-profit programs significant reductions in cost per user were found for every year postcapitation not only for inpatient services but also for outpatient services and total services (except for total services in 1997). These findings are consistent with the second prediction—that the for-profit programs would be more effective at minimizing costs. The for-profit programs maintained the cost reductions, whereas the initial significant reductions ceased in the not-for-profit programs. These results support the findings of our cost-utility analysis (
16) and of earlier research that used primary data (
4). The increased per-user cost in 1998 and 1999 in the not-for-profit programs may have reflected new expectations to provide services in advance of renewal of the capitation contracts, whereas the decreases in the initial years may have reflected environmental pressures to minimize cost per user.
Results indicate that compared with the not-for-profit programs, the for-profit programs served more consumers during the study period, especially as outpatients, while containing costs. For-profit programs achieved cost reductions through reducing the average cost per user instead of restricting consumers' access to services. The not-for-profit programs achieved some cost reductions in the first two years after the implementation of capitation by reducing both the number of consumers served and the average cost per user for inpatient and outpatient services, which corroborates findings from our earlier study that used primary data for the first two years after capitation (
4). The capitation program stabilized the costs of the Medicaid program, compared with the double-digit inflation before 1995, and all of the programs were able to stay within their budgets without a reinsurance program for high-cost consumers. This is good news for proponents of managed care, and our findings contradict those from studies of shorter periods (
5,
16).
Previous research has provided some evidence that the for-profit programs used a different strategy for controlling costs than the not-for-profit programs (
23). The not-for-profit programs tried to prevent hospitalization by providing higher intensity outpatient services, while the for-profit programs attempted to reduce length of hospitalization by using discharge planners situated within the hospitals. As indicated in
Table 2, the percentage of consumers hospitalized and the length of hospital stay differed between the two program types, attesting to the effectiveness of the discharge planners. However, as noted above, these differences translated into lower cost per user for inpatient, outpatient, and total services only for the for-profit programs, not for the not-for-profit programs, corroborating prior analyses (
23).
One benefit of capitation is the lack of necessity to bill per service; however, a potential limitation could be the quality of the data coming from the shadow billing system. The state was also concerned about this issue and conducted audits of the system at regular intervals. These findings indicated that any initial problems were corrected and data were found to be reliable (
4).
Because a unique, albeit administrative, data set from Colorado was used, we are limited to a focus on aggregated data and cost per user. In addition, it also means that we are limited in our ability to determine whether not-for-profit programs were able to provide community benefits (for example, access to care) because they did not have to provide benefits to shareholders (
16). Because the data set contains information on Medicaid-eligible consumers, we do not have information on the number of non-Medicaid-eligible consumers who received services as a result of the savings from the capitation program. Primary outcome data were collected during the first two years, allowing us to study the cost-efficiency and cost-effectiveness of capitation (
4,
18,
24).
These data are old by some standards. However, this is less of a concern because 34 states, including Colorado, continue to use capitated financing in their Medicaid programs for persons with severe and persistent mental illness. A discussion of capitated financing is also timely. Accountable care organizations, many of whom use capitated financing, are expected to receive incentives under health care reform (
25).
Finally, Colorado's CMHCs are either not-for-profit programs or, in one case, public programs. Thus centers that developed their programs under the aegis of a for-profit managed behavioral health organization (MBHO) formed a joint venture for their for-profit Medicaid program. The MBHO provided consultation, systems, and assistance in making the program work, but it did not provide services. Because both the not-for-profit and the for-profit programs delivered the services to consumers, we believe the two programs to be equivalent.
In the study presented here, the costs of services provided by not-for-profit programs were compared to those of for-profit programs. Although the empirical findings have shown that for-profit programs have lower average costs, the data do not show the differences in the quality of services. As discussed by Pauly (
20) and Nicholson and colleagues (
21), a comparison of the relative efficiency of these programs should take into account the quality of the services provided. Although these administrative data do not contain measures of quality, primary data at two years postcapitation indicated that there were no differences between the two programs studied (
18).
In for-profit programs, the cost per user for inpatient, outpatient, and total services over the postcapitation years was reduced (aside from total services in 1997), whereas in the not-for-profit programs, the cost per user for inpatient services was reduced in all years (marginally for 1999).One strategy to reduce costs is to maintain reductions in the length of stay of inpatient visits and reduce the number of outpatient visits while keeping the number of individuals receiving services the same. The number of individuals receiving services in not-for-profit programs did not increase except for the last two years in which the number of users increased at a marginally significant level. In general, the number of individuals receiving services in for-profit programs increased over the postcapitation years. However, the number of outpatient visits and the lengths of stay when the consumers were hospitalized were significantly reduced in for-profit programs, suggesting that consumers discharged from the Medicaid mental health program may have been replaced by new consumers. These findings indicate that different strategies were used by the not-for-profit and for-profit programs to control expenditures and utilization.
