For decades the relationship of socioeconomic status to mental health has been a central issue for social epidemiologists (
1,
2). The relationship between socioeconomic status and depression is complex because low socioeconomic status has been found to be related to depression prevalence (
3) but not always to incidence (
4,
5). So, the question remains: What is it that links socioeconomic status to depression?
For years, starting with the finding of an association between income inequality and life expectancy (
6), social epidemiologists have been interested in the relationship of inequality to health (
7). Income inequality is a group-level phenomenon that refers to the degree to which a percentage of the population captures a disproportionate large percentage of material resources. The effects of income inequality on mortality and general health have been a focus since they were first reported in the early 1990s (
6). In contrast, the effects of income inequality on specific mental disorders have received little attention. The lack of attention is surprising because “relative deprivation” would appear to be a potential contributor to the effects of inequality on mental health. Relative deprivation is a social-psychological construct introduced in the 1950s (
8). Briefly, Stouffer proposed the concept in his classic work on American soldiers during World War II, where he observed that feelings of satisfaction, or dissatisfaction, with one's outcome depends more on subjective standards, such as the level of outcomes obtained by salient comparison persons, than on objective prosperity (
9).
We found one preliminary ecological study on inequality and the prevalence of mental illness (
10) and two multilevel studies with outcomes that included depressive symptoms (
11). The first was a multilevel study examining the association between income inequality and depression among persons aged 70 and older. That study found a significant association between income inequality at the county level and depression risk (
12). Another pioneering multilevel study, although limited to maternal health, found that high income inequality conferred an increased risk of poor mental health and poor general medical health (
13). A recent working paper reported on the association between income inequality and depression across countries (
14).
The United States, with its 50 states and marked regional heterogeneity, provides an unusual opportunity to test at the ecological level the putative association between income inequality and the prevalence of depression. A factor that has limited earlier studies in this area is the lack of reliable state-level estimates of depression prevalence. Recent data released by the Centers for Disease Control and Prevention (CDC) now permit such ecological analyses.
Methods
Estimates of the prevalence of depression by state were obtained from the CDC 2006 and 2008 Behavioral Risk Factor Surveillance System (BRFSS). BRFSS conducts state-based, random-digit-dialed telephone surveys of the noninstitutionalized adult U.S. population; data are collected on health conditions and risk behaviors. For states where data were collected in both years, the 2008 data were used. Five states (Kentucky, New Jersey, North Carolina, Pennsylvania, and South Dakota) did not participate in either year, leaving a sample of 45 states. The mean response rate was 52.7% in 2006 and 52.0% in 2008. These surveys have recently been combined to estimate prevalence of depression by state (
15).
Depression was determined on the basis of responses to the Patient Health Questionnaire-8 (PHQ-8) (
16), which covers eight of the nine
DSM-IV criteria for depression (
17). The ninth criterion assesses suicidal ideation and was omitted because interviewers would not have been able to provide adequate intervention. The PHQ-8 sensitivity and specificity for depression have been reported to be 88% (
16). The PHQ-8 response set was standardized to the BRFSS methodology for current depression by asking the number of days “over the past two weeks” that the respondent experienced a particular depressive symptom. Participants were considered to have major depression if for “more than half the days” they met at least five of the eight criteria, including at least one of the following: “little interest or pleasure in doing things” or “feeling down, depressed, or hopeless.” Participants were considered to have “other depression” if they met two, three, or four of the eight criteria, including at least one of the two specified above. Weighted prevalences were calculated that accounted for the survey design. These two definitions of depression were combined to estimate “any depression.”
The Gini coefficient is the most used measure of income inequality; it varies from 0 to 1, where 0 represents complete equality and 1 represents maximum inequality (the hypothetical condition of one person holding all income) (
11). Gini coefficients for U.S. household income were obtained from 2006 American Community Survey data (
18), and data for other covariates came from Census 2010 data (
19). Given the known associations between depression and income and between depression and education achievement, as well as the differences in age structure across states, models included per capita income, percentage of the population with a college degree, and percentage of the population over age 65.
Results
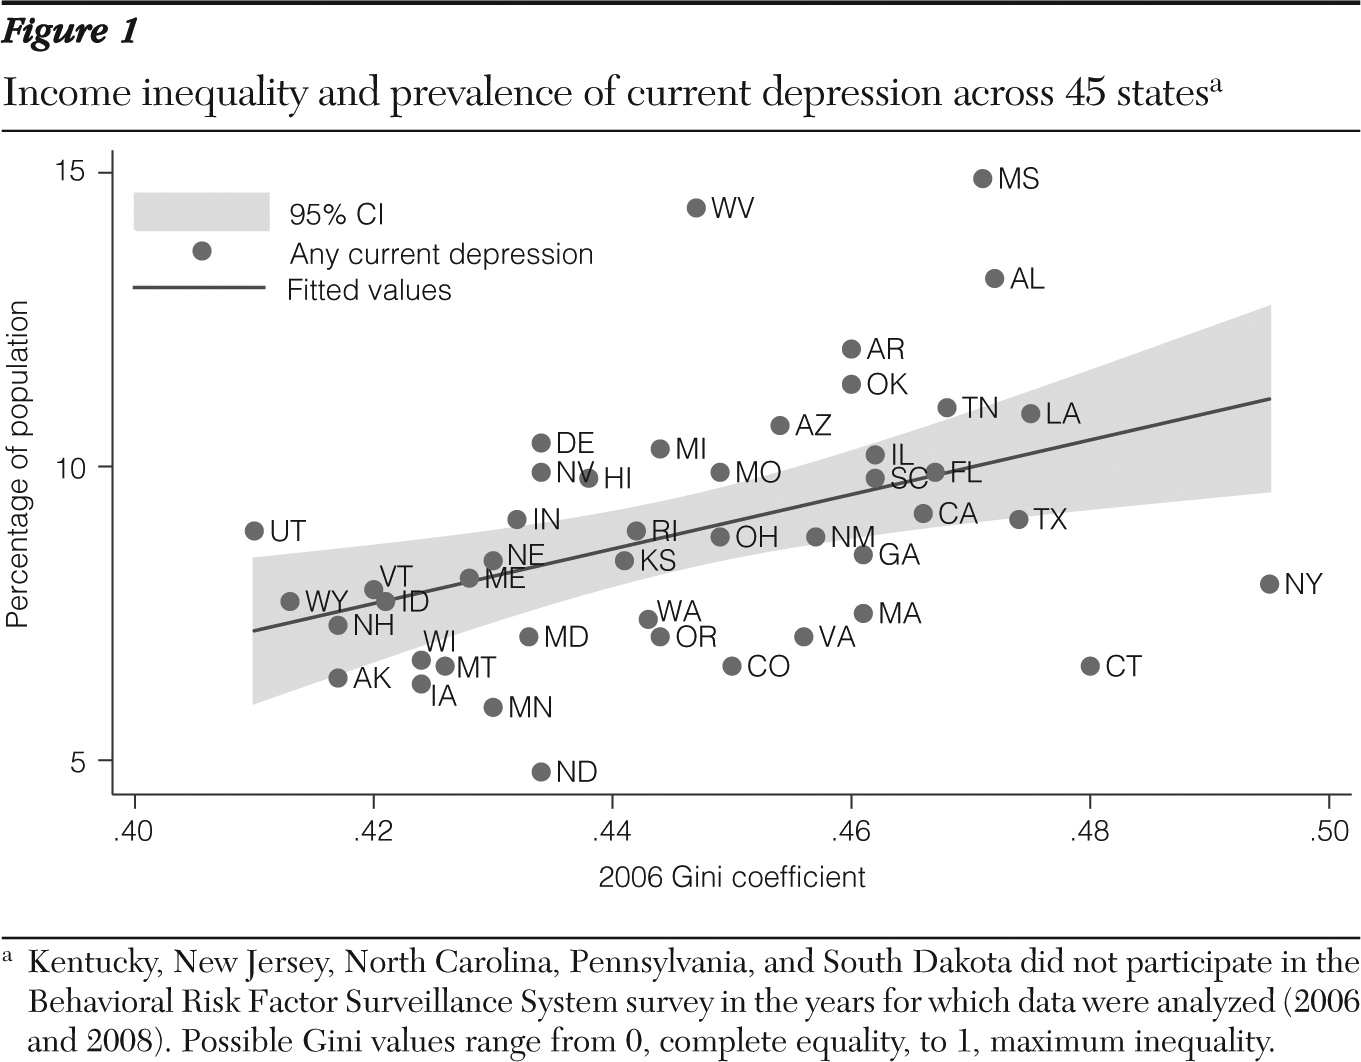
Data for 235,067 adult respondents were analyzed, and 9.0% met criteria for current depression, including 3.4% for major depression. Mississippi had the highest prevalence, with 14.8% of respondents meeting criteria for any of the categories of current depression and 5.3% meeting criteria for major depression. North Dakota was the state with the lowest prevalence, with 4.8% meeting criteria for current depression, including 1.5% for major depression. The U.S. nationwide Gini value for 2006 was .464, ranging from .410 in Utah (least unequal) to .495 in New York (most unequal).
The current prevalence of “any depression” was significantly associated with income inequality—the more unequal, the higher the depression prevalence (
Figure 1)—with a correlation coefficient of 43.5 (p<.001). The association persisted after adjustment for income per capita, percentage with a college degree, and percentage over age 65. Depression prevalence was also associated with income per capita, but that association was no longer significant when the analysis adjusted for percentage with a college degree. In the most inclusive regression model, only income inequality (measured by the Gini coefficient) and the percentage of the population with a college education were significantly associated with current depression prevalence.
We found a similar pattern between income inequality and the more restrictive category of major depression. In the adjusted analysis, income inequality was significantly associated with the prevalence of major depression (correlation coefficient=10.9, p=.03). Again, in the most comprehensive regression model, only income inequality and percentage with a college education were significantly associated with major depression prevalence. [Tables summarizing the results of two models of the association between Gini values and depression—for any depression and major depression—are available in an online supplement to this column at
ps.psychiatryonline.org.]
Discussion
In this ecological analysis, we found a significant positive correlation between income inequality and depression prevalence across states. The association was independent of state-level indicators of income per capita, percentage of the population with a college education, and percentage of elderly persons in the population. These results are in line with those of other studies (
12,
13).
One limitation of this approach is the possibility of the ecological fallacy, which occurs “when one ascribes to members of a group, characteristics that they in fact do not possess as individuals” (
20). In our study all the analyses and conclusions are at the aggregate level. Because this was an ecological analysis, another limitation is the inability to determine whether the effects of inequality extended to both ends of the income distribution—that is, affecting risk of depression among both the very poor and the very wealthy. Future studies should use multilevel designs to investigate the association at the ecological and individual levels.
Our findings are in agreement with research that shows a correlation between social fragmentation and mental health outcomes, such as suicide (
21). The role of depression as a risk factor for a number of medical conditions, ranging from obesity (
22) and diabetes (
23) to stroke (
24) and cardiovascular risk (
25), suggests that depression might be a mediator between decreased social capital and worsening health outcomes in general, including overall mortality (
26).
Areas for future research include clarifying the wide variation in depression prevalence among states with high income inequality. For example, New York and Connecticut, although presenting the most unequal income distributions, had a low depression prevalence, whereas West Virginia, with the second highest depression prevalence, was in the mid-range of income inequality (
Figure 1). Future research on the mechanisms linking income inequality and depression prevalence will inform efforts to counter its adverse effects, through public policy, public health efforts, and the mental health system.
Acknowledgments and disclosures
The authors report no competing interests.


