Reliability and Latent Structure
With regard to interrater reliability, the random-model intraclass correlation coefficient for the 24 independently rated audiotaped Panic Disorder Severity Scale assessments was 0.87 (df=2,23, p<0.001); for the 24 pairs of separate assessments, the intraclass correlation coefficient was 0.88 (df=2,23, p<0.001). Across these two subgroups, interrater reliability on individual scale items ranged from 0.74 (item 2: distress during panic attacks) to 0.87 (item 4: agoraphobic fear and avoidance).
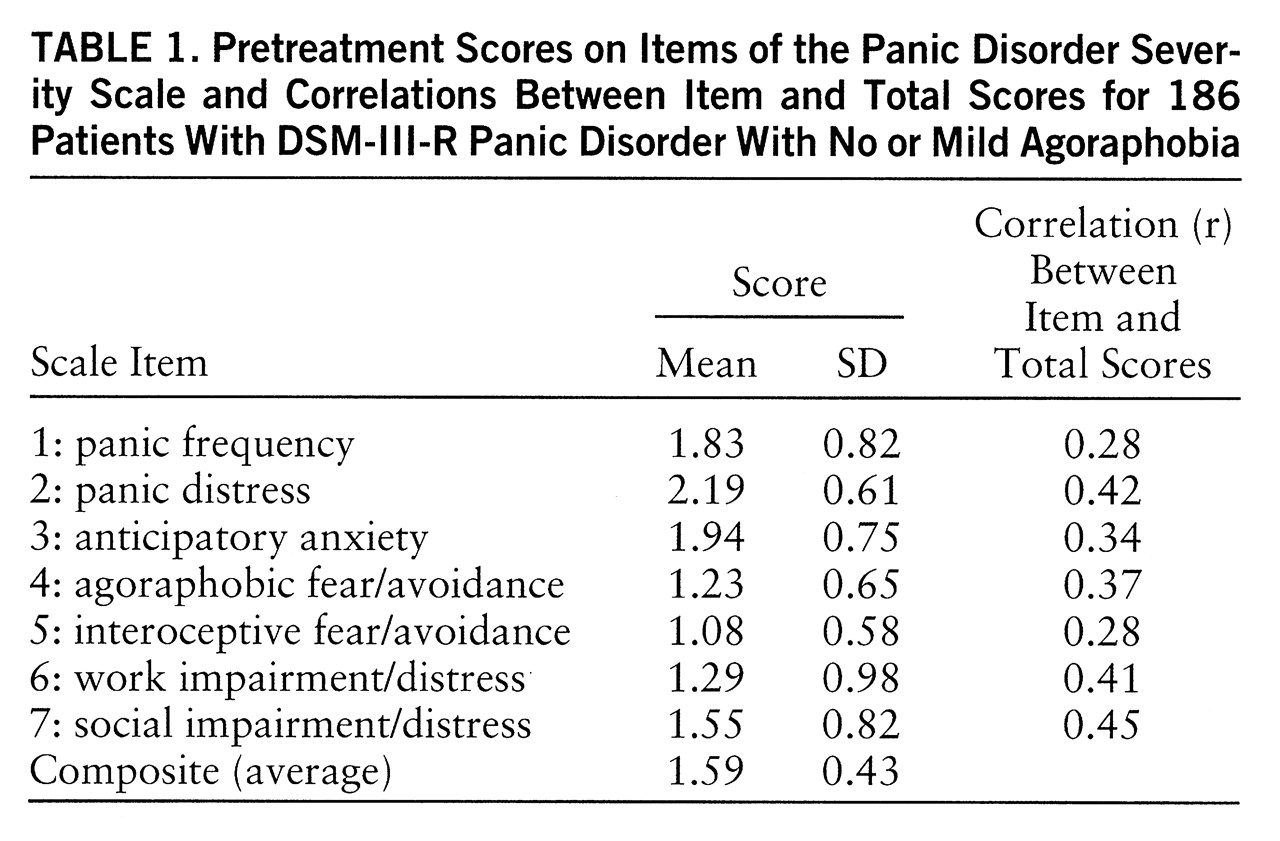
For the entire study group (N=186), the internal consistency (Cronbach's alpha) of the pretreatment total score on the Panic Disorder Severity Scale was 0.65. Mean scores and standard deviations for individual items and correlations between each item and the total score are presented in
table 1. Although the item-total correlations were modest for some items (e.g., items 1 and 5), results indicated that alpha would not increase with the omission of any individual item. Because fair reliability could reflect a lack of unidimensionality of the severity scale, the latent structure of the seven constituent scale items was evaluated by using a linear structural relations program and a maximum-likelihood solution (LISREL 8.14) (
12). First, the hypothesized one-factor solution was fit to the data. The results indicated that all seven items had salient factor loadings; the completely standardized lambda-X coefficients were 0.36, 0.49, 0.44, 0.46, 0.35, 0.54, and 0.59 for items 1 through 7, respectively. Indices of overall fit for the one-factor model were as follows: χ
2=39.32, df=14, p<0.001; comparative fit index=0.82, incremental fit index=0.83, root mean square error of approximation=0.099, global fit index=0.94.
Inspection of the standardized residuals and modification indices from the theta-delta matrix indicated an association between items 1 and 2 (panic frequency and distress, respectively) that was not adequately accounted for by the single-factor solution. Thus, a two-factor model was fit to the data; items 1 and 2 formed the first factor, and items 3 through 7 formed the second. Relative to the one-factor model, the two-factor model provided a significantly improved fit (nested χ2=14.88, df=1, p<0.001). Indeed, this model provided a good fit for the data (χ2=24.44, df=13, p<0.05; comparative fit index=0.92, incremental fit index=0.92, root mean square error of approximation=0.069, global fit index=0.96. The factor loadings for the first factor were 0.49 and 0.77 (items 1 and 2, respectively), and the factor loadings for the second factor were 0.43, 0.50, 0.38, 0.54, and 0.62 (items 3 through 7, respectively). The two factors were moderately correlated (r=0.55, N=185, p<0.001). Inspection of the standardized residuals and modification indices from the theta-delta and lambda-X matrix suggested no further refinements in the factor model.
Convergent and Discriminant Validity
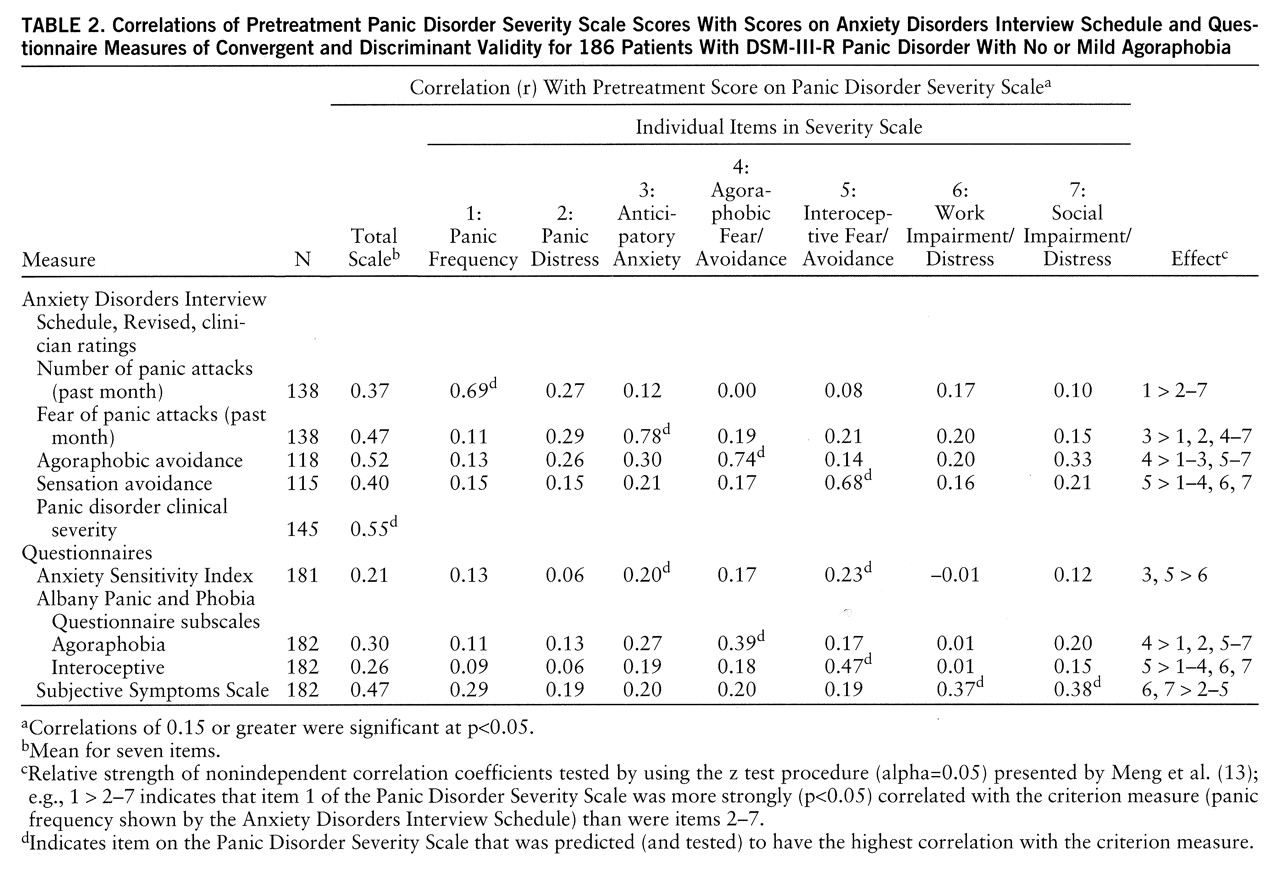
Table 2 presents correlations of the item and total scores on the Panic Disorder Severity Scale with scores on the Anxiety Disorders Interview Schedule and other questionnaire measures. As shown in this table, the Panic Disorder Severity Scale total score was correlated significantly with the Anxiety Disorders Interview Schedule clinical severity rating of panic disorder (r=0.55, N=145, p<0.001). As a test of convergent and discriminant validity, it was predicted that each item on the Panic Disorder Severity Scale would be most strongly correlated with an Anxiety Disorders Interview Schedule or questionnaire measure assessing a similar or overlapping domain (no predictions were made for item 2 of the Panic Disorder Severity Scale because no criterion measure was available). As summarized in
table 2, statistical tests of the relative magnitude of the correlations (
13) supported these predictions overall (e.g., Panic Disorder Severity Scale item 1, panic frequency, was more strongly correlated with the Anxiety Disorders Interview Schedule rating of panic frequency than was any other Panic Disorder Severity Scale item). Not surprisingly, the Panic Disorder Severity Scale was more strongly correlated with the Anxiety Disorders Interview Schedule than with questionnaire measures; this finding is attributable in large part to shared-method variance (i.e., the independent evaluator completing the Panic Disorder Severity Scale had previously administered the Anxiety Disorders Interview Schedule). Nevertheless, it is encouraging that, albeit of smaller magnitude, the pattern of correlations between the Panic Disorder Severity Scale and the questionnaires was consistent with the results involving measures from the Anxiety Disorders Interview Schedule, indicating differential associations with the criterion measures in the predicted directions (e.g., Panic Disorder Severity Scale item 4, agoraphobic fear/avoidance, was more strongly correlated with the agoraphobia rating from the Albany Panic and Phobia Questionnaire than was any other item on the Panic Disorder Severity Scale).
Sensitivity to Change
Of a subgroup of 89 patients completing the posttreatment assessment, 69 (78%) and 20 (22%) were classified as treatment responders and nonresponders, respectively, on the basis of CGI ratings of global improvement by independent evaluators. The sensitivity to change of the Panic Disorder Severity Scale was analyzed by using a time-by-group analysis of variance (time: pre-, posttreatment; group: responder, nonresponder). Both of the main effects and the interaction effect were statistically significant (group: F=11.08, df=1,87, p<0.001; time: F=57.15, df=1,87, p<0.001; interaction: F=41.36, df=1,87, p<0.001). Post hoc analyses (Fisher's protected t tests) of the interaction effect indicated that, although posttreatment total scores on the Panic Disorder Severity Scale (mean=1.43, SD=0.67) did not differ from pretreatment scores (mean=1.51, SD=0.49) for the nonresponders (t=0.90, df=19, p<0.38), treatment responders evidenced a significant decline (t=13.83, df=68, p<0.001) from pretreatment (mean=1.62, SD=0.42) to posttreatment (mean=0.64, SD=0.48). Because the study blind had not been broken at this writing, differences between active treatment and placebo are not reported.


