Clinical and Demographic Features
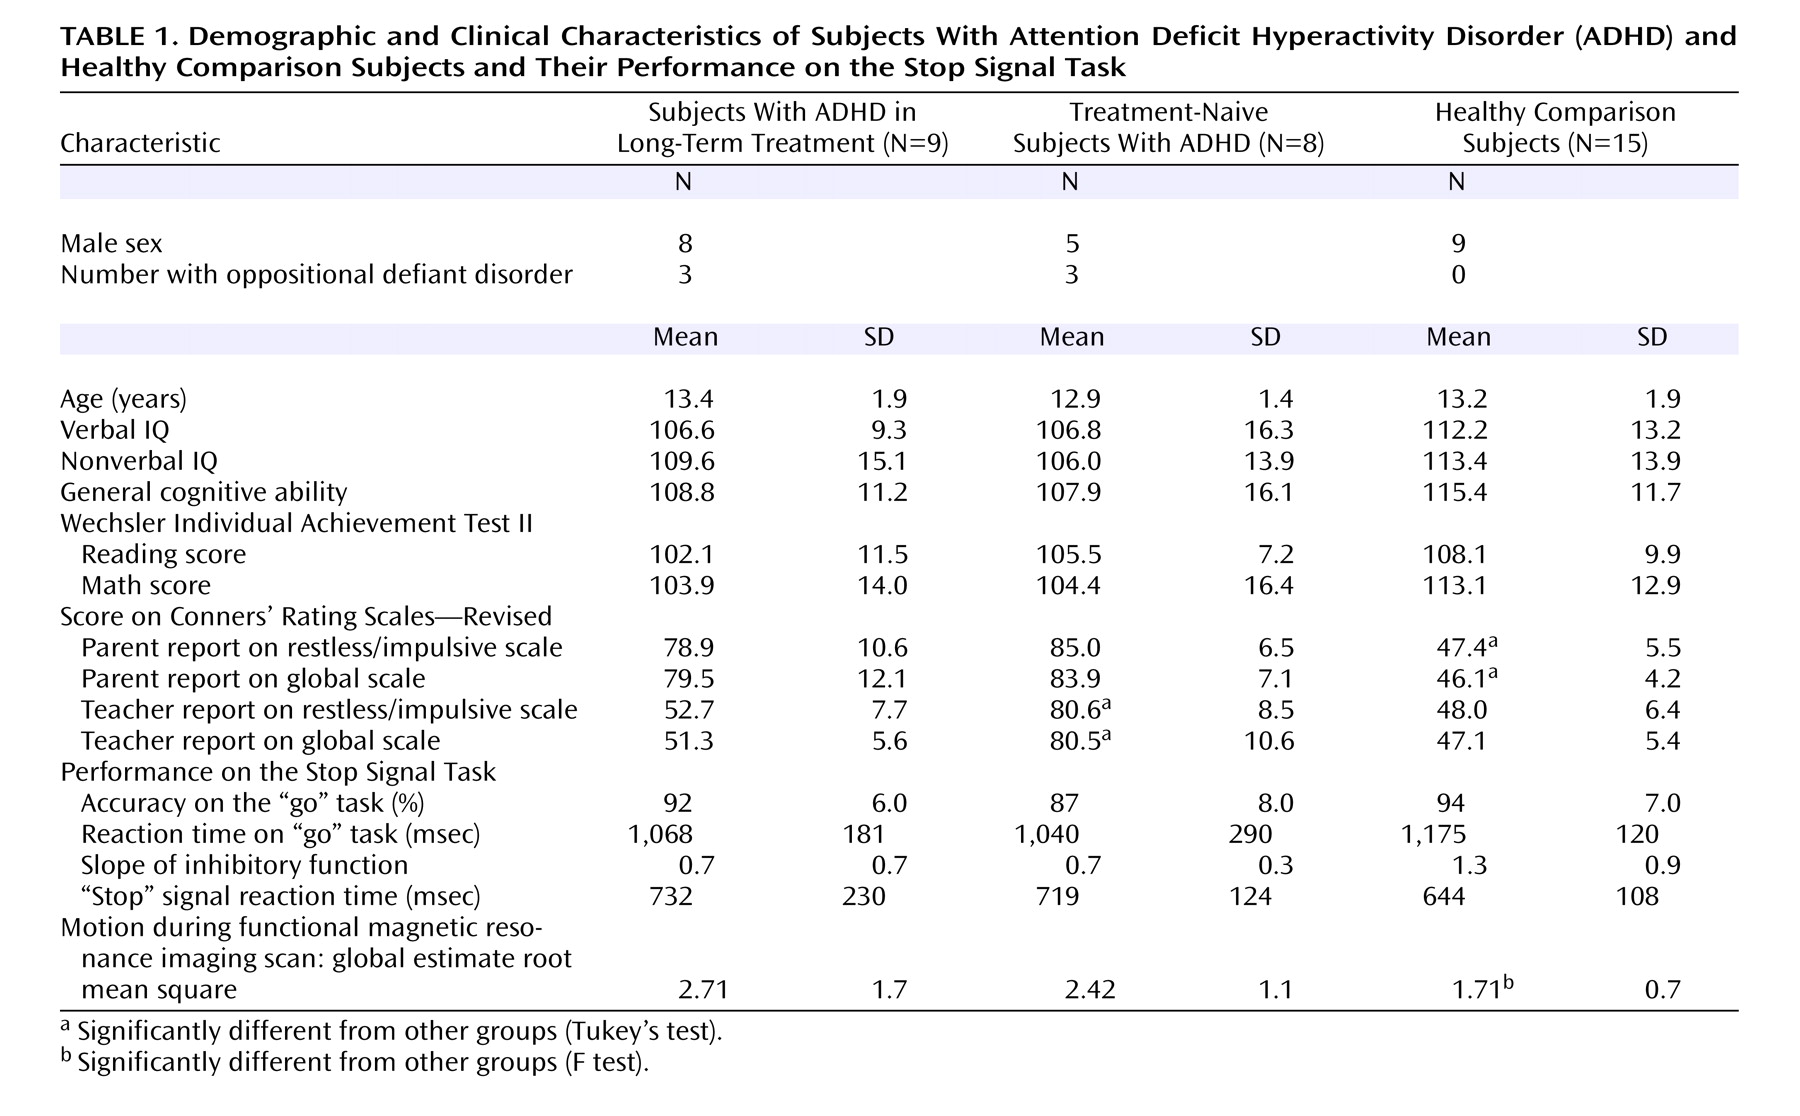
There were no significant differences between the groups in terms of age, IQ, or Wechsler Individual Achievement Test II scores. Although there were more boys in the ADHD groups, this difference was not statistically significant. However, there were not enough girls to perform a group-by-gender analysis. Three of the long-term-treated and three of the treatment-naive children with ADHD had oppositional defiant disorder. The amount of time the ADHD group in long-term treatment was taking stimulants (methylphenidate or amphetamines) ranged from 1 to 9 years, with a mean of 4.9 years (SD=2.9). As expected, there were significant differences between the ADHD group and the comparison group in terms of parent reports for restless/impulsive (F=89.4, df=2, 29, p<0.001) and global (F=85.3, df=2, 29, p<0.001) Conners’ Rating Scales—Revised scores. In contrast, the ADHD groups did not differ. The treatment-naive ADHD group was different from the comparison group on the teacher-rated restless/impulsive (F=48.0, df=2, 28, p<0.001) and the global (F=55.8, df=2, 28, p<0.001) Conners’ Rating Scales—Revised scores, but the ADHD group treated in the long term was not, reflecting that stimulant treatment had successfully controlled ADHD symptoms in the classroom.
Behavior Performance on Stop Signal Task
Table 1 shows behavioral performance on the Stop Signal Task. There were no statistically significant differences between groups on any of the task indices, although the ADHD groups showed a reduced slope on inhibitory function (F=2.6, df=2, 29, p<0.09) and a longer “stop” signal reaction time (F=1.1, df=2, 29, p=0.34).
Based on estimates derived from the motion-correction algorithm (maximum absolute displacement), the children with ADHD were more prone to movement during scanning than the comparison children (F=8.79, df=1, 30, p=0.01). However, these differences abated after motion correction.
Voxel-Level Imaging Results
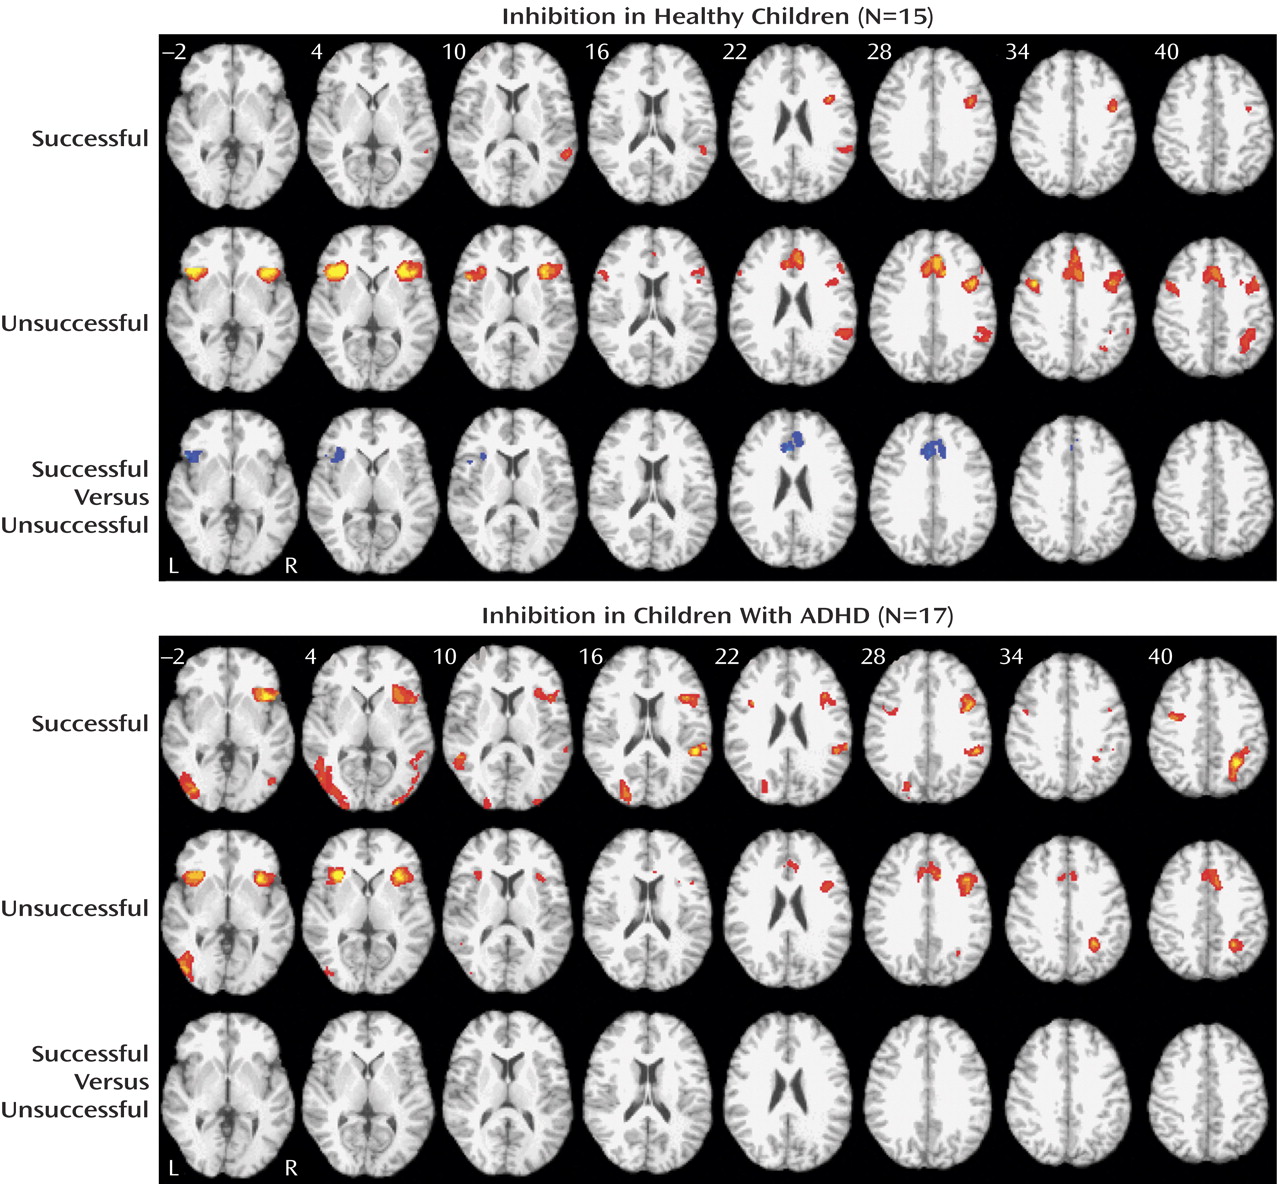
For healthy children, successful inhibition was associated with a network of brain regions in the right inferior frontal gyrus (Brodmann’s area: 9: 40, 5, and 30) and the right superior temporal gyrus (Brodmann’s area 22: 54, –45, and 14) (
Figure 1 ). In contrast, the comparison subjects activated the anterior cingulate cortex (Brodmann’s area 32; 1, 24, and 30), the bilateral ventrolateral prefrontal cortex (Brodmann’s area 47; 38, 18, and 4; and –42, 20, and 0), the right posterior parietal lobe (Brodmann’s area 7: 38, –42, and 38), and the bilateral precentral gyrus (Brodmann’s area 9; –42, 4 and 37; and 42, 8, and 36) during failed inhibition. Direct comparison of unsuccessful versus successful “stop” trials in comparison subjects showed increased activity in the anterior cingulate cortex (Brodmann’s area 24; 2, 24, and 22) and the left ventrolateral prefrontal cortex (Brodmann’s area 47; –46, 16, and –2), whereas no significant activations were present in the opposite contrast of successful versus unsuccessful “stop” trials.
For children and adolescents with ADHD, successful inhibition was associated with a network of brain regions, including the right insula and the ventrolateral prefrontal cortex (Brodmann’s area 13; 39, 13, and 10), the right superior temporal gyrus (Brodmann’s area 39; 48, –53, and 14), bilateral occipital activity (Brodmann’s areas 19 and 18; 24, –82, and 20; and –40, –73, and 2), the right inferior parietal lobule (Brodmann’s area 40: 31, –51, and 41), and the bilateral precentral frontal gyrus (Brodmann’s area 6; 42, 4, and 28; and –35, –2, and 35) (
Figure 1 ). A similar network of regions was observed for unsuccessful inhibition, including the bilateral insular and the ventrolateral prefrontal cortex regions (Brodmann’s area 13; 37, 13, and 12; and –34, 17, and 1), the anterior cingulate cortex (Brodmann’s area 32; 3, 20, and 32), the left inferior occipital gyrus (Brodmann’s area 19; –43, –73, and 0), and the right superior parietal lobule (Brodmann’s area 7; –29, –52, and 38). Direct comparisons between successful and unsuccessful inhibition trials did not result in any significant differences for children with ADHD (
Figure 1 ).
Functional Region-of-Interest Analysis
Four a priori regions of interest were defined by contrasting “stop” with “go” trials in all subjects. These regions included the anterior cingulate cortex (center of mass: 2, 24, 29; volume=2566 mm
3 ), the right dorsolateral prefrontal cortex (center of mass: 40, 24, 36; volume=458 mm
3 ), and the left (center of mass: –36, 18, 3; volume=1466 mm
3 ) and right (center of mass: 38, 17, 3; 2304 mm
3 ) ventrolateral prefrontal cortex or insular regions.
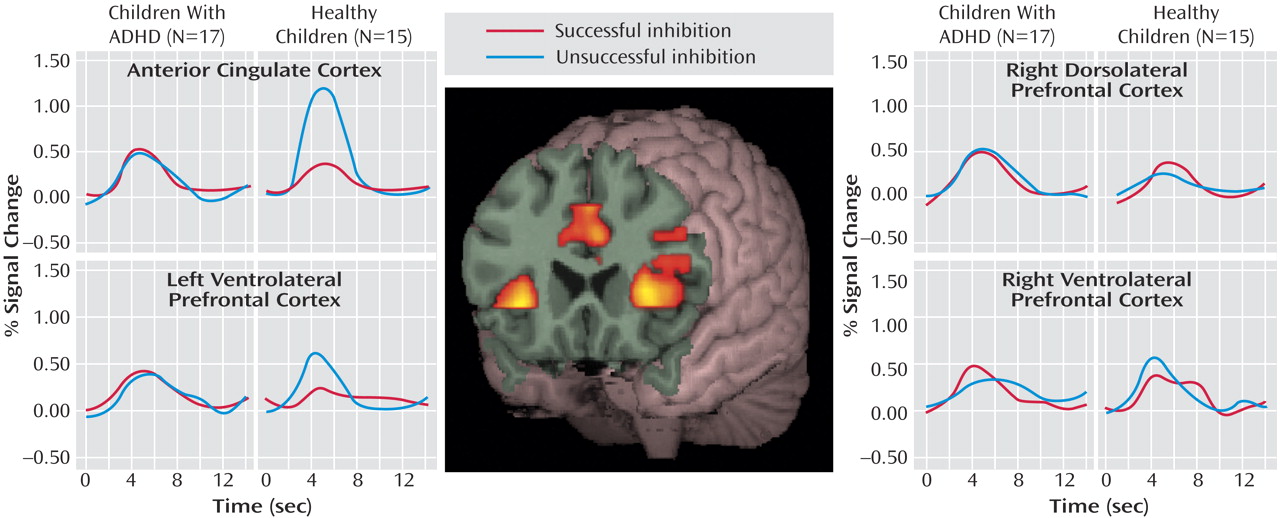
Figure 2 and
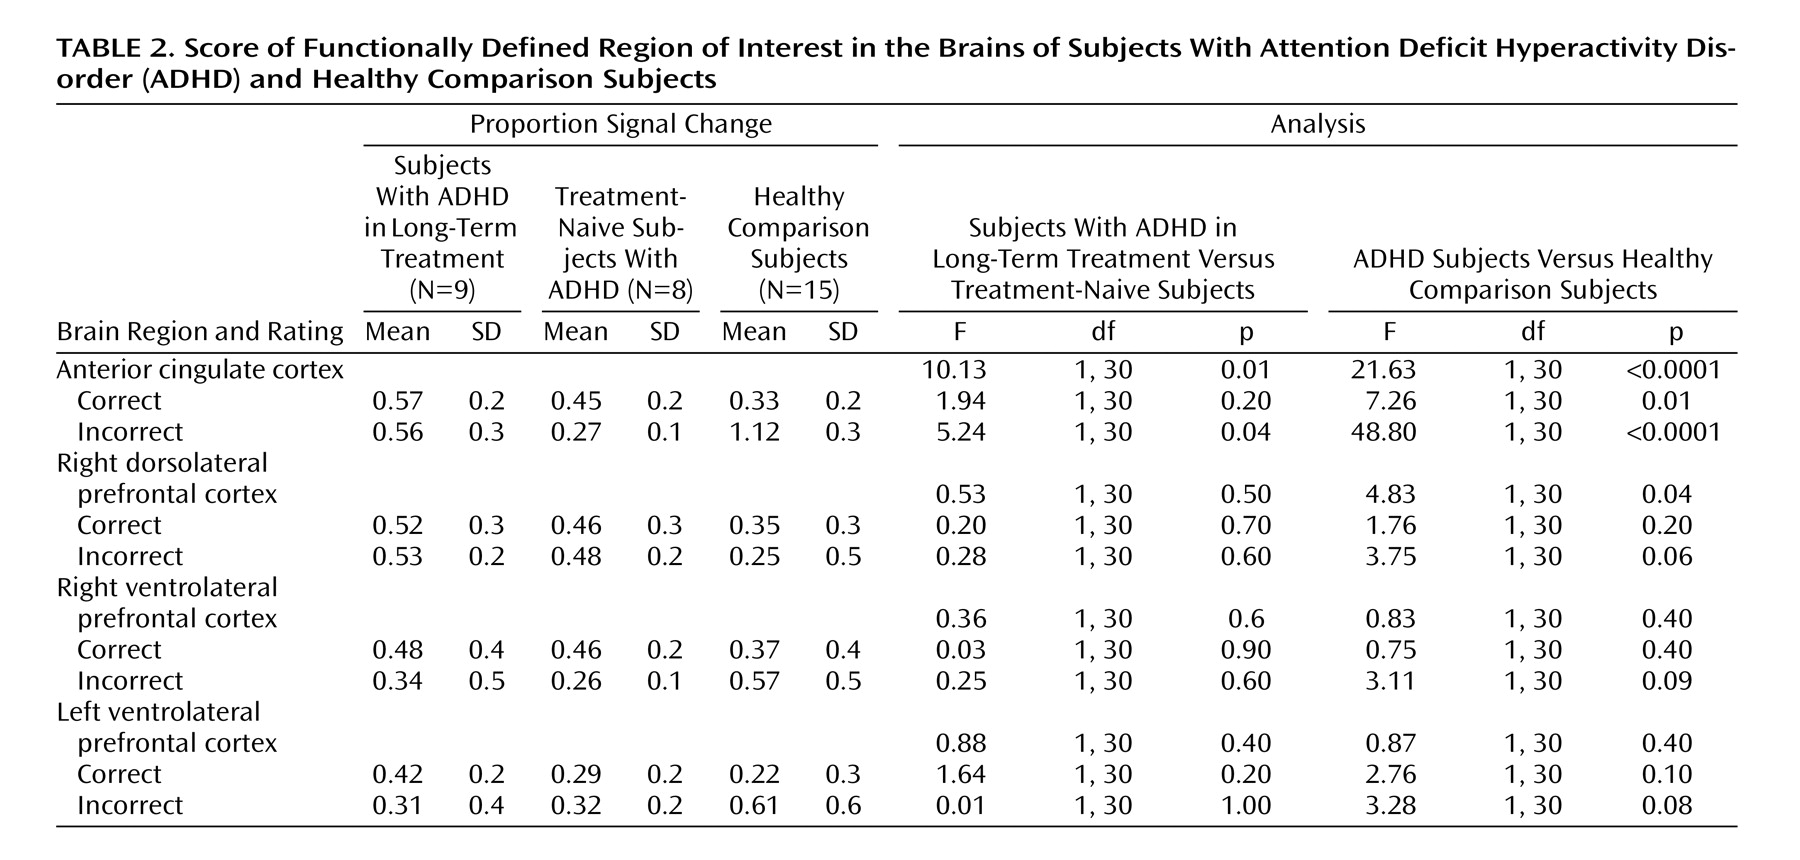
Table 2 show the proportion of signal change for each region of interest by group and trial type. Significant main effects for region of interest (F=6.48, df=3, 28, p<0.001) and trial type (F=4.47, df=1, 30, p=0.04) and a significant interaction of region of interest by trial type (F=5.92, df=3, 28, p<0.0001) indicated differences in proportional signal change between regions for successful and unsuccessful inhibition trials. Although the overall main effect for diagnosis was not significant (F=1.43, df=1, 30, p=0.24), significant interactions of group and region of interest (F=5.81, df=3, 28, p=0.002) and group by trial type (F=11.30, df=1, 30, p=0.002) suggested that children with ADHD show different levels of activation across regions and trial types.
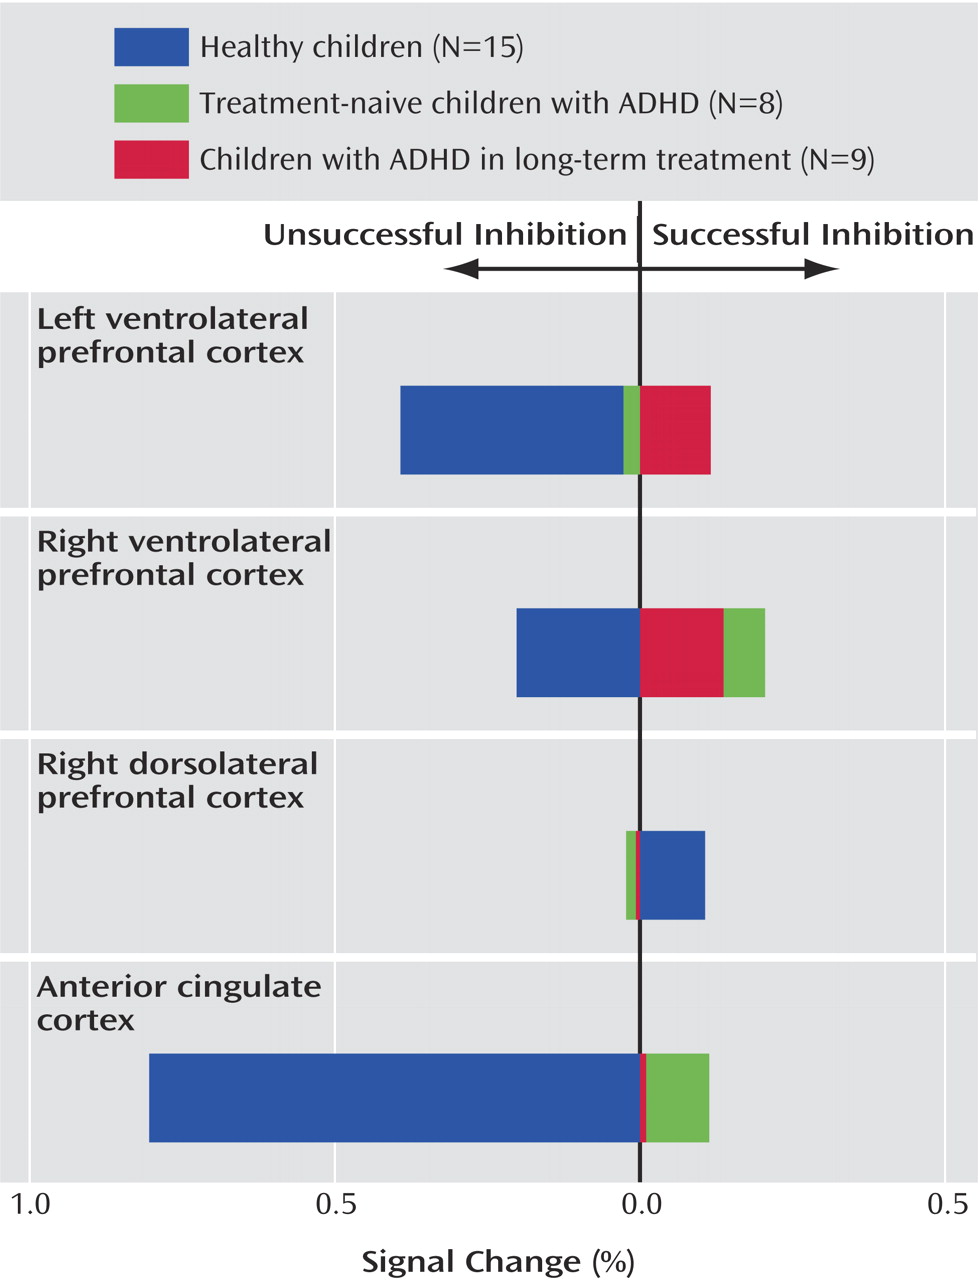
Within the anterior cingulate cortex, main effects of trial type (F=29.80, df=1, 30, p<0.0001) and diagnostic group (F=21.63, df=1, 30, p<0.0001) and an interaction of trial type by group (F=46.15, df=1, 30, p<0.0001) suggested that this region was differentially engaged for successful and unsuccessful inhibition in each group (
Figure 2 ). Although the children with ADHD showed relatively more activation in the anterior cingulate cortex for successful “stop” trials than the comparison subjects (mean=0.51, SD=0.18, versus mean=0.32, SD=0.20) (F=7.26, df=1, 30, p=0.01), they showed decreased activations in relation to comparison subjects during unsuccessful inhibitions (mean=0.42, SD=0.28, versus mean=1.12, SD=0.27) (F=48.80, df=1, 30, p<0.0001). Within-group subtraction scores indicated that in contrast to healthy children who showed significantly more activity in the anterior cingulate cortex for unsuccessful inhibition (mean=–0.80, SD=0.38) (t=–8.03, df=14, p<0.001), the children with ADHD did not differ between correct and incorrect trial types (mean=0.05, SD=0.34) (t=0.62, df=16, p=0.54) (
Figure 3 ).
Contrary to findings in adult subjects, there was no main effect of successful versus unsuccessful inhibition for right dorsolateral prefrontal cortex activity (F=0.32, df=1, 30, p=0.58). Although the subjects with ADHD showed relatively more activation in this region in relation to comparison subjects (F=4.83, df=1, 30, p=0.04), the lack of an interaction of group by trial type (F=0.48, df=1, 30, p=0.50) suggested that increased activity in the right dorsolateral prefrontal cortex in children with ADHD may not be specifically related to inhibitory processing (
Figure 2 ).
Neither the left nor the right ventral prefrontal regions statistically differed between groups (F=0.87, df=1, 30, p=0.40, and F=0.83, df=1, 30, p=0.40, respectively) or between trial types (F=3.05, df=1, 30, p=0.09, and F=0.03, df=1, 30, p=0.90, respectively). However, a significant interaction of group and trial type for the left ventrolateral prefrontal cortex (F=4.96, df=1,30, p=0.03) (
Figure 2 ) and a nearly significant interaction in the right ventrolateral prefrontal cortex (F=3.49, df=1, 30, p=0.07) (
Figure 2 ) suggested that children with ADHD employed these regions differently than comparison subjects. Within-subject subtraction scores indicated that although the healthy subjects showed relatively more activation for unsuccessful inhibition trials (left: mean=–0.39, SD=0.68) (t=–2.22, df=1, 14, p=0.04) (right: mean=–0.20, SD=0.60) (t=–1.28, df=1, 14, p=0.22), subjects with ADHD tended to activate these regions more for successful “stop” trials (left: mean=–0.05, SD=0.41) (t=0.47, df=1, 16, p=0.64) (right: mean=–0.17, SD=0.51) (t=–1.36, df=1, 16, p=0.19).
