Magnetic resonance imaging (MRI) studies generally support the concept of frontostriatal abnormalities in patients with depression
(1). Such changes include deep white matter and basal ganglia lesions and decreased volumes of the prefrontal cortex, the caudate nucleus, and the putamen
(2). Limited evidence suggests that structural abnormalities may be more evident in patients with clinically evident psychomotor change
(1). However, the specific relationships between volumetric changes and other key neuropsychological or genetic features have not been characterized.
A small number of genotypes have been suggested as possible risk factors to late-life depression. Although the apolipoprotein E ε4 (APOE-4) allele is an established risk factor for Alzheimer’s disease, it has not been clearly linked to depression
(3). We recently reported an association between a mutation of the methylenetetrahydrofolate reductase enzyme (which, in combination with dietary cofactors such as folate and vitamins B
6 and B
12, determines the rate of homocysteine metabolism) and late-onset depression
(3). Here, we examine the interrelationships of a key feature of cognition, namely psychomotor speed, with caudate nucleus volumes and genotypes of APOE and the methylenetetrahydrofolate reductase enzyme.
Method
The participants were drawn from a larger cohort study of late-life depression
(3). We have previously reported relationships among clinical features, vascular risk factors, and genetics in these subjects but not neuropsychological characteristics
(3). The current study consisted of 47 patients (age range=30 to 82 years) meeting DSM-IV criteria for a current primary major depressive episode and 20 healthy volunteers (age range=40 to 74 years) recruited from the local community. The study was approved by the Institutional Ethics Committee, and all subjects gave written informed consent.
During a semistructured interview, clinicians recorded the patients’ age at onset of depression, score on the 21-item Hamilton Depression Rating Scale, and CORE rating of psychomotor function
(4).
As part of a wider neuropsychological battery, all subjects were administered the Mini-Mental State Examination and, as a test of psychomotor speed, part A of the Trail Making Test
(5). This test requires the subject to draw a line as quickly as possible to connect 25 numbered circles dispersed on a page.
As described previously
(3), patients who were either heterozygous (N=25) or homozygous (N=8) for a mutation of the methylenetetrahydrofolate reductase enzyme were pooled to indicate those “at risk” of raised homocysteine levels. Similarly, subjects were classified as either positive (N=17) or negative (N=50) for the APOE-4 allele.
Whole-brain volumes were traced from high-resolution MRI scans (124×1.5 mm coronal slices; TR=24 msec, TE=5 msec, field of view=26 cm, matrix=256×256) by using methods previously described
(6). Two raters (S.N., K.T.; interrater reliability=0.86) manually traced the head and body of left and right caudate nuclei in the coronal plane using the BRAINS software package
(7). Volumes (mm
3) of each structure were then computed.
All data were analyzed by using the Statistical Package for the Social Sciences (SPSS, release 10.0.7 for Windows, SPSS Inc., Chicago).
Results
Because of the skewed distribution of scores on part A of the Trail Making Test, results of four patients were curtailed to a maximum of 85 seconds (original scores being 120, 120, 107, and 87 seconds).
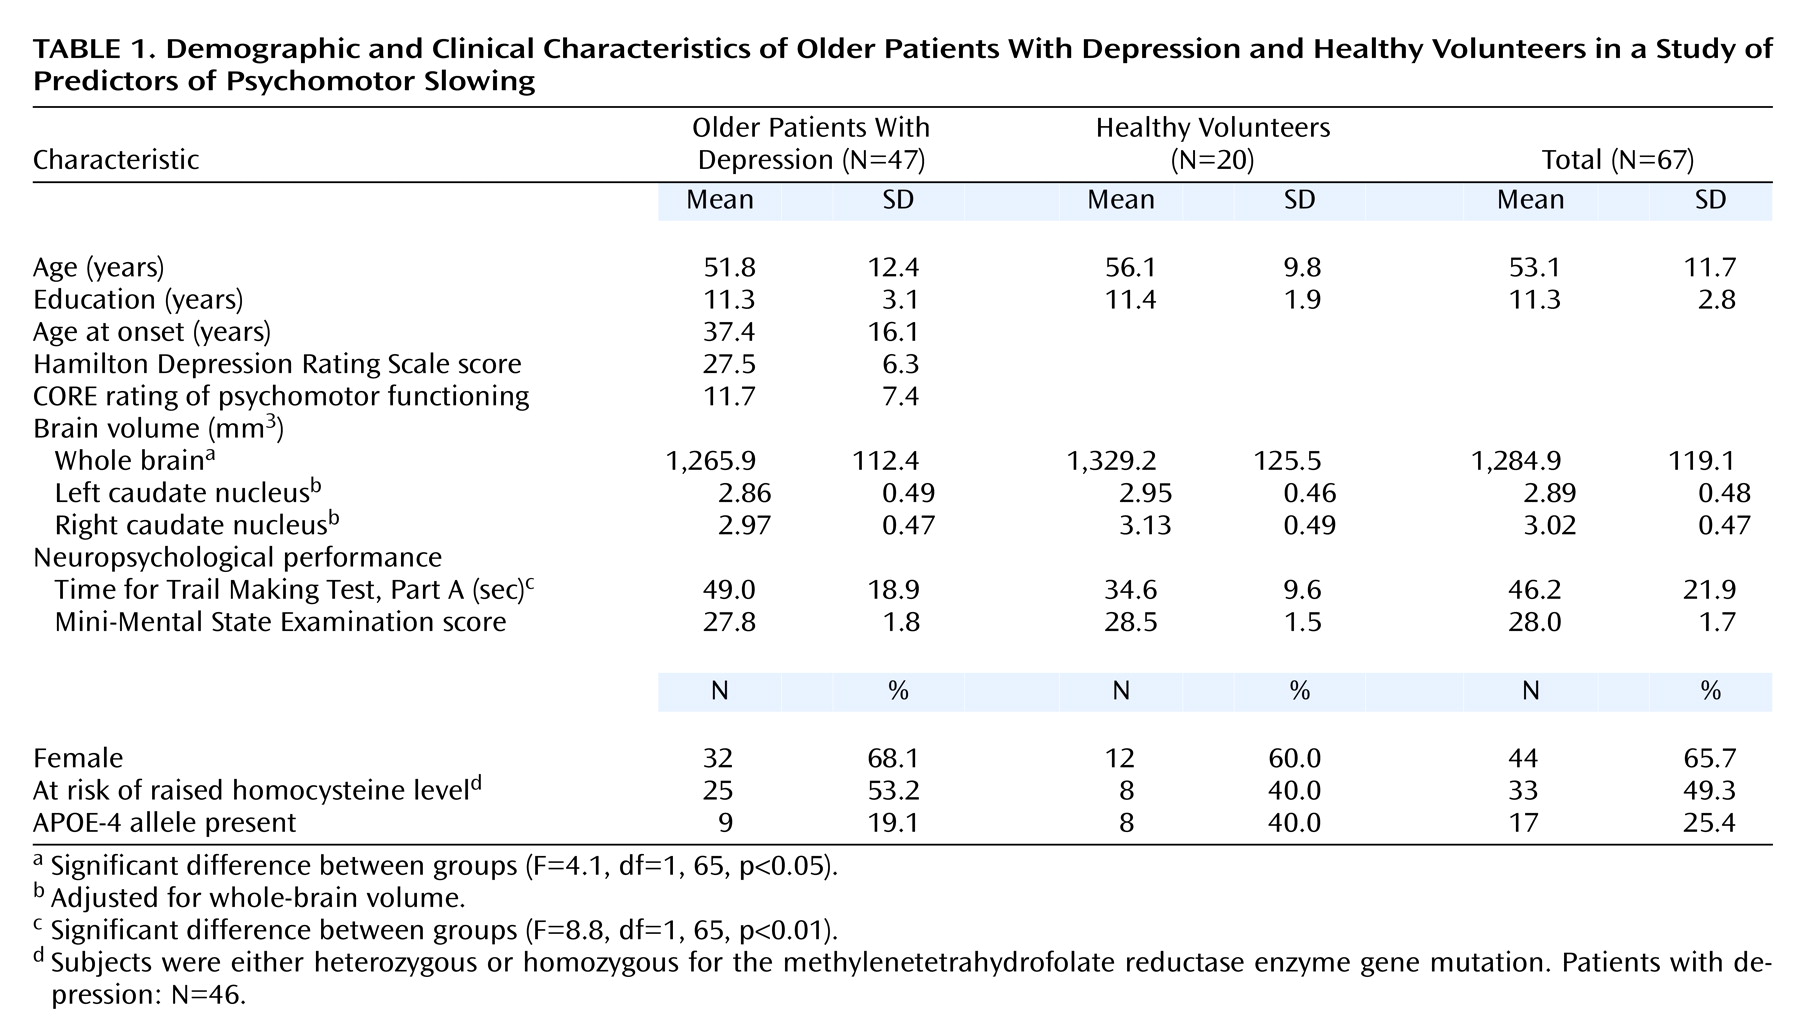
Relative to healthy volunteers, patients with depression had significantly poorer performance on the Trail Making Test and smaller whole-brain volumes (
Table 1). With whole-brain volume as a covariate, however, left caudate nucleus and right caudate nucleus volumes did not differ between persons with depression and healthy volunteers.
For the patients with depression, within-group analyses revealed that Trail Making Test performance was significantly inversely correlated with volume of the left caudate nucleus (r=–0.42, df=45, p<0.01) and the right caudate nucleus (r=–0.49, df=45, p<0.001). Caudate nucleus volumes were not related to Hamilton depression scale score, CORE rating, age at depression onset, or mutation of the methylenetetrahydrofolate reductase enzyme. Age at onset of depression was unrelated to Trail Making Test performance, Hamilton depression scale score, CORE rating, or mutation of the methylenetetrahydrofolate reductase enzyme.
For all subjects, poorer Trail Making Test performance was related to increasing age (r=0.27, df=65, p<0.05), depression diagnosis (t=–3.2, df=65, p<0.01), smaller caudate nuclei volumes (left caudate nucleus: r=–0.41, df=65, p<0.01; right caudate nucleus: r=–0.47, df=65, p<0.001), and mutation of the methylenetetrahydrofolate reductase enzyme (t=–2.3, df=64, p<0.05). There was no relationship between Trail Making Test performance and whole-brain volume or years of education. Presence of the APOE-4 allele was associated with faster Trail Making Test performance (F=4.3, df=1, 65, p<0.05). However, those subjects with the APOE-4 allele had more years of education (t=2.7, df=66, p<0.01). After this variable was controlled, APOE-4 was no longer a significant predictor.
In a multiple regression model, age and whole-brain volume were first entered as a separate block. Left caudate nucleus volume, right caudate nucleus volume, mutation of the methylenetetrahydrofolate reductase enzyme, presence of the APOE-4 allele, and a depressive diagnosis were then entered (stepwise). The overall model predicted 43.2% of the variance in Trail Making Test performance (F=9.1, df=5, 60, p<0.001). Examination of influential data points yielded one criterion outlier (studentized deleted residual=3.2) that, when deleted, resulted in an improvement in the model (R2=48.7%; F=11.2, df=5, 59, p<0.001). Age, whole-brain volume, depression diagnosis, right caudate nucleus volume, and mutation of the methylenetetrahydrofolate reductase enzyme remained significant predictors and uniquely accounted for 4.1% (p<0.05), 1.5% (p<0.19), 15.4% (p<0.01), 9.7% (p<0.001), and 8.9% (p<0.01) of variance respectively, with an additional 9.1% being shared predictor variance.


