Assessment Instruments
The Interview for the Diagnosis of Eating Disorders—IV
(9) was administered by doctoral students in clinical psychology. The interviewers had received extensive training by the first author in semistructured interview procedures and the diagnosis of eating disorders. The Interview for the Diagnosis of Eating Disorders—IV is a semistructured clinical interview that is used to assess the presence or absence of DSM-IV eating disorder symptoms. The presence or absence and severity of each DSM-IV symptom is rated by the interviewer on a 5-point Likert-type scale. A score of 3 or greater indicates the diagnostic threshold of a symptom. After the semistructured interview, the interviewer completes a checklist leading to the appropriate eating disorder diagnosis. The Interview for the Diagnosis of Eating Disorders—IV has been found to have adequate internal consistency, interrater reliability, concurrent validity, and discriminant validity for eating disorder diagnoses made with DSM-IV criteria
(9). The results of tests of the reliability of the diagnoses in this study group were reported in an earlier article
(9); reliability was found to be very high (kappa coefficient=0.85).
After the interview, the body weight and height of each participant were measured. Participants were debriefed about the purpose of the study, and any questions or concerns were addressed.
Data Analysis
One-way analysis of variance (ANOVA) was used to compare age and body mass index in the six groups: participants with anorexia nervosa, bulimia nervosa, eating disorder not otherwise specified, and binge eating disorder; obese comparison subjects; and normal-weight comparison subjects. The Bonferroni correction was used to protect alpha, which was set at p<0.03 for each of the two ANOVAs and for post hoc tests.
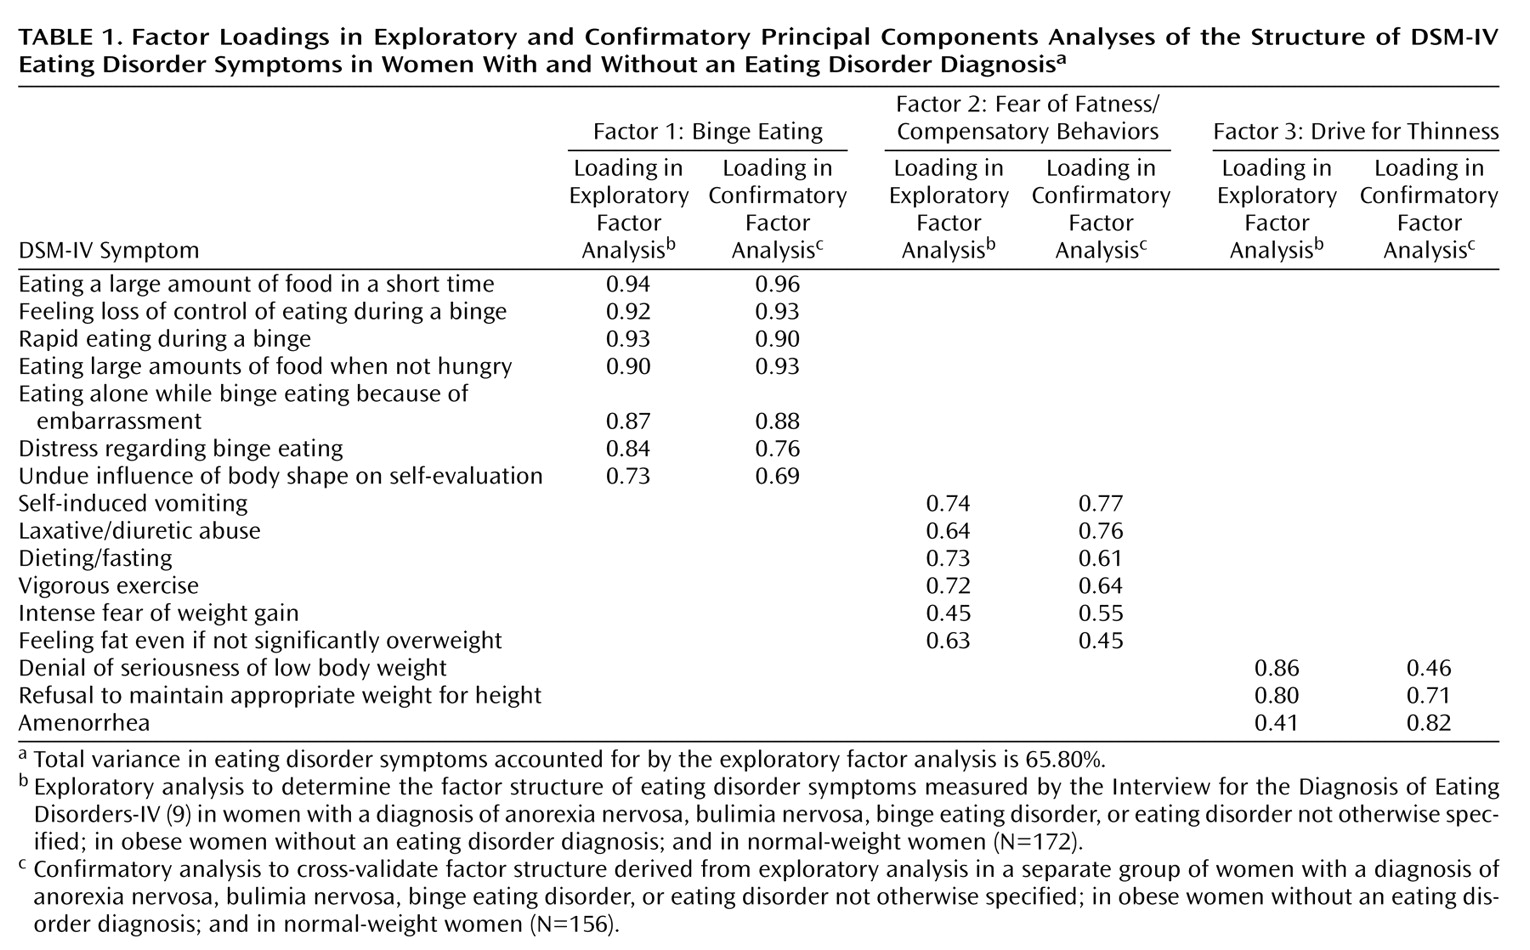
To create two groups for the exploratory and confirmatory factor analyses, the study group was randomly split into two subgroups. We controlled for the frequency of diagnostic groups within each subgroup, which resulted in a slightly larger group for the exploratory factor analysis (N=172 versus N=156 for the confirmatory factor analysis). There were no significant differences between the two subgroups in age, height, weight, and body mass index or in the percentage of individuals from each diagnostic group. Data from first subgroup were used in an exploratory principal components analysis to determine the factor structure of the eating disorder symptoms as measured by the Interview for the Diagnosis of Eating Disorders—IV.
The model derived from the exploratory factor analysis was cross-validated with data from the second subgroup by using confirmatory factor analysis (LISREL VIII)
(10). Two fit indices—the goodness-of-fit index and the comparative fit index—were used to evaluate the model. In confirmatory factor analyses, fit indices are used to assess the degree of congruence between a theoretical model and the data. Like R
2 in regression, fit indices are “meant to quantify something akin to variance accounted for”
(11, p. 82). Thus, fit indices indicate how well the data replicates the theory underlying the data.
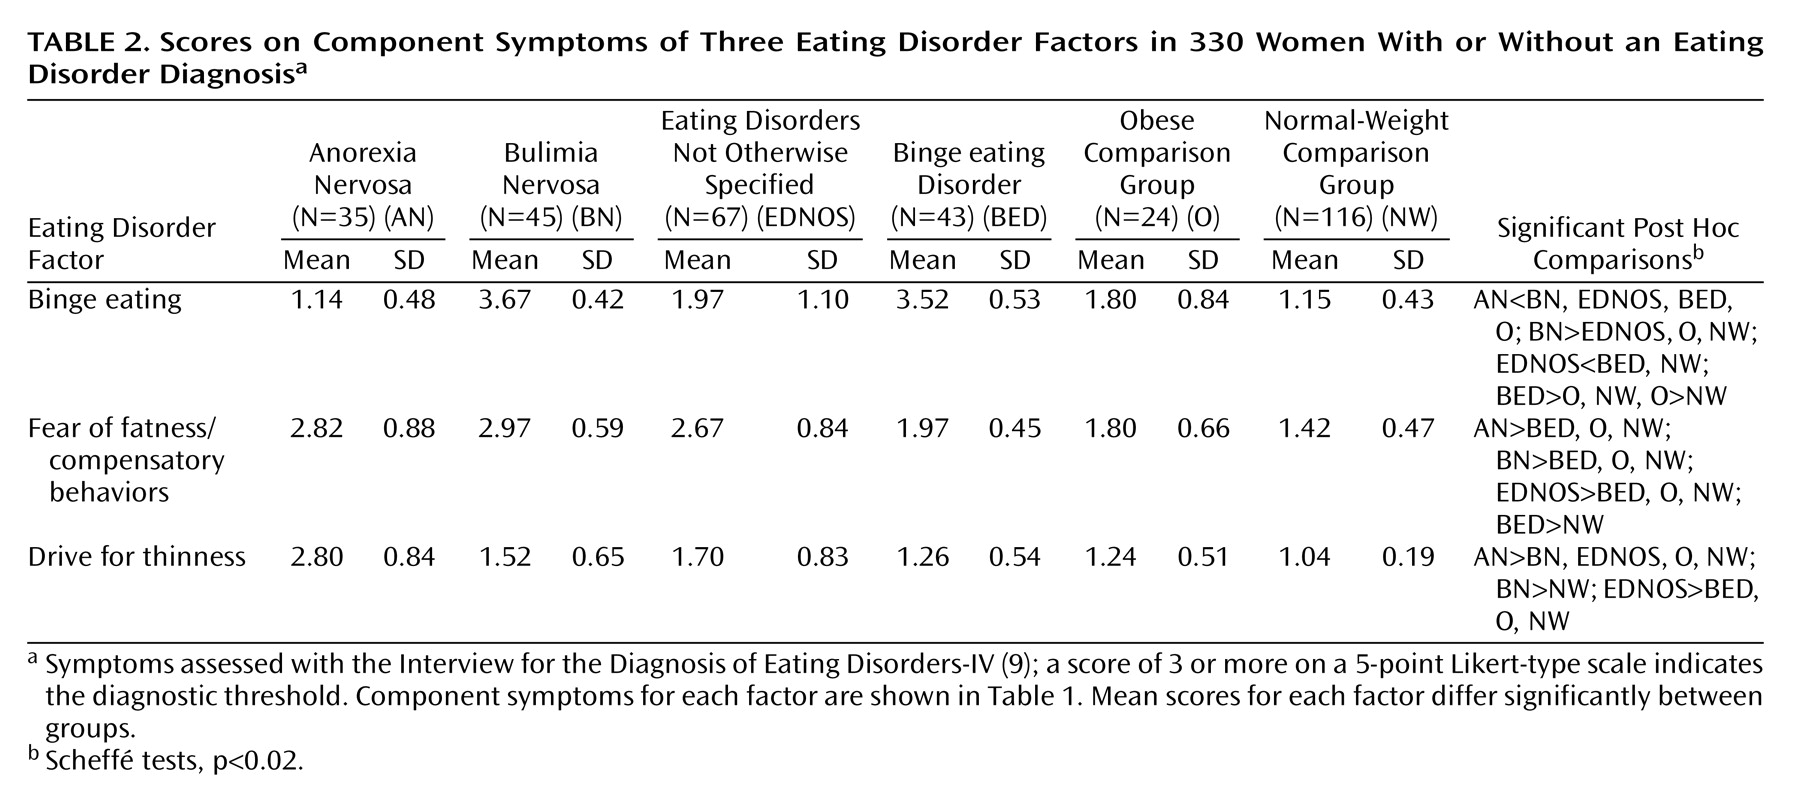
ANOVA was used to compared the diagnostic groups on the average symptom ratings for the symptoms that constituted the factors derived from the factor analyses.
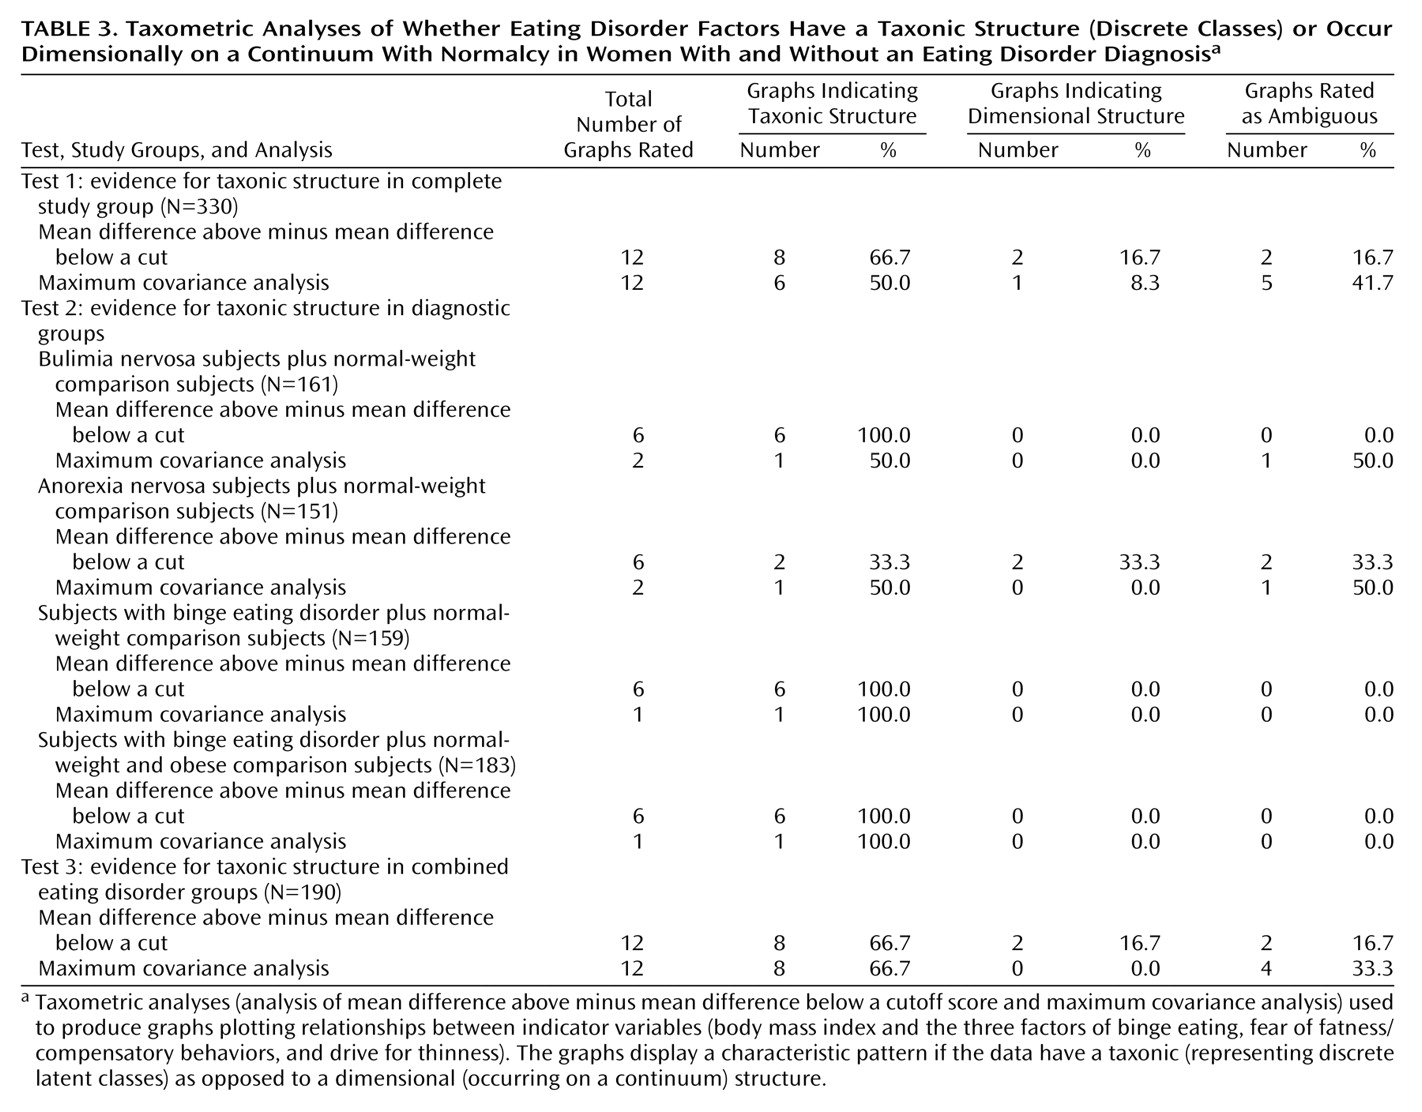
To examine whether the latent factors or features identified in the factor analyses were truly dimensional (i.e., occurred on a continuum) or were representative of latent classes, we used taxometric methods, a group of statistical procedures designed to distinguish types from continua
(8). We used two taxometric techniques described by Meehl
(7): 1) mean difference above minus mean difference below a cutoff score and 2) maximum covariance analysis. Indicator variables were the factor scores derived from the factor analyses plus body mass index, and all analyses were performed by using the S-Plus statistical package (Insightful, Seattle).
Taxometric procedures are based on the assumption that the indicators for a latent construct will relate to one another in a specifiable fashion when the constructs in question are dimensional versus discrete (taxonic). When one plots the relationship(s) between indicators (mean difference above and below a cutoff score and covariances of two variables across successive intervals of a third), these plots will display a characteristic pattern in the taxonic situation that can be clearly and reliably distinguished from data generated from latent dimensions
(7,
8,
12).
Figure 1 shows sample graphs derived from analyses using the mean-above-minus-below-a-cut technique.
Figure 2 shows sample graphs derived from maximum covariance analysis. The three graphs on the left side of
Figure 1 and
Figure 2 indicate taxonic (not dimensional) data. The three graphs on the right side of
Figure 1 and
Figure 2 illustrate findings in support of dimensional data. In both techniques, taxonic data generate a graph that is mountain shaped and has a noticeable peak. The exact location of the peak depends on the base rate of the discrete class or taxon. If the rate is approximately 0.50, the peak will be in the middle. As the base rate decreases, the peak shifts to the right. Dimensional data produce a bowl or valley-shaped graph in the mean-above-minus-below-a-cut technique and flat graphs in maximum covariance analysis.
We performed three sets of analyses with the two taxometric techniques. First, the entire data set was tested to determine whether the eating disorders were on a continuum with normality or constituted a discrete class. Second, data for each disorder were compared with data for an appropriate comparison group. For these analyses, we used as indicators only the features that discriminated the specific clinical and nonclinical group. Third, we excluded the data for the comparison subjects and applied the taxometric procedures to the data for the combined eating disorder groups (anorexia nervosa, bulimia nervosa, eating disorder not otherwise specified, and binge eating disorder) to evaluate whether the eating disorder syndromes were distinct syndromes, i.e., showed signs of taxonic structure.
For all taxometric analysis, the graphs were evaluated by a trained rater and categorized as suggestive of taxonicity or dimensionality or as ambiguous. In previous research, this rating procedure has yielded highly reliable data
(12).


