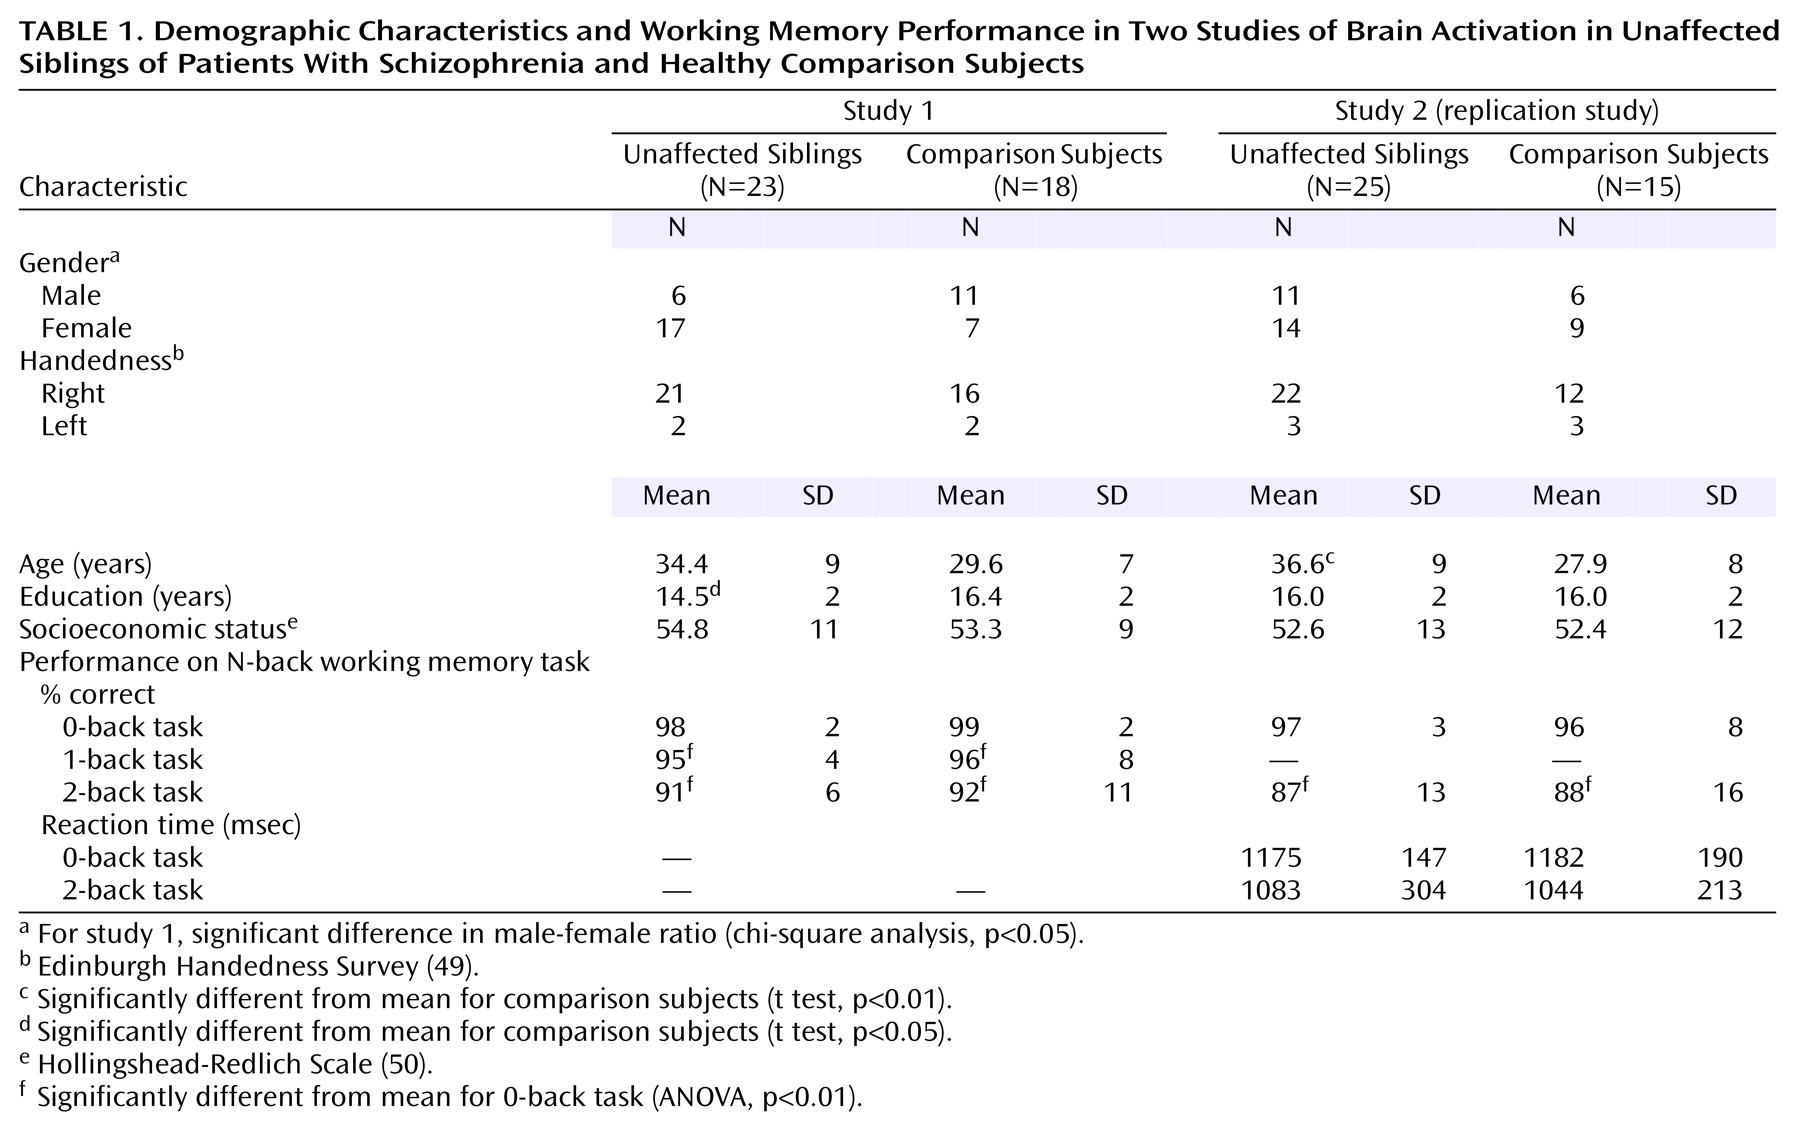
Subjects and Experimental Protocol
We performed two studies in two independent groups—an initial investigation followed by a planned replication. In the first study, we compared 38 unaffected siblings of schizophrenic patients to 32 healthy comparison subjects using the N-back working memory task. fMRI data from 18 healthy comparison subjects were reported previously
(29). In the second study, we compared fMRI data from 30 unaffected siblings and 23 healthy comparison subjects. The details of recruitment of patients, their siblings, and healthy comparison subjects as part of the Clinical Brain Disorders Branch Sibling Study (Protocol 95-M-0150) are described elsewhere
(16). Briefly, patients were recruited from local and national sources advertised in print, by word of mouth, and on the Internet. Probands with diagnoses of schizophrenia and schizoaffective disorder were selected. All siblings of suitable probands were contacted and invited to participate. Healthy volunteers were recruited from the National Institutes of Health Clinical Research Volunteer Program and were screened in an identical fashion to patients and siblings. This study was approved by the institutional review board of the intramural program of the National Institute of Mental Health. All subjects gave written informed consent before participation.
Healthy siblings of schizophrenic patients (both cohorts) and healthy volunteers were given the Structured Clinical Interview for DSM-IV (SCID)
(47) to determine the presence of any psychiatric illnesses, a neurological examination, a battery of neuropsychological tests, an EEG, and a screening MRI examination
(16). Siblings were included only if they did not have schizophrenia or a schizophrenia spectrum disorder (e.g., schizoaffective disorder, schizotypal and schizoid personality disorders)—hereafter referred to as “unaffected siblings.” Additional exclusion criteria included the inability to give informed consent, an IQ below 70, a history of substance abuse within the past 6 months, a history of significant neurological illness, and any focal abnormalities found by EEG or MRI. The healthy comparison subjects were screened by using the same criteria. The comparison subjects were matched to the siblings for age, gender, years of education, handedness, and socioeconomic status as closely as possible.
After the fMRI data collection, our most important inclusion criterion was fMRI data quality, as has been discussed elsewhere in greater detail
(35,
48). From the first study, 15 siblings and 14 comparison subjects were excluded for insufficient data quality, leaving a final cohort of 23 unaffected siblings and 18 healthy comparison subjects (
Table 1). In the second study, five siblings and eight comparison subjects were excluded because of insufficient data quality, leaving a final second cohort of 25 siblings and 15 comparison subjects (
Table 1). While comparison subjects and siblings were screened to exclude schizophrenia spectrum diagnoses, four unaffected siblings had a history of major depression. Overall, 78% of the siblings from these families were successfully recruited. In general, more than one sibling per proband was recruited wherever possible; however, only one sibling per proband was included in the two studies reported herein. The probands of these siblings were composed of 18 patients with schizophrenia and five patients with schizoaffective disorder, depressed type, with the following demographic characteristics: age 39 years (SD=10), 20 of 23 were men, duration of illness=16 years (SD=10), 18 of 23 treated with atypical antipsychotics (chlorpromazine-equivalent dose=584 mg, SD=383), and 14 years of education (SD=2). In the second study, four of the unaffected siblings had a history of major depression. Overall, 87% of the siblings from these families were successfully recruited. The probands of these siblings were composed of 22 patients with schizophrenia and three patients with schizoaffective disorder with the following demographic characteristics: age 38 years (SD=7), 22 of 25 were men, duration of illness=17 years (SD=9), 14 of 25 treated with atypical antipsychotics (chlorpromazine-equivalent dose=337 mg, SD=154), and 14 years of education (SD=2). Attrition was not selective, and all data-quality checks were performed blind to subject identity and diagnosis. The demographic characteristics were similar between those included and those excluded. Specifically, IQ, score on the Wide Range Achievement Test, Revised (WRAT-R)
(51), age, education, and family socioeconomic status were not different in the first study. The only significant difference in the second study was that IQ was slightly higher for the siblings included (IQ=110) than those excluded (IQ=106) (t=2.1, df=28, p=0.04). N-back performance did not differ between those included and those excluded in either study. All subjects included in these analyses were of European American ancestry. The unaffected siblings were not different from the comparison subjects in global cognitive function (comparison subjects’ mean IQ=105.9, SD=15.8, versus siblings’ mean IQ=108.3, SD=13.0; comparison subjects’ mean WRAT-R score=108, SD=7, versus siblings’ mean WRAT-R score=109, SD=9).
All subjects underwent a training session immediately before fMRI data acquisition to practice the N-back task as described previously
(29,
35,
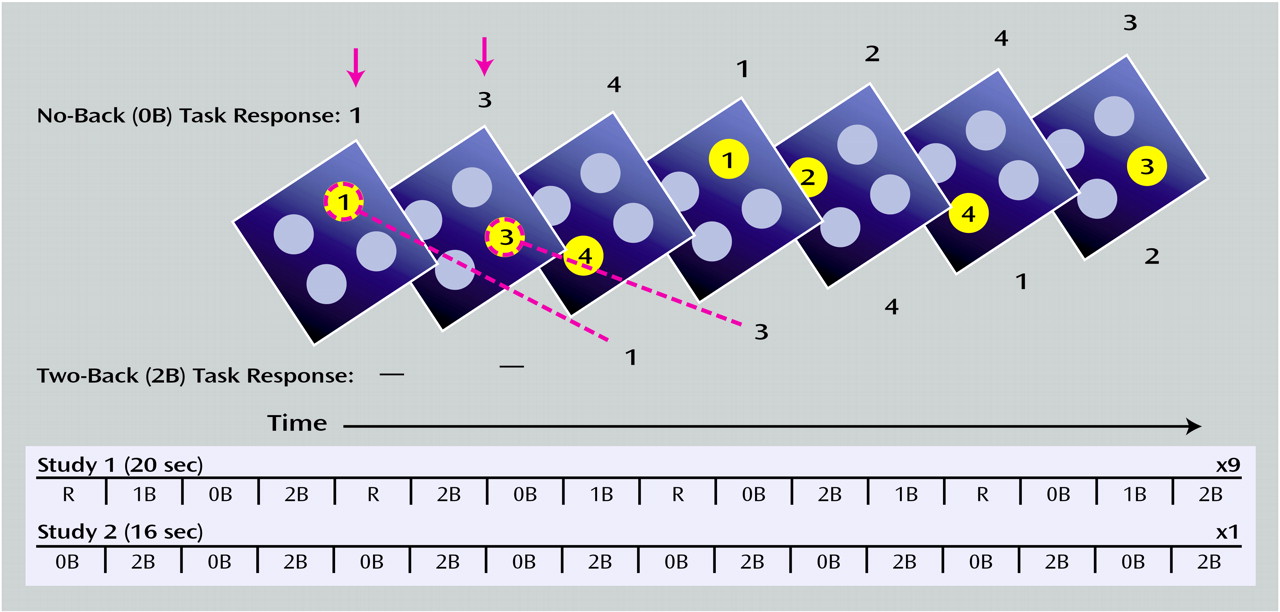
46). Designed to force subjects to constantly update their mental set while minimizing interference from incoming stimuli, our version of the N-back task consisted of continual presentation of visual stimuli (the numbers 1–4 appeared randomly every 1.8 seconds for 500 msec) at set locations at the points of a diamond-shaped box (
Figure 1). In contrast to other versions of the N-back task, every number was both a probe and a target (i.e., a 100% target). Instructions displayed above the diamond informed the subjects to recall the stimulus seen “N” previously. The stimuli were generated by a standard desktop computer running in-house software (by R. Coppola) and presented by means of a fiber-optic goggle system (Resonance Technology, Van Nuys, Calif.). Responses were recorded by means of a fiber-optic response box with buttons arrayed in the same configuration as the stimuli presented on the screen and relayed back to the computer for tabulation of performance accuracy. The original N-back program used in the first study only recorded accuracy; however, reaction time was added for the second study. Working memory load was varied across the following range: 0 back, 1 back, and 2 back in the first study and between 0 back and 2 back in the second study. The different levels of working memory load (0 back, 1 back, and 2 back) entailed delays of 0, 1.8, and 3.6 seconds, respectively, between the probe and the target. Before beginning the fMRI scanning session, all of the subjects were trained to the point at which their performance (accuracy) for each level of the task (0 back, 1 back, and 2 back) remained constant. We found no significant changes in N-back performance over the duration of a typical fMRI scanning session beyond this point
(35).
Demographic characteristics were compared between the siblings and the comparison subjects in the following manner: gender and handedness were compared between groups by using chi-square, while age, years of education, and socioeconomic status were compared between groups by using two-tailed t tests (STATISTICA, StatSoft, Inc., Tulsa, Okla.). Performance data were analyzed as follows: between-group comparisons of performance (both studies) and reaction time (second study only) were made by using repeated-measures analysis of variance (ANOVA) with diagnosis as the between-group and working memory load as the within-group factors, followed by post hoc planned comparisons (STATISTICA, StatSoft, Inc., Tulsa, Okla.).
fMRI Data Analysis
For both studies, fMRI data processing began with registration of whole-brain fMRI volumes by using a sinc interpolation
(55) to the initial fMRI brain volume of a block. These whole-brain volumes were then transformed into standard space
(55–
58). Voxel-wise signal intensities were ratio normalized to the whole-brain mean and then detrended in a linear fashion with the baseline at each voxel set to 1,000. To control for interindividual variance in regional anatomy, data were smoothed with a Gaussian filter (10×10×10 mm) in the same manner as has been applied to previous patient data sets
(29,
35). We analyzed these data using statistical parametric mapping (SPM 99; http://www.fil.ion.ucl.ac.uk/apm)
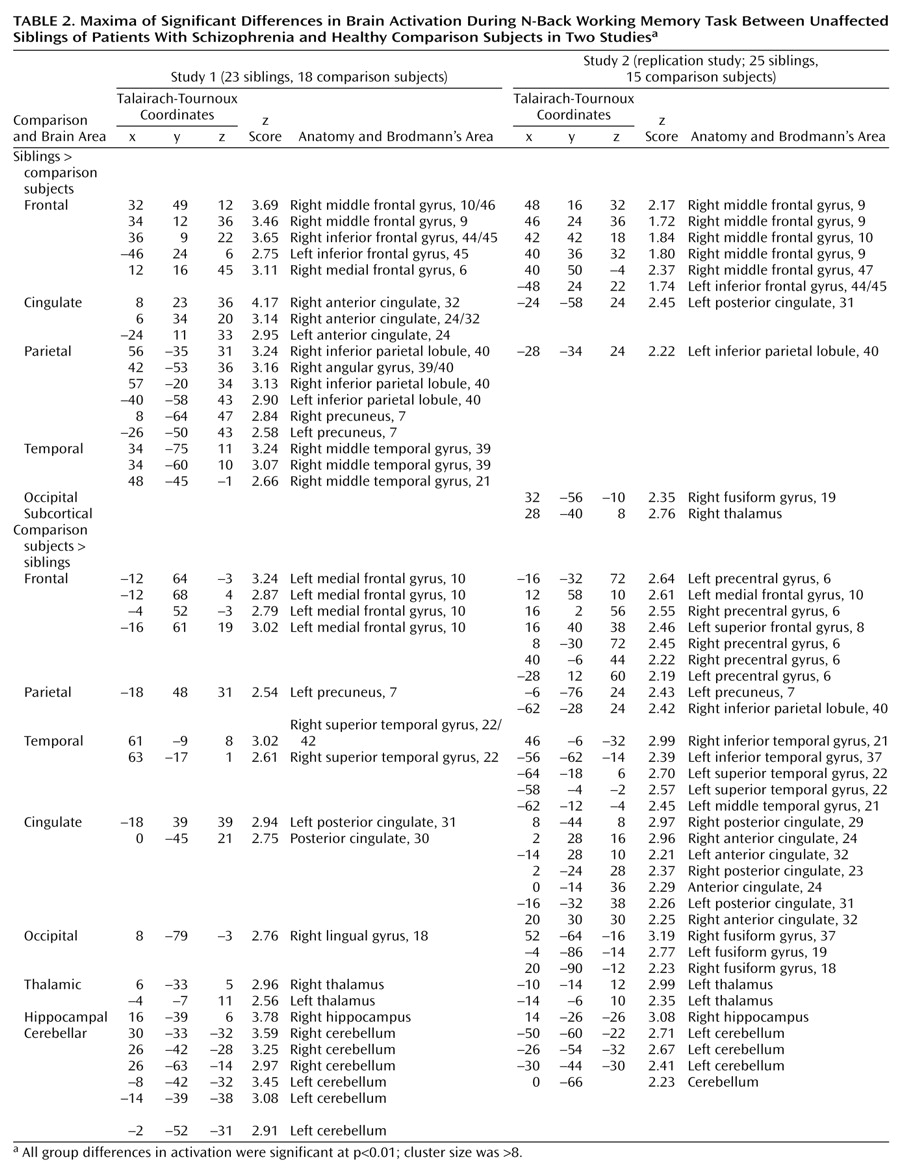
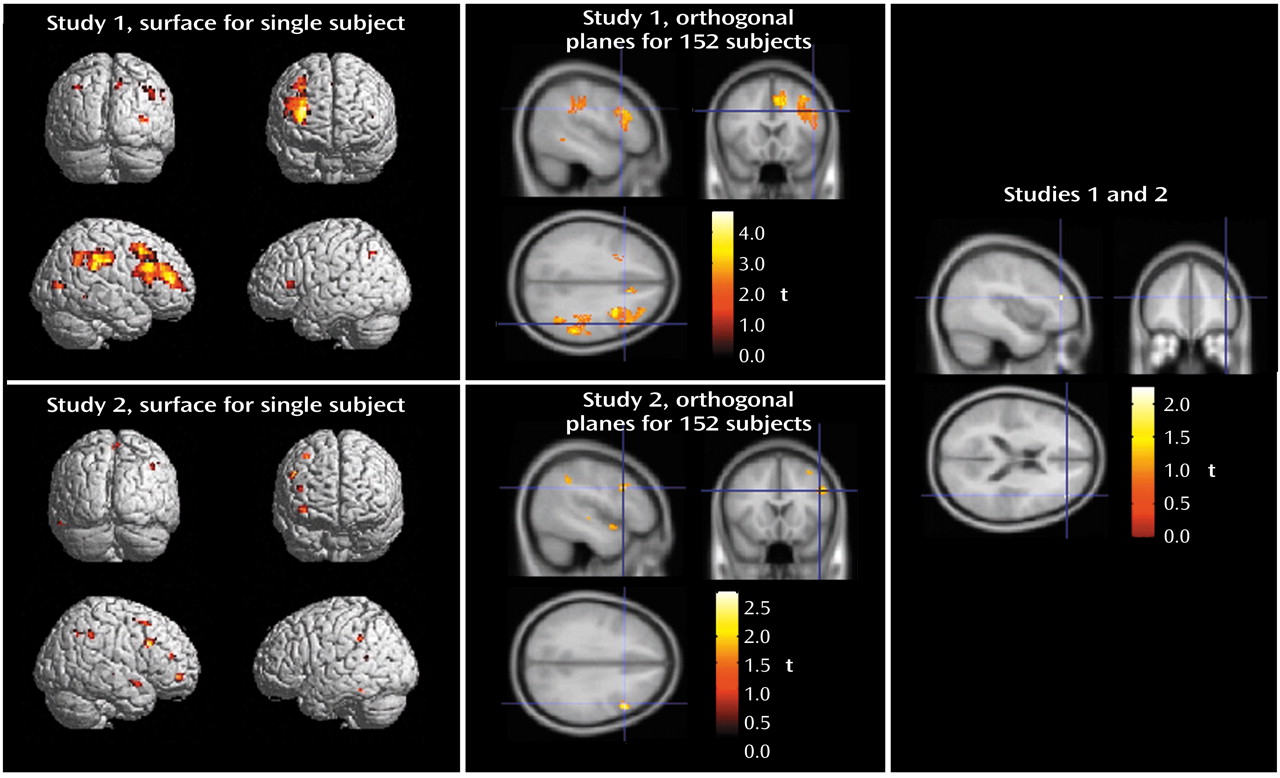
(59). In both studies, fMRI data were analyzed as time series modeled by a sine wave shifted by an estimate of the hemodynamic response. Individual subject maps were created by using one-sample t tests. The resultant contrast images were then entered into second-level (random effects) analyses for each data set separately, consisting of ANOVAs comparing siblings and comparison subjects, followed by analyses of covariance (ANCOVAs) examining the effects of age, education, and gender as determined by the demographic differences between groups. Finally, to address activation commonalities between data sets, we used the statistical parametric mapping results from the first study to create a mask that limited the analysis to the dorsolateral prefrontal cortex regions showing a significant group difference between unaffected siblings and comparison subjects. Statistically significant group differences (
Table 2) were reported as voxel-intensity z values. For anatomical localization, statistical maxima of activation were converted to conform to the standard space of Talairach and Tournoux
(60). For the first study, we chose a statistical threshold of p<0.01 (uncorrected) with a minimum cluster size of eight voxels. Because the second study was a planned replication, we adopted a more liberal threshold of p<0.05 and a minimum cluster size of eight voxels.