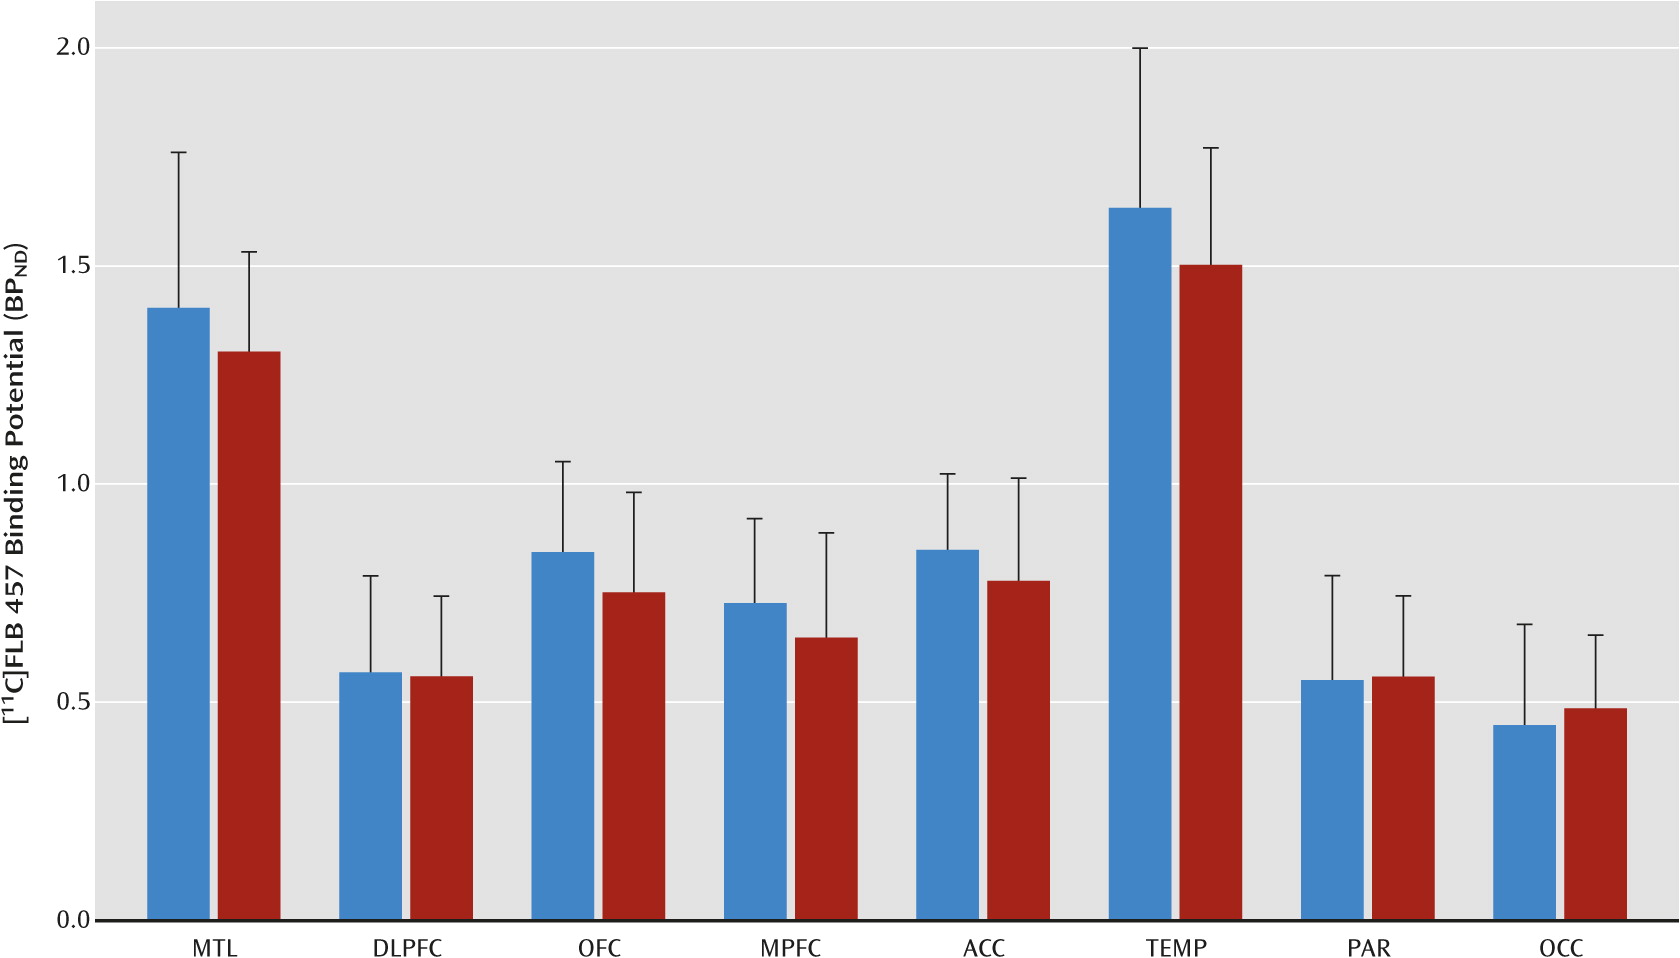
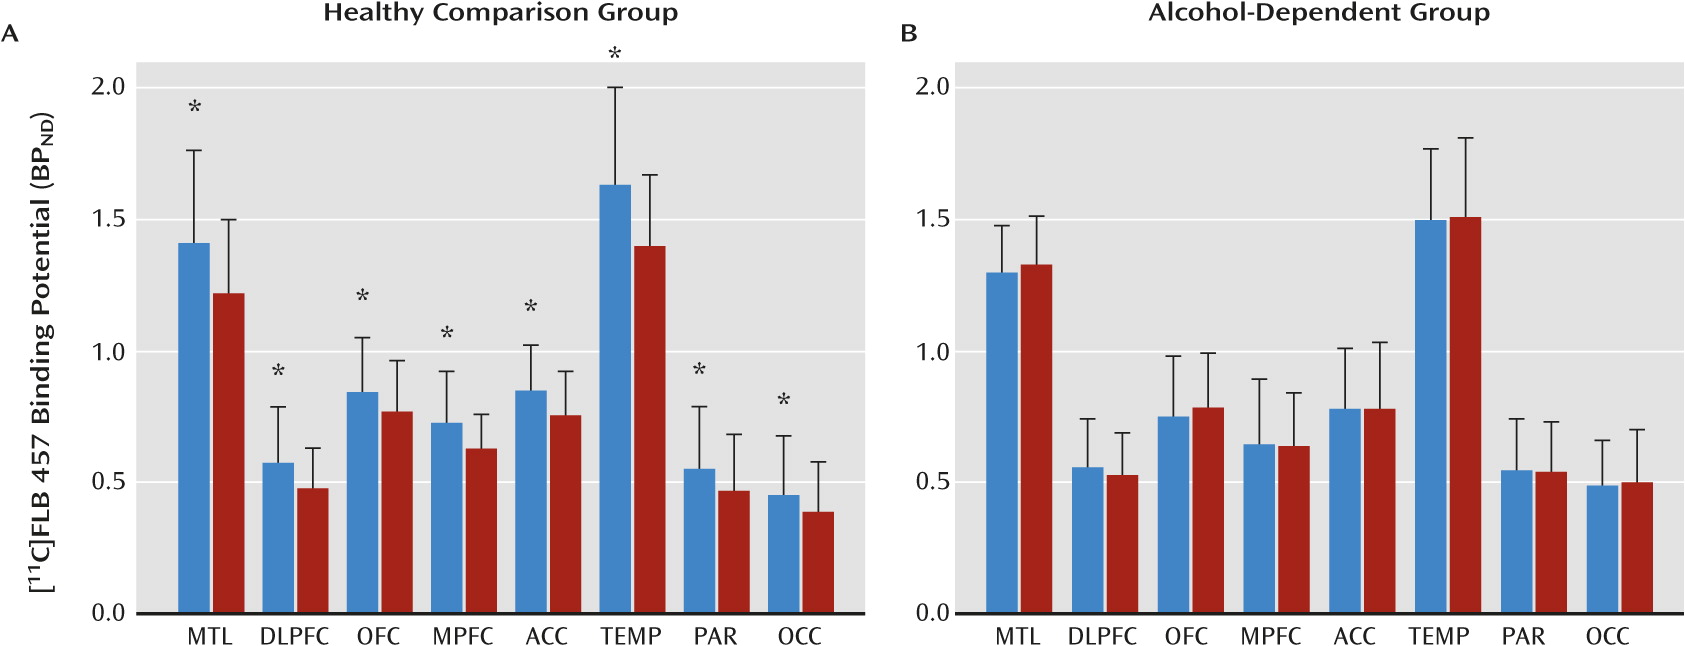
Participants
Seventy-seven individuals with alcohol dependence and 36 healthy comparison subjects were enrolled in the study, and 21 individuals from each group completed the study. The study was approved by the University of Pittsburgh Institutional Review Board and the Radioactive Drug Research Committee. All participants provided written, informed consent. The alcohol-dependent and healthy comparison groups were largely recruited through advertisements displayed at local community centers, on buses, in newspapers, and on websites. Additionally, addiction medicine clinics and hospital emergency departments in the community also referred alcohol-dependent patients. Study criteria for inclusion in the alcohol-dependent group were 1) male or female aged 18–40 years of any ethnic/racial origin; 2) fulfillment of DSM-IV criteria for alcohol dependence as assessed by the Structured Clinical Interview for DSM-IV Axis I Disorders; 3) no current or past DSM-IV axis I disorder other than alcohol abuse or dependence, including abuse of or dependence on other recreational drugs (nicotine dependence was allowed); 4) no current use of cocaine, opiates, cannabis, sedative-hypnotics, amphetamines, 3,4-methylenedioxy-N-methylamphetamine, or phencyclidine (as confirmed by urine drug screen at the study screening); 5) not currently taking any prescription or over-the-counter medications; 6) no current or past chronic medical or neurological illnesses (including glaucoma, seizure disorders, a focal finding on MRI such as stroke or tumor, chronic obstructive pulmonary disease or respiratory disease, renal problems, and liver problems) as assessed by a complete physical examination and laboratory examination; 7) no resting systolic blood pressure >140 mm Hg and no diastolic blood pressure >90 mm Hg; 8) no more than one risk factor for coronary artery disease (e.g., smoking, obesity, cholesterol >240 mg dl−1, sedentary lifestyle, etc.); 9) no first-degree relative with a psychotic or mood disorder; 10) not currently pregnant; 11) no history of radioactivity exposure from nuclear medicine studies or occupation; and 12) no metallic objects in the body that are contraindicated for MRI.
Participants in the alcohol-dependent group completed a minimum of 14 days of outpatient abstinence monitored with witnessed urine toxicology. They were monitored for alcohol and recreational drug use with urine alcohol metabolites (ethyl glucuronide and ethyl sulfate) and urine drug screens three times per week for 2 consecutive weeks. Since alcohol metabolites and common drugs of abuse can be detected for 2–3 days after use, individuals in this group were informed that they should not use alcohol or street drugs for the 14 days before the PET study. In order to promote abstinence from alcohol during this 2-week period, they were paid $75.00 for each urine sample that was negative for ethyl glucuronide and ethyl sulfate. They were scheduled for the PET scans after successful completion of the abstinence monitoring protocol. Individuals who tested positive for ethyl glucuronide and ethyl sulfate were offered up to three attempts to restart the abstinence monitoring protocol. This abstinence monitoring protocol ensured that all persons in the alcohol-dependent group were abstinent for a minimum of 2 weeks before the PET scan. This group was also monitored for alcohol withdrawal signs and symptoms three times during the first week of abstinence using the Clinical Institute Withdrawal Assessment for Alcohol Scale (
23). Those who were at risk of severe withdrawal (i.e., scored >19 on the Clinical Institute Withdrawal Assessment for Alcohol Scale and had a history of alcohol withdrawal seizures or delirium tremens) were excluded from the research protocol. The severity of alcohol dependence was assessed with the Michigan Alcoholism Screening Test (
24) and the Alcohol Dependence Scale (
25).
Healthy comparison subjects, matched for age, gender, ethnicity, and smoking status, had no past or present neurological or psychiatric illnesses, including substance abuse (as confirmed by urine drug screen, at both the study screening and the day of the PET scan). Both the healthy comparison and alcohol-dependent groups underwent the PET scans as outpatients. Following the completion of the PET scans, those in the alcohol-dependent group were scheduled for a follow-up visit, during which they were debriefed of the risks of alcohol abuse and provided with a referral for outpatient treatment.
Image Acquisition and Analysis
Following a structural MRI, participants underwent a baseline and a postamphetamine [
11C]FLB 457 PET scan in the same experimental session using procedures previously described (
18).
Briefly, [
11C]FLB 457 was synthesized using the methodology reported by Halldin et al. (
26). PET imaging sessions were conducted with the ECAT EXACT HR Plus camera (CTI-Siemens, Munich, Germany). Following a transmission scan, participants received an intravenous bolus injection of [
11C]FLB 457, and emission data were collected for 90 minutes. Arterial blood samples were collected to measure the plasma free fraction (f
P) for [
11C]FLB 457 and to derive a metabolite-corrected arterial input function for modeling using methods previously described (
18). The maximum injected mass for [
11C]FLB 457 was restricted to 0.6 μg (
27). The postamphetamine [
11C]FLB 457 scan was performed 3 hours after the administration of 0.5 mg kg
−1 of oral
d-amphetamine. During this scan, amphetamine blood levels were measured in three arterial samples drawn at 0 minutes, 45 minutes, and 90 minutes and analyzed using methods described by Reimer et al. (
28).
PET data were reconstructed and processed with the image analysis software MEDx (Sensor Systems, Sterling, Va.) and SPM2 (
www.fil.ion.ucl.ac.uk/spm) as previously described (
18). Frame-to-frame motion correction for head movement and MR-PET image alignment were performed using a mutual information algorithm implemented in SPM2. MRI segmentation was performed using the automated segmentation tool in Functional MRI of the Brain Software Library (
29). Cortical (medial temporal lobe, dorsolateral prefrontal cortex, orbital frontal cortex, medial prefrontal cortex, anterior cingulate cortex, temporal cortex, parietal cortex, and occipital cortex) and subcortical (midbrain and cerebellum) regions of interest were defined on the MRI using a segmentation-based and direct identification method previously described (
19,
30,
31). Regional volumes and time activity curves were then generated in MEDx as outlined by Abi-Dargham et al. (
30,
31). Primary analysis included the eight cortical regions that had been validated in our previous [
11C]FLB 457 human studies (
18–
21). Secondary analysis included the midbrain as a region of interest to test whether there is convergence between the midbrain dopamine cells and terminal fields. Derivation of [
11C]FLB 457 volumes of distribution expressed relative to total plasma ligand concentration (V
T) in the regions of interest (V
T ROI) and cerebellum (V
T CER) was performed using a two-tissue compartment kinetic analysis with the arterial input function we previously described (
18).
PET outcome variables are defined in accordance to the consensus nomenclature for in vivo imaging of reversibly binding radioligands (
32). The D
2/3 receptor availability at the baseline and postamphetamine conditions was estimated using BP
ND, which was derived as follows:
In this equation, fND (which equals fP/VT CER) is the free fraction of [11C]FLB 457 in the nondisplaceable compartment, Bavail is the density of D2/3 receptors (nmol L−1) available to bind to [11C]FLB 457 in vivo, and KD is the in vivo equilibrium dissociation constant of [11C]FLB 457 (nmol L−1).
The amphetamine-induced change in BPND (ΔBPND) was calculated as the difference between BPND measured in the postamphetamine condition (BPND AMPH) and BPND measured in the baseline condition (BPND BASE) and expressed as a percentage of BPND BASE as follows:
Finally, because our validation work with [
11C]FLB 457 demonstrated D
2/3 specific binding in the cerebellum, there was concern that any amphetamine-induced change in V
T CER could bias the dopamine-release outcome measure, ΔBP
ND (BP
ND is dependent on VT
CER; see Equation 1). Therefore, to arrive at a dopamine-release measurement in the cortex (i.e., D
2/3 receptor occupancy following amphetamine administration) that is independent of V
T CER, we analyzed the baseline and postamphetamine V
T values from the eight cortical regions of interest with Lassen plots as described by Cunningham et al. (
33). Briefly, the equation for the line [y=mx+b], where y=[V
T BASELINE–V
T AMPHETAMINE] and x=V
T BASELINE, produced a linear relationship with the slope of line equal to the receptor occupancy (m). This approach assumed that there is uniform receptor occupancy across the cortical regions.


